THE BETA CANIS MAJORIS STARS
by A. VAN HOOF, Louvain
Summary. - Definition of the beta CMa stars. Description of their
variations. Their place in the sky and in the H-R diagram. The members
of the group. Period-luminosity and period-spectrum relations. The
various interpretations of the observed variations and the objections
against them. The writer's arguments in favour of the hypothesis of
coupling between two radial pulsations of different modes.
1. Definitions. - In a discussion on stars with multiple periodicities
the Beta Canis Majoris stars certainly deserve a good deal of the attention
and I shall therefore, - at Dr. Detre's request, - give you a short survey
of the facts known up to the present about these puzzling stars and of the
various and hitherto unsuccessful suggestions advanced to interpret their
intricate variations.
Beta CMa-stars, - to start with a definition, - are B-stars which undergo
in their brightness m and in their radial velocity RV a double oscillation
with two nearly equal and short periods (3 to 6 hours). The amplitudes of the
oscillations in m are very small, those of the variations in RV are fairly
large to large; one of the oscillations produces a change of the same period
in the width of the spectral lines, the other leaves these line widths
unaffected (or nearly so?).
There are beta CMa stars in which only one of the oscillations is
found, but in those cases we believe in the non-detection of the missing
oscillation because of its small amplitude, rather than in a real
non-occurrence. On the other hand some beta CMa stars display further
more or less pronounced changes in their RV.
2. Description of the variations.
In order to describe all these variations unambiguously Otto Struve [1]
has proposed the following system of notations:
P_1, K_1, Delta m_1 = the duration, semi-amplitude in RV and amplitude
in m of this short period oscillation which leaves the
line widths unaffected;
P_2, K_2, Delta m_2 = the duration, semi-amplitude in RV and amplitude in
m of this short period oscillation which is found back
in the line widths;
P_3 = the beat period resulting from the interference between
the P_1 and P_2 variations;
P_4 or I_4 = the period or the pseudo-period or "characteristic
interval" of the variation in K_2 observed in some stars;
P_5 or I_5 = the period or the "characteristic interval" in the
variation of the gamma-velocity of,
the P_2K_2-oscillation,
which may be the same as that of the P_1K_1-variation,
if the latter exists.
As to the numerical values associated with these symbols, the following
can be said:
P_1 and P_2 range from somewhat more than 3 hours to 6 hours *;
* According to D. H. McNamara 3h 17m might well be an inferior limit [2].
K_1 and K_2 range from a few km/sec to tens of km/sec;
Delta m_1 and Delta m_2 rarely exceed a tenth of a magnitude;
P_3 ranges from 7 to 50 days;
P_4 and P_5 range from a few days to several years.
Precise data are given in Table 1.
The question naturally arises whether the colour and the spectral
type of a beta CMa star do change or not at the same time as the brightness and
the radial velocity.
As far as the colour is concerned the answer is definitely positive for
those stars for which accurate colour measures are available, the star being
bluer at maximum brightness. It looks safe to generalize this conclusion.
The spectral type variation on the other hand almost escapes detection.
Owing to the inherent difficulty to get accurate equivalent widths this is
not in contradiction with the results from colorimetric investigations which
reveal the temperature changes in these stars to be limited to a few hundred
degrees in most cases, thence a corresponding change of one spectral
subdivision at the most.
Of primary importance for the detection of the mechanism that is
responsible for the various observed changes, are of course the amplitude-and
phase-relations existing between them. In this connexion the following
points seem well established:
a) Amplitude relations:
1. There is no correlation between the periods P_1 and P_2 on the
one hand and the amplitudes Delta m or K on the other.
2. There is no correlation between K_1 and K_2.
3. There is a direct correlation between the amplitudes of the brightness
variations and the amplitudes of the RV variations; the
ratio (Delta m/K)_1 appears to be definitely larger than the ratio
(Delta m/K)_2. Personally I think this latter circumstance deserves
special consideration and I shall come back to it further on.
4. There is a direct correlation between K_2 and the amplitude of
the line broadening.
b) Phase relations:
1. In each of the P_1 and P_2 variations the star is brightest at the
moment when the corresponding RV crosses the gamma-axis on the
descending branch of its own velocity curve, in other words,
at the moment of maximum contraction if the pulsation hypothesis
is adopted. Minimum brightness occurs at the opposite crossing.
2. Maximum line width occurs at the moment when the RV in the
P_2-variation crosses the gamma-axis on the descending branch of its
own velocity curve. Minimum line width occurs at the opposite
crossing.
3. The place of the beta CMa stars. - In the sky the known beta CMa stars
are situated, with only two exceptions (nu Eri and delta Cet) in the vicinity
of the galactic aequator. This was to be awaited from the galactic concentration
of the early B stars.
In the Hertzsprung-Russell diagram they occupy a small area limited
by the abscissae B_1 and B_2 and the ordinates -5M and -3M (luminosity-classes
II and IV). Their clustering in this small area is so pronounced that
M. Walker [3] wondered whether all the stars situated in this particular
area would not be variables of this type.
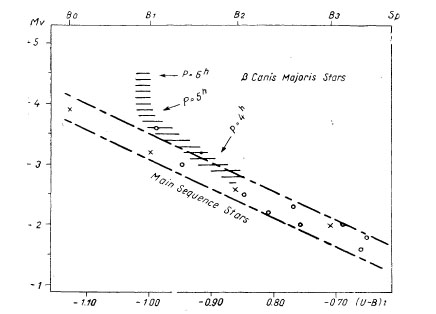 Fig. 1. - The sequence of the beta CMa stars in the colour-absolute
magnitude diagram. The open circles and crosses represent individual
normal stars belonging to the main sequence.
(Reprinted from P. A. S. P., 67, 135, 1955. See bibl. note 12.)
The answer, arrived at by Walker himself, is however negative. He observed
photoelectrically five stars out of eleven listed by Morgan for having the
same spectral features and luminosity criteria as the known beta CMa stars,
but only one among these five showed signs of variability and even in this
case the variations found were not convincing enough to adopt the star (o Per)
as a new member of the beta CMa family. In fact Walker's search for new
beta CMa stars yielded only one new object (nu Eri) out of the forty B_0-B_5
stars investigated by him, and so justified the conclusion that these
variables are rather exceptional.
4. The known members of the group. - The same conclusion can be derived
from a glance at the various lists of beta CMa stars that have been published
since the time of their recognition as an independent type of variables.
Instead of growing longer, these lists rather show a shrinkage, as most of the
suspected members had to be dropped on closer investigation.
The list which Henroteau published in 1928 in the Handbuch der Astrophysik
(VI, 436, 1928) contained 29 stars known or suspected to be beta CMa stars,
but only 22 among them were of type B.
Fig. 1. - The sequence of the beta CMa stars in the colour-absolute
magnitude diagram. The open circles and crosses represent individual
normal stars belonging to the main sequence.
(Reprinted from P. A. S. P., 67, 135, 1955. See bibl. note 12.)
The answer, arrived at by Walker himself, is however negative. He observed
photoelectrically five stars out of eleven listed by Morgan for having the
same spectral features and luminosity criteria as the known beta CMa stars,
but only one among these five showed signs of variability and even in this
case the variations found were not convincing enough to adopt the star (o Per)
as a new member of the beta CMa family. In fact Walker's search for new
beta CMa stars yielded only one new object (nu Eri) out of the forty B_0-B_5
stars investigated by him, and so justified the conclusion that these
variables are rather exceptional.
4. The known members of the group. - The same conclusion can be derived
from a glance at the various lists of beta CMa stars that have been published
since the time of their recognition as an independent type of variables.
Instead of growing longer, these lists rather show a shrinkage, as most of the
suspected members had to be dropped on closer investigation.
The list which Henroteau published in 1928 in the Handbuch der Astrophysik
(VI, 436, 1928) contained 29 stars known or suspected to be beta CMa stars,
but only 22 among them were of type B.
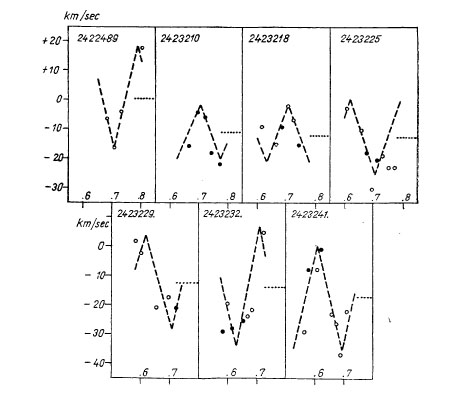 Fig. 2. - Henroteau's radial velocities of theta Oph for the Julian
day marked on each plot. Abscissae are fractions of the Julian day.
(Reprinted from Ap. J., 124, 168, 1956.)
The Gaposchkins in Variable Stars (pp188-189, 1938) listed 30 possible
members of which 17 were considered as "probable" but of these only 9 were
of spectral type B.
Till recently only 10 stars were known for certain - mainly through
the work of Struve and his associates at Berkeley, - to be beta CMa stars.
To them must now be added theta Oph. This star had its place on Henroteau's
list but it was discarded afterwards, probably because it did not fit into the
period luminosity and period spectrum relations to which the other members
were found to conform. I rediscussed Henroteau's 1920 and '22 observations
Fig. 2. - Henroteau's radial velocities of theta Oph for the Julian
day marked on each plot. Abscissae are fractions of the Julian day.
(Reprinted from Ap. J., 124, 168, 1956.)
The Gaposchkins in Variable Stars (pp188-189, 1938) listed 30 possible
members of which 17 were considered as "probable" but of these only 9 were
of spectral type B.
Till recently only 10 stars were known for certain - mainly through
the work of Struve and his associates at Berkeley, - to be beta CMa stars.
To them must now be added theta Oph. This star had its place on Henroteau's
list but it was discarded afterwards, probably because it did not fit into the
period luminosity and period spectrum relations to which the other members
were found to conform. I rediscussed Henroteau's 1920 and '22 observations
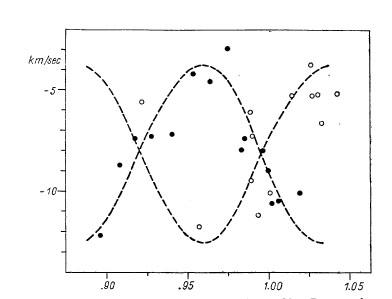 Fig. 3. - Radial velocity observations of theta Oph in February 1955.
Dots are observations on "even" Julian days, circles refer to observations
on "odd" Julian days. (Reprinted from Ap. J., 124, 168, 1956.)
Fig. 3. - Radial velocity observations of theta Oph in February 1955.
Dots are observations on "even" Julian days, circles refer to observations
on "odd" Julian days. (Reprinted from Ap. J., 124, 168, 1956.)
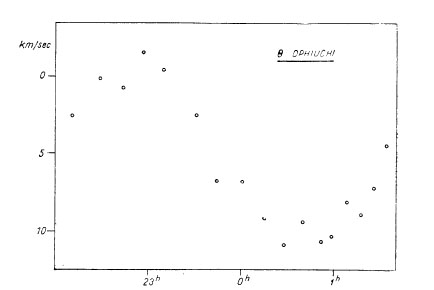 Fig. 4. - Provisional radial velocities of theta Oph in the night
April 30-May 1 of this year. From measurements by the writer on Pretoria
plates taken by Dr. Feast.
this winter and found that the period should be of the order of 1d/6.5
instead of 1d/3.5 as proposed by Henroteau. When treated with this
period the observations reveal also a change of the gamma-velocity and
the existence of beats,
Fig. 4. - Provisional radial velocities of theta Oph in the night
April 30-May 1 of this year. From measurements by the writer on Pretoria
plates taken by Dr. Feast.
this winter and found that the period should be of the order of 1d/6.5
instead of 1d/3.5 as proposed by Henroteau. When treated with this
period the observations reveal also a change of the gamma-velocity and
the existence of beats,
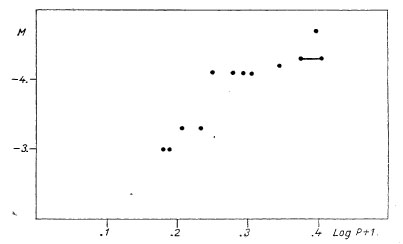 Fig. 5. The period-absolute magnitude relation for beta CMa stars
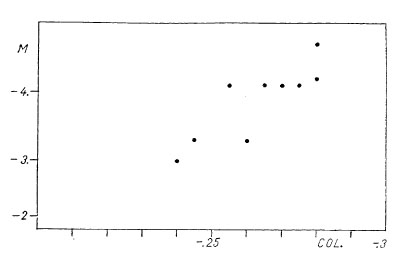 Fig. 6. The colour-absolute magnitude relation for beta CMa stars
all features quite common among beta CMa stars. Measures by myself on 29
McDonald spectrograms, taken in February 1955 by Father Bertiau as
part of A. Blaauw's program on the Sco-Cen cluster confirmed this
viewpoint. The results will probably be published in the July issue of the
Astrophysical Journal. To investigate the variations closer, more than 300
spectrograms have been obtained last spring at my request at the observatories
of Fort Davis, Toronto, Pretoria, MtStromlo and La Plata. I seize
this opportunity to express my sincere gratitude to DrDr. Blaauw, Heard,
Thackeray, Buscombe and Gratton of these respective institutes for their
kind and effective co-operation. The plates are now being measured and the
results available so far give evidence that the expected period of
3h 42m is close to the truth, and that beats and gamma-velocity variations
are really present
While Fig. 2 and 3 respectively show my interpretation of Henroteau's
earlier RV measures and my own measures of RV on Bertiau's plates, Fig. 4
illustrates provisional results obtained from Pretoria-plates, taken in the
night April 30-May 1 of this year. The new period places the star, which is
of spectral type B_2-IV and of M_v = -3.0, at its right place among the other
members of the group. It is worth-while to mention that theta Oph is a member
of the moving cluster in Sco-Cen so that we have an independent and accurate
means to derive its parallax and absolute magnitude and thence to test the
zero point of the period luminosity curve.
At present then we have 11 stars of which the beta CMa character is
established beyond doubt. Particulars about them are given in Table 1 which is
a reproduction, - except for the data relative to the youngest member, -
of Struve's synoptic Table on p. 150 of the Publications of the Astronomical
Society of the Pacific (67, 1955).
Table 1
STARS OF THE BETA CANIS MAJORIS GROUP
P_1 P_2 2K_1 2K_2 Spectral Line Rot
Star Delta m_1 Delta m_2 Colour M_v
h m h m (km/sec) (km/sec) Type profile Vel.
beta CMa 6 00 6 02 12 6 0.03 - B_1 II-III -0.280 -4.7 Changes L
sigma Sco 5 44 5 55 15 110 - 0.08 B_1 III - -4.3 " L
or
6 07
xi^1 CMa 5 02 - 36 - 0.01 - B_1 IV -.280 -4.2 Const. S
or
0.045
BW Vul=
- 4 49 - 150 - 0.19-0.26 B_2 III -.270 -4.1 Changes A
HD 199140
12 DD Lac 4 44 4 38 15 36 0.042 0.074 B_2 III -.265 -4.1 " A
beta Cep 4 34 - 18-46 - 0.02-0.05 - B_2 III -.275 -4.1 Const. S
nu Eri 4 16 4 10 22 49 0.067 0.114 B_2 III -.255 -4.1 Changes A
16 EN Lac 4 06 4 04 9 30 0.035 0.055 B_2 IV -.260 -3.3 " S
delta Cet 3 52 - 13 - 0.025 - B_2 IV -.245 -3.3 Const. S
theta Oph 3 42 ? 22? 14? ? ? B_2 IV ? -3.0 Chang.? S
gamma 3 38 - 7 - 0.015 - B_2 IV -.240 -3.0 Const. S
L=Large=+-60 km/sec A=Average =+-30 km/sec S=Small=15km/sec.
The line profiles vary with period P_2
5. The period-luminosity and period-spectrum relations. - In the above
table the stars have been listed in the order of decreasing periods. The
inspection of columns 8-9-10 shows at once that this order is also the one
of advancing spectral type or colour and of decreasing luminosity, in other
words, the Table reveals the existence of a period spectrum and of a
period-luminosity relation. The latter was established first by Blaauw
and Savedoff [4], the former by McNamara [5] and again by McNamara and
Williams [6]. Fig. 5 and 6 show in graphical form the present state of our
knowledge concerning these relations; they have been constructed with
the aid of the data collected from Table 1.
6. The various interpretations of the observed variations. - There can be
said from the outset that the final explanation of the intriguing variations
in these stars has not yet been found. We are still at the stage of hypotheses,
each of them accounting for a good deal of the observed phenomena but
leaving one or more points in the dark or raising fatal objections. Although
most of them appear to have no future a brief review of them cannot be out
of place in a survey like this and it may even be useful by warning against
blind-alleys in further research.
Most of the hypotheses have one point in common: they see in the
complicated changes demonstrated by the beta CMa stars the combined effect
of stellar rotation and stellar pulsation.
a) The satellite hypothesis. - An ordinary star cannot revolve around
a B star in so short an interval as 4 hours; even if the surfaces of the two
bodies were in contact with each other the revolution would take one day
to one day and a half. Nevertheless W. F. Meyer, who held beta CMa under
observation for years and who was the first to discover the double periodicity
in its radial velocity variation [7], tried to understand the star as a binary,
and as a binary of a somewhat particular nature. In his mind beta CMa consisted
of a primary, the B star, and of a real satellite of small mass but high density,
thence very small volume. The mass ratio m_1/m_2 would not be less than 100
and the diameter of the satellite would be small enough for any eclipse feature
in the light-curve to be washed out. The superdense satellite would revolve
around the primary at only a small height above the photosphere of the latter
and thereby excite that overtone (P_2) of the natural pulsation of the primary
which lies closest to the orbital period (P_1). The intensity with which this
overtone is excited will depend upon the value of 1/(P_1-P_2)^2 and this
circumstance makes it understandable why of two objects of the same class
such as beta Cep and beta CMa the first shows no overtone variation at all
while the second shows it even stronger than the P_1 variation. The difference
in constitution between these two stars is indeed strong enough to make the
difference in overtone period quite plausible.
Remained the variation in line width. This was ascribed to variable
turbulence of an irregular character, some sort of explosions which would
set up a free pulsation of variable phase and amplitude.
The scheme might look attractive as long as there were only a couple
of such stars to be accounted for, but with about a dozen of them known
at present it appears unable to answer the following questions:
1. Why are all the members of the group B stars?
2. Why is the free oscillation period always so very close to the period
of the forced oscillation?
b) The turbulent spot hypothesis. - Struve [8], who discussed most
of Meyer's observations after the latter's death, and who tried to make the
best of the satellite hypothesis, devoted special attention to the periodic
line broadening and line doubling. In his opinion the satellite would cause
a local disturbance on the surface of the primary, a kind of "turbulent spot"
which would produce deep and narrow absorption lines; the rest of the primary's
surface would remain unaffected and be quite uniform and the absorption
lines which it produced would show appreciable rotational broadening, the star
being supposed in rapid axial rotation. The broad line stage would correspond
to the interval that the spot is on the hemisphere turned away from the earth,
the sharp line stage to the passage of the spot over the visible hemisphere,
and the observed variation of the radial velocity would find its origin in the
successive motions of approach and of recession as the spot travels over this
hemisphere. But this picture too raises several objections, the most serious
of which is that, with a reasonable diameter for the spot, both the RV and the
line width should remain constant as long as the spot is hidden from view,
while the observations show on the contrary a continuous change of these
attributes [1].
Before the strength of the objections Struve finally gave up the satellite
and turbulent spot hypotheses, but he went on adhering to the opinion that
the star's axial rotation is the principal agent in the process of line
broadening or doubling [9].
c) The hypothesis of a polar-aequatorial oscillation. - In 1952,
probably under the influence of the emphasis laid upon the necessity to
take rotation into account for the interpretation of the phenomena,
several astronomers began to favour the idea that the beta CMa stars
were single rapidly rotating stars which suffered radial pulsations with
slightly different periods at the poles and at the aequator [10]. In the
minds of some of them (among which is the writer) the difference between
the periods of the polar and of the aequatorial oscillations was caused
by the flattening at the poles, produced itself by the star's rotation;
in the opinion of others (Menzel) quoted by Struve [9] a magnetic field
was held responsible for this difference.
The model had the advantage to account in an easy way for the two
interfering periods and for the differences between individual stars. The
latter may indeed be ascribed to differences in the angle between the axis
and the line oŁ sight and to differences in velocity.
A weak point is that the broadening of the lines remains unexplained.
d) The hypothesis of nonradial oscillations. - P. Ledoux [11] has
investigated the general characteristics of the nonradial oscillations in
a rotating star. He arrives at the conclusion that in the simplest case
the free oscillations are threefold: besides a stationary wave there are two
travelling waves running in opposite directions around the axis. The three
frequencies lie close together, that of the stationary wave being moreover
the arithmetic mean of the two others. When the line of sight lies in the
aequator each running wave produces a large and variable line broadening of the
same period as the wave itself. The curves illustrating these broadening are
however shifted over a quarter of a period with respect to the RV curves;
the shift is negative for the variation of shorter period and positive for the
other.
These results seemed extremely promising for the understanding of
the beta CMa stars. They explained at once the occurrence in the same star of
variations with periods always so close to each other and of oscillations
having so different a bearing on the line widths. The confrontation of the
theory with the observations of beta CMa was however a setback. Of the two
running waves only the one of greater period was present and the theory
could not explain how the other one could remain unexcited; even worse,
the phase-shift of the line broadening appeared to have the wrong sign when
compared with the prediction of the theory.
Ledoux also discussed briefly the case of forced oscillations, but
this brings us back to the satellite hypothesis. Besides the objections already
mentioned, the difficulty for the primary to accommodate the satellite and
the fact that the so-called orbital period is found back in the light-curve
further make this hypothesis unlikely.
e) The ejected atmosphere hypothesis. - Mainly in an attempt to explain
the peculiar line doubling found in BW Vulpeculae Struve proposed the
following working hypothesis which was further advocated by Odgers [12]:
At regular intervals a beta CMa star expels an atmosphere which rises
to a certain height and then falls back into the star. One of the components
of each double spectral line comes from this rising or falling shell the other
comes from the quiet atmosphere. The period with which the ejections take
place depend upon the internal constitution of the star, the "flight time"
of the shell is conditioned by the effective gravity. It happens that both
intervals are of the same order; from their ratio however will depend the
presence or the absence of beats. With the ratio: flight time/ejection
period < 1 there will be a stillstand in the radial velocity curve, with
the same ratio > 1 there will be beats, as that shell moves furthest which
does not collide with returning shells.
But once more the picture does not give complete satisfaction, the most
serious difficulty coming from the constancy of the equivalent widths. This
constancy indeed suggests that the two components of the spectral lines
come from regions of the stellar surface which are next each other instead
of being the one above the other [13].
f) The hypothesis of coupling between usual radial oscillations of different
modes. - The hypothesis of coupling between the pulsations in the fundamental
mode and in some higher mode, the period of which is nearly half that of the
principal mode, has been invoked twenty years ago by Miss Kluyver to
explain the existence of two very similar periods in the variations of a number
of RR Lyrae stars [14].
Fig. 6. The colour-absolute magnitude relation for beta CMa stars
all features quite common among beta CMa stars. Measures by myself on 29
McDonald spectrograms, taken in February 1955 by Father Bertiau as
part of A. Blaauw's program on the Sco-Cen cluster confirmed this
viewpoint. The results will probably be published in the July issue of the
Astrophysical Journal. To investigate the variations closer, more than 300
spectrograms have been obtained last spring at my request at the observatories
of Fort Davis, Toronto, Pretoria, MtStromlo and La Plata. I seize
this opportunity to express my sincere gratitude to DrDr. Blaauw, Heard,
Thackeray, Buscombe and Gratton of these respective institutes for their
kind and effective co-operation. The plates are now being measured and the
results available so far give evidence that the expected period of
3h 42m is close to the truth, and that beats and gamma-velocity variations
are really present
While Fig. 2 and 3 respectively show my interpretation of Henroteau's
earlier RV measures and my own measures of RV on Bertiau's plates, Fig. 4
illustrates provisional results obtained from Pretoria-plates, taken in the
night April 30-May 1 of this year. The new period places the star, which is
of spectral type B_2-IV and of M_v = -3.0, at its right place among the other
members of the group. It is worth-while to mention that theta Oph is a member
of the moving cluster in Sco-Cen so that we have an independent and accurate
means to derive its parallax and absolute magnitude and thence to test the
zero point of the period luminosity curve.
At present then we have 11 stars of which the beta CMa character is
established beyond doubt. Particulars about them are given in Table 1 which is
a reproduction, - except for the data relative to the youngest member, -
of Struve's synoptic Table on p. 150 of the Publications of the Astronomical
Society of the Pacific (67, 1955).
Table 1
STARS OF THE BETA CANIS MAJORIS GROUP
P_1 P_2 2K_1 2K_2 Spectral Line Rot
Star Delta m_1 Delta m_2 Colour M_v
h m h m (km/sec) (km/sec) Type profile Vel.
beta CMa 6 00 6 02 12 6 0.03 - B_1 II-III -0.280 -4.7 Changes L
sigma Sco 5 44 5 55 15 110 - 0.08 B_1 III - -4.3 " L
or
6 07
xi^1 CMa 5 02 - 36 - 0.01 - B_1 IV -.280 -4.2 Const. S
or
0.045
BW Vul=
- 4 49 - 150 - 0.19-0.26 B_2 III -.270 -4.1 Changes A
HD 199140
12 DD Lac 4 44 4 38 15 36 0.042 0.074 B_2 III -.265 -4.1 " A
beta Cep 4 34 - 18-46 - 0.02-0.05 - B_2 III -.275 -4.1 Const. S
nu Eri 4 16 4 10 22 49 0.067 0.114 B_2 III -.255 -4.1 Changes A
16 EN Lac 4 06 4 04 9 30 0.035 0.055 B_2 IV -.260 -3.3 " S
delta Cet 3 52 - 13 - 0.025 - B_2 IV -.245 -3.3 Const. S
theta Oph 3 42 ? 22? 14? ? ? B_2 IV ? -3.0 Chang.? S
gamma 3 38 - 7 - 0.015 - B_2 IV -.240 -3.0 Const. S
L=Large=+-60 km/sec A=Average =+-30 km/sec S=Small=15km/sec.
The line profiles vary with period P_2
5. The period-luminosity and period-spectrum relations. - In the above
table the stars have been listed in the order of decreasing periods. The
inspection of columns 8-9-10 shows at once that this order is also the one
of advancing spectral type or colour and of decreasing luminosity, in other
words, the Table reveals the existence of a period spectrum and of a
period-luminosity relation. The latter was established first by Blaauw
and Savedoff [4], the former by McNamara [5] and again by McNamara and
Williams [6]. Fig. 5 and 6 show in graphical form the present state of our
knowledge concerning these relations; they have been constructed with
the aid of the data collected from Table 1.
6. The various interpretations of the observed variations. - There can be
said from the outset that the final explanation of the intriguing variations
in these stars has not yet been found. We are still at the stage of hypotheses,
each of them accounting for a good deal of the observed phenomena but
leaving one or more points in the dark or raising fatal objections. Although
most of them appear to have no future a brief review of them cannot be out
of place in a survey like this and it may even be useful by warning against
blind-alleys in further research.
Most of the hypotheses have one point in common: they see in the
complicated changes demonstrated by the beta CMa stars the combined effect
of stellar rotation and stellar pulsation.
a) The satellite hypothesis. - An ordinary star cannot revolve around
a B star in so short an interval as 4 hours; even if the surfaces of the two
bodies were in contact with each other the revolution would take one day
to one day and a half. Nevertheless W. F. Meyer, who held beta CMa under
observation for years and who was the first to discover the double periodicity
in its radial velocity variation [7], tried to understand the star as a binary,
and as a binary of a somewhat particular nature. In his mind beta CMa consisted
of a primary, the B star, and of a real satellite of small mass but high density,
thence very small volume. The mass ratio m_1/m_2 would not be less than 100
and the diameter of the satellite would be small enough for any eclipse feature
in the light-curve to be washed out. The superdense satellite would revolve
around the primary at only a small height above the photosphere of the latter
and thereby excite that overtone (P_2) of the natural pulsation of the primary
which lies closest to the orbital period (P_1). The intensity with which this
overtone is excited will depend upon the value of 1/(P_1-P_2)^2 and this
circumstance makes it understandable why of two objects of the same class
such as beta Cep and beta CMa the first shows no overtone variation at all
while the second shows it even stronger than the P_1 variation. The difference
in constitution between these two stars is indeed strong enough to make the
difference in overtone period quite plausible.
Remained the variation in line width. This was ascribed to variable
turbulence of an irregular character, some sort of explosions which would
set up a free pulsation of variable phase and amplitude.
The scheme might look attractive as long as there were only a couple
of such stars to be accounted for, but with about a dozen of them known
at present it appears unable to answer the following questions:
1. Why are all the members of the group B stars?
2. Why is the free oscillation period always so very close to the period
of the forced oscillation?
b) The turbulent spot hypothesis. - Struve [8], who discussed most
of Meyer's observations after the latter's death, and who tried to make the
best of the satellite hypothesis, devoted special attention to the periodic
line broadening and line doubling. In his opinion the satellite would cause
a local disturbance on the surface of the primary, a kind of "turbulent spot"
which would produce deep and narrow absorption lines; the rest of the primary's
surface would remain unaffected and be quite uniform and the absorption
lines which it produced would show appreciable rotational broadening, the star
being supposed in rapid axial rotation. The broad line stage would correspond
to the interval that the spot is on the hemisphere turned away from the earth,
the sharp line stage to the passage of the spot over the visible hemisphere,
and the observed variation of the radial velocity would find its origin in the
successive motions of approach and of recession as the spot travels over this
hemisphere. But this picture too raises several objections, the most serious
of which is that, with a reasonable diameter for the spot, both the RV and the
line width should remain constant as long as the spot is hidden from view,
while the observations show on the contrary a continuous change of these
attributes [1].
Before the strength of the objections Struve finally gave up the satellite
and turbulent spot hypotheses, but he went on adhering to the opinion that
the star's axial rotation is the principal agent in the process of line
broadening or doubling [9].
c) The hypothesis of a polar-aequatorial oscillation. - In 1952,
probably under the influence of the emphasis laid upon the necessity to
take rotation into account for the interpretation of the phenomena,
several astronomers began to favour the idea that the beta CMa stars
were single rapidly rotating stars which suffered radial pulsations with
slightly different periods at the poles and at the aequator [10]. In the
minds of some of them (among which is the writer) the difference between
the periods of the polar and of the aequatorial oscillations was caused
by the flattening at the poles, produced itself by the star's rotation;
in the opinion of others (Menzel) quoted by Struve [9] a magnetic field
was held responsible for this difference.
The model had the advantage to account in an easy way for the two
interfering periods and for the differences between individual stars. The
latter may indeed be ascribed to differences in the angle between the axis
and the line oŁ sight and to differences in velocity.
A weak point is that the broadening of the lines remains unexplained.
d) The hypothesis of nonradial oscillations. - P. Ledoux [11] has
investigated the general characteristics of the nonradial oscillations in
a rotating star. He arrives at the conclusion that in the simplest case
the free oscillations are threefold: besides a stationary wave there are two
travelling waves running in opposite directions around the axis. The three
frequencies lie close together, that of the stationary wave being moreover
the arithmetic mean of the two others. When the line of sight lies in the
aequator each running wave produces a large and variable line broadening of the
same period as the wave itself. The curves illustrating these broadening are
however shifted over a quarter of a period with respect to the RV curves;
the shift is negative for the variation of shorter period and positive for the
other.
These results seemed extremely promising for the understanding of
the beta CMa stars. They explained at once the occurrence in the same star of
variations with periods always so close to each other and of oscillations
having so different a bearing on the line widths. The confrontation of the
theory with the observations of beta CMa was however a setback. Of the two
running waves only the one of greater period was present and the theory
could not explain how the other one could remain unexcited; even worse,
the phase-shift of the line broadening appeared to have the wrong sign when
compared with the prediction of the theory.
Ledoux also discussed briefly the case of forced oscillations, but
this brings us back to the satellite hypothesis. Besides the objections already
mentioned, the difficulty for the primary to accommodate the satellite and
the fact that the so-called orbital period is found back in the light-curve
further make this hypothesis unlikely.
e) The ejected atmosphere hypothesis. - Mainly in an attempt to explain
the peculiar line doubling found in BW Vulpeculae Struve proposed the
following working hypothesis which was further advocated by Odgers [12]:
At regular intervals a beta CMa star expels an atmosphere which rises
to a certain height and then falls back into the star. One of the components
of each double spectral line comes from this rising or falling shell the other
comes from the quiet atmosphere. The period with which the ejections take
place depend upon the internal constitution of the star, the "flight time"
of the shell is conditioned by the effective gravity. It happens that both
intervals are of the same order; from their ratio however will depend the
presence or the absence of beats. With the ratio: flight time/ejection
period < 1 there will be a stillstand in the radial velocity curve, with
the same ratio > 1 there will be beats, as that shell moves furthest which
does not collide with returning shells.
But once more the picture does not give complete satisfaction, the most
serious difficulty coming from the constancy of the equivalent widths. This
constancy indeed suggests that the two components of the spectral lines
come from regions of the stellar surface which are next each other instead
of being the one above the other [13].
f) The hypothesis of coupling between usual radial oscillations of different
modes. - The hypothesis of coupling between the pulsations in the fundamental
mode and in some higher mode, the period of which is nearly half that of the
principal mode, has been invoked twenty years ago by Miss Kluyver to
explain the existence of two very similar periods in the variations of a number
of RR Lyrae stars [14].
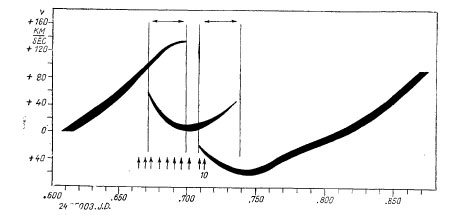 Fig. 7. - The radial velocity curve of BW Vul, showing the doubling of
the spectral lines before and after maximum contraction. (Reprinted from
P. A. S. P., 67, 135, 1955.)
We know from the fine photometric work done in this country by Balázs and
Detre [15] on the one hand, and from spectrographic research carried out at
McDonald [16], on the other, that this double periodicity affects the
light-curve as well as the RV curve, so that these RR Lyrae stars resemble
the beta CMa stars, at least in this respect, and that one may think that
the same mechanism is at work in both types of stars. Despite the similarity,
the coupling hypothesis has found hitherto no supporters to extend it to the
beta CMa stars. The reason for this reserve probably lies in the consideration
that the two oscillations should have approximately the same influence on the
line profiles whereas the observations show that only one of the oscillations
is active in the process of line broadening.
It looks however to me that this argument contra is easily turned into
an argument pro.
Let us indeed assume the line profiles to be shaped essentially by the
amount of macroturbulence in the star's atmosphere. Changes in this parameter
will affect the line width, but not the equivalent width, a circumstance
requested by the observations. But changes in turbulence come from changes
in the temperature gradient. Now for the homogeneous model the oscillation
in the fundamental mode has an amplitude which grows linearly with the
distance from the center of the star and the application of Homer Lane's
law shows at once that any contraction will cause an increase of the
temperature-gradient and hence of the turbulence. (It should be noticed
here that maximum line width is observed to occur at the phase of maximum
contraction in the P_2K_2-variation, if the pulsation theory is adopted.)
With the standard or other models the linearity is lost but our conclusion
about the increase of temperature gradient and turbulence with contraction
will in general not have to be changed drastically.
On the other hand an oscillation with period slightly different from the
fundamental one, has an amplitude that increases very rapidly towards the
surface of the star [17]. When the star contracts in the course of such an
oscillation an outer layer will suffer a stronger compression than the layer
below and consequently it will heat up relatively more. Whether the contraction
will here cause an increase or a decrease of the temperature gradient and of
the turbulence and hence of the line width or leave them about constant,
will depend upon the rate of decrease of the amplitude with depth.
So, the different bearing of the two oscillations upon the line width
is accounted for by identifying the P_2K_2-variation with the oscillation in
the fundamental mode of frequency sigma, the P_1K_1-variation with the pulsation
excited by resonance (of frequency nu-sigma ~ sigma, if nu ~ 2 sigma denotes
the frequency of the oscillation in the overtone).
This conclusion receives an independent support from the ratio
Delta m_1/K_1 : Delta m_2/K_2. For the same observed amplitude in RV
variation the oscillation excited by resonance indeed affects the state
of compression or of expansion of the outer visible layers of the star much
more than the fundamental mode does, hence the former is more effective than
the latter in changing the effective temperature of these layers and hence
the observed brightness. As can be seen from the data in Table 1, the three
best observed stars 12 Lac, nu Eri and 16 Lac all show
Delta m_1/K_1 > Delta m_2/K_2.
The doubling of the spectral lines observed in a few beta CMa stars at
phases of intermediate contraction only denotes large differences between
the velocities of ascent and of descent of the moving macroelements in the
stellar atmosphere. Their again becoming single around the epoch of maximum
contraction may be interpreted as being due to a reversal in the run of the
temperature gradient with increasing compression. (Our remark concerning
the dependence upon this gradient of the rate of decrease of the amplitude
with depth applies also to the fundamental mode*).
* It is perhaps not out of place to mention that in eta Aql turbulence was
found to follow approximately the variations of the radius [18], in other words
a contraction caused a decrease of turbulence.
That the broadening of the spectral lines is actually due to increased
turbulence may perhaps best be inferred from the small differences that
exist between the RV's derived from lines with different excitation potentials.
These differences have been refered to by Struve [19] as the Van Hoof
effect since I first discovered it in beta CMa [20] and in 16 Lac [21].
How they exactly run and what they probably mean can best be made clear by the
consideration of Figure 8, which represents the run with temperature and
spectral type of the intensities of an NII-, an OII- and a CIII-line. Let us
consider a star in the spectral range B1-B1.5 the atmosphere of which we
suppose to be stirred by macroturbulence.
The Figure shows immediately that the hotter ascending and the cooler
descending elements contribute about equally (except for differences caused
by their unequal brightness and/or area) to the formation of the OII-line,
that the ascending elements contribute more to the formation of the CIII-line
and that the reverse is true for the NII line. Hence it follows that the
position in the spectrum of the centre of gravity of the OII-line will not
be affected by turbulence; the CIII-line on the contrary will suffer a slight
Doppler-shift to the violet and the NII-line one to the red.
Fig. 7. - The radial velocity curve of BW Vul, showing the doubling of
the spectral lines before and after maximum contraction. (Reprinted from
P. A. S. P., 67, 135, 1955.)
We know from the fine photometric work done in this country by Balázs and
Detre [15] on the one hand, and from spectrographic research carried out at
McDonald [16], on the other, that this double periodicity affects the
light-curve as well as the RV curve, so that these RR Lyrae stars resemble
the beta CMa stars, at least in this respect, and that one may think that
the same mechanism is at work in both types of stars. Despite the similarity,
the coupling hypothesis has found hitherto no supporters to extend it to the
beta CMa stars. The reason for this reserve probably lies in the consideration
that the two oscillations should have approximately the same influence on the
line profiles whereas the observations show that only one of the oscillations
is active in the process of line broadening.
It looks however to me that this argument contra is easily turned into
an argument pro.
Let us indeed assume the line profiles to be shaped essentially by the
amount of macroturbulence in the star's atmosphere. Changes in this parameter
will affect the line width, but not the equivalent width, a circumstance
requested by the observations. But changes in turbulence come from changes
in the temperature gradient. Now for the homogeneous model the oscillation
in the fundamental mode has an amplitude which grows linearly with the
distance from the center of the star and the application of Homer Lane's
law shows at once that any contraction will cause an increase of the
temperature-gradient and hence of the turbulence. (It should be noticed
here that maximum line width is observed to occur at the phase of maximum
contraction in the P_2K_2-variation, if the pulsation theory is adopted.)
With the standard or other models the linearity is lost but our conclusion
about the increase of temperature gradient and turbulence with contraction
will in general not have to be changed drastically.
On the other hand an oscillation with period slightly different from the
fundamental one, has an amplitude that increases very rapidly towards the
surface of the star [17]. When the star contracts in the course of such an
oscillation an outer layer will suffer a stronger compression than the layer
below and consequently it will heat up relatively more. Whether the contraction
will here cause an increase or a decrease of the temperature gradient and of
the turbulence and hence of the line width or leave them about constant,
will depend upon the rate of decrease of the amplitude with depth.
So, the different bearing of the two oscillations upon the line width
is accounted for by identifying the P_2K_2-variation with the oscillation in
the fundamental mode of frequency sigma, the P_1K_1-variation with the pulsation
excited by resonance (of frequency nu-sigma ~ sigma, if nu ~ 2 sigma denotes
the frequency of the oscillation in the overtone).
This conclusion receives an independent support from the ratio
Delta m_1/K_1 : Delta m_2/K_2. For the same observed amplitude in RV
variation the oscillation excited by resonance indeed affects the state
of compression or of expansion of the outer visible layers of the star much
more than the fundamental mode does, hence the former is more effective than
the latter in changing the effective temperature of these layers and hence
the observed brightness. As can be seen from the data in Table 1, the three
best observed stars 12 Lac, nu Eri and 16 Lac all show
Delta m_1/K_1 > Delta m_2/K_2.
The doubling of the spectral lines observed in a few beta CMa stars at
phases of intermediate contraction only denotes large differences between
the velocities of ascent and of descent of the moving macroelements in the
stellar atmosphere. Their again becoming single around the epoch of maximum
contraction may be interpreted as being due to a reversal in the run of the
temperature gradient with increasing compression. (Our remark concerning
the dependence upon this gradient of the rate of decrease of the amplitude
with depth applies also to the fundamental mode*).
* It is perhaps not out of place to mention that in eta Aql turbulence was
found to follow approximately the variations of the radius [18], in other words
a contraction caused a decrease of turbulence.
That the broadening of the spectral lines is actually due to increased
turbulence may perhaps best be inferred from the small differences that
exist between the RV's derived from lines with different excitation potentials.
These differences have been refered to by Struve [19] as the Van Hoof
effect since I first discovered it in beta CMa [20] and in 16 Lac [21].
How they exactly run and what they probably mean can best be made clear by the
consideration of Figure 8, which represents the run with temperature and
spectral type of the intensities of an NII-, an OII- and a CIII-line. Let us
consider a star in the spectral range B1-B1.5 the atmosphere of which we
suppose to be stirred by macroturbulence.
The Figure shows immediately that the hotter ascending and the cooler
descending elements contribute about equally (except for differences caused
by their unequal brightness and/or area) to the formation of the OII-line,
that the ascending elements contribute more to the formation of the CIII-line
and that the reverse is true for the NII line. Hence it follows that the
position in the spectrum of the centre of gravity of the OII-line will not
be affected by turbulence; the CIII-line on the contrary will suffer a slight
Doppler-shift to the violet and the NII-line one to the red.
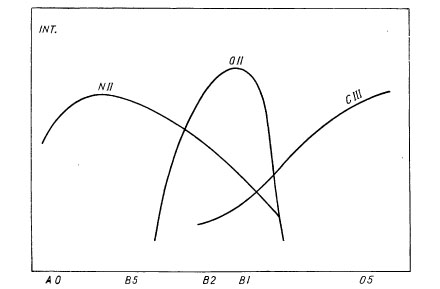 Fig. 8. - Schematic representation of the variations with spectral type in
the intensities of an NII-, an OII- and a CIII-line.
The magnitude of each shift follows the fluctuations of the intensity
of turbulence, both increase or decrease at the same time. Of the other lines,
those that attain their maximum intensity at a spectral type earlier than
B1-B2 behave like CIII (SiIV); those attaining maximum intensity at a
later type (H, He, CII, MgII) behave like NII. Measures which I made on the
sequence of neighbouring and well defined lines NII-4630, OII-4639,
OII-4642, CIII-4647, OII-4649 and '62 showed the shifts to obey only
the P_2-variation.*
* This conclusion is in accordance with McNamara's failure to detect the
Van Hoof effect in ksi^1 CMa, which star has no P_2 variation [22]
For all these reasons, which we summarize underneath, the coupling
hypothesis appears to us to be the most attractive:
1) it explains why the two periods are always so close to each other;
2) it explains why only one of them is active in the process of
line-broadening;
3) it explains the various phase relations between the variations of
different attributes;
4) it explains the difference in the ratios (Delta m/K)_1 and (Delta m/K)_2;
5) it explains the Van Hoof effect;
6) it makes understandable that the observed phenomena are restricted
to stars of about the same spectral type and luminosity.
There remains one puzzle. In the spectrum of beta CMa itself I discovered
two lines, respectively, at 4818A and 4846A, the second about twice as broad as
other lines of the same depth. These lines remain visible without interruption
around the time that the P_1 and P_2 variations are in phase, they are
invisible around the time that these variations are in opposition. To which
elements are they due? How can the above mechanism explain their intermittent
appearance? These are questions the answer to which I must leave to the future.
August 14, 1956.
1. O. Struve, PASP, 64, 20, 1952.
2. D. H. McNamara, Ap. J., 122, 95, 1955.
3. M. Walker, A. J., 57, 227, 1952.
4. A. Blaauw and M. P. Savedoff, B. A. N., 12, 69, 1953.
5. D. H. McNamara, PASP, 65, 155, 1953.
6. D. H. McNamara and A. D. Williams, PASP, 67, 21, 1954.
7. W. F. Meyer, PASP, 46, 202, 1934.
8. O. Struve, Ap. J., 112, 520, 1950.
9. O. Struve, Ann. d'Astroph., 15, 157, 1952.
10. O. Struve, A. J., 57, 167, 1952.
11. P. Ledoux, Ap. J., 114, 373, 1951.
12. O. Odgers quoted by Struve in PASP, 67, 135, 1955.
13. Su-Shu Huang, PASP, 67, 22, 1955.
14. H. Kluyver, B. A. N., 7, 313, 1936.
15. J. Balázs and L. Detre, several numbers of the Mitteilungen of the Budapest
Observatory.
16. O. Struve and A. Blaauw, Ap. J., 108, 60, 1948 and
O. Struve and A. Van Hoof, Ap. J., 109, 215, 1949.
17. P. Ledoux, Astrophysica Norvegica, 3, 1940. - See also reference in S.
Rosseland: "The Pulsation Theory of variable Stars" pp. 38-39.
18. A. Van Hoof and R. Deurinck, Ap. J., 112, 166, 1952.
19. O. Struve, PASP, 67, 173, 1955.
20. A. Van Hoof and O. Struve, PASP, 65, 158, 1953.
21. A. Van Hoof, M. DeRidder and O. Struve, Ap. J., 120, 179, 1954.
22. D. H. McNamara, PASP, 68, 263, 1956.
Fig. 8. - Schematic representation of the variations with spectral type in
the intensities of an NII-, an OII- and a CIII-line.
The magnitude of each shift follows the fluctuations of the intensity
of turbulence, both increase or decrease at the same time. Of the other lines,
those that attain their maximum intensity at a spectral type earlier than
B1-B2 behave like CIII (SiIV); those attaining maximum intensity at a
later type (H, He, CII, MgII) behave like NII. Measures which I made on the
sequence of neighbouring and well defined lines NII-4630, OII-4639,
OII-4642, CIII-4647, OII-4649 and '62 showed the shifts to obey only
the P_2-variation.*
* This conclusion is in accordance with McNamara's failure to detect the
Van Hoof effect in ksi^1 CMa, which star has no P_2 variation [22]
For all these reasons, which we summarize underneath, the coupling
hypothesis appears to us to be the most attractive:
1) it explains why the two periods are always so close to each other;
2) it explains why only one of them is active in the process of
line-broadening;
3) it explains the various phase relations between the variations of
different attributes;
4) it explains the difference in the ratios (Delta m/K)_1 and (Delta m/K)_2;
5) it explains the Van Hoof effect;
6) it makes understandable that the observed phenomena are restricted
to stars of about the same spectral type and luminosity.
There remains one puzzle. In the spectrum of beta CMa itself I discovered
two lines, respectively, at 4818A and 4846A, the second about twice as broad as
other lines of the same depth. These lines remain visible without interruption
around the time that the P_1 and P_2 variations are in phase, they are
invisible around the time that these variations are in opposition. To which
elements are they due? How can the above mechanism explain their intermittent
appearance? These are questions the answer to which I must leave to the future.
August 14, 1956.
1. O. Struve, PASP, 64, 20, 1952.
2. D. H. McNamara, Ap. J., 122, 95, 1955.
3. M. Walker, A. J., 57, 227, 1952.
4. A. Blaauw and M. P. Savedoff, B. A. N., 12, 69, 1953.
5. D. H. McNamara, PASP, 65, 155, 1953.
6. D. H. McNamara and A. D. Williams, PASP, 67, 21, 1954.
7. W. F. Meyer, PASP, 46, 202, 1934.
8. O. Struve, Ap. J., 112, 520, 1950.
9. O. Struve, Ann. d'Astroph., 15, 157, 1952.
10. O. Struve, A. J., 57, 167, 1952.
11. P. Ledoux, Ap. J., 114, 373, 1951.
12. O. Odgers quoted by Struve in PASP, 67, 135, 1955.
13. Su-Shu Huang, PASP, 67, 22, 1955.
14. H. Kluyver, B. A. N., 7, 313, 1936.
15. J. Balázs and L. Detre, several numbers of the Mitteilungen of the Budapest
Observatory.
16. O. Struve and A. Blaauw, Ap. J., 108, 60, 1948 and
O. Struve and A. Van Hoof, Ap. J., 109, 215, 1949.
17. P. Ledoux, Astrophysica Norvegica, 3, 1940. - See also reference in S.
Rosseland: "The Pulsation Theory of variable Stars" pp. 38-39.
18. A. Van Hoof and R. Deurinck, Ap. J., 112, 166, 1952.
19. O. Struve, PASP, 67, 173, 1955.
20. A. Van Hoof and O. Struve, PASP, 65, 158, 1953.
21. A. Van Hoof, M. DeRidder and O. Struve, Ap. J., 120, 179, 1954.
22. D. H. McNamara, PASP, 68, 263, 1956.