 , where lambda is the laboratory wavelength
of some spectrum line in the light of the galaxy, and Delta(lambda) is its displacement
owing to the red shift.
Table 2
Richness groups
Richness Group I II III IV V
Counts 50-79 80-129 130-199 200-299 300 or over
Instead of the brightness of some representative members, the mean red shift,
delta, of a cluster may also be used as a basis of grouping the clusters into distance
classifications. The magnitudes listed in Table 1 are roughly equivalent to the following
red shift values:
Table 3
Relation between Abell magnitudes and red shift
Magnitude (m) 14.0 14.8 15.6 16.4 17.2 18.0
Red Shift (delta) .030 .048 .076 .108 .148 .200
In his paper Abell has not examined the distribution of the clusters of galaxies
according to richness for every distance group separately. The results of such analysis are
summarised in Table 4a.
Table 4a
The distribution of the clusters of galaxies according to distance and richness
(Entries of Abell's statistical investigations)
Distance 1 2 3 4 5 6
Group
Richness
Group
I 5 2 26 48 518 624
55.6%, 100% 78.8% 81.4% 78.9% 67.6%
II 4 7 9 121 243
44.4% - 21.2% 15.2% 18.4% 26.3%
III 2 18 49
- - - 3.4% 2.7% 5.3%
IV 6
- - - - - 0.7%
V 1
- - - - - 0.1%
The Table indicates not only the number but also the percentage distribution of
the clusters of galaxies among the various richness groups for each distance group
separately.
Table 4a reveals a strong correlation between the distance and the richness of clusters of
galaxies listed in Abell's Catalogue: in distance group 6 the abundance ratio of rich
clusters of galaxies considerably increases. It is evident that in case of a constant
abundance ratio, in each richness group the ratio of clusters belonging to distance groups
5 and 6 ought to be constant. The discrepancy in the value of these ratios related to the
various richness groups can be used as a measure of the variation of the abundance ratio of
the clusters. In Table 4b the strong variation of the abundance ratios found between
distance groups 5 and 6 is characterized by these ratios.
Table 4b
Same as the two last columns of Table 4a, but the ratios of numbers of clusters in
neighbouring distance groups are also indicated
Distance 5 6
Group
Richness
Group
I 518 1.2 624
II 121 2.0 243
III 18 2.7 49
IV - 6
K. Just was the first to call attention to this fact [2]. In his opinion the
correlation between richness and distance is a proof for the evolution of the whole
Universe, as, owing to the finite velocity of light, every information arriving from
greater distances relates to former times. In the following part of the present paper this
phenomenon is subjected to a critical analysis and the conclusions that may be drawn from
it are pointed out.
The anomaly in the abundance ratio of clusters of different richness has been
investigated and compared with a similar phenomenon that may be observed by studying the
first volume of F. Zwicky's "Catalogue of Galaxies and of Clusters of Galaxies" [4].
(Further volumes have not been published so far.) The results of the investigation and
their likely interpretation are discussed in the following Sections, each of them
containing one statement and its relevant argumentation.
The results of investigation
1) definite correlation, of identical character with that resulting from Table 4a,
is found between the richness and the distance of clusters of galaxies in various areas of
the celestial sphere. This correlation, though not of equal strength, is striking in all
sufficiently large regions of the sky so far investigated.
This statement has been proved by the comparison of tables constructed in a similar
manner as Table 4a, for various regions of the sky. For brevity's
sake only a single Table, significant for further conclusions, is given here. Let the
selected field of the sky be identical with that covered by the first volume of Zwicky's
Catalogue: -5° < D < 15°; 7^h < RA < 18^h (Table 5).
Naturally, in the relatively poorer statistical sample of Table 5 there is a
greater scatter. To reduce this, the number of rich clusters and that of clusters of
smaller distances are represented together. A correlation between richness and distance
different in amount, but of identical sense, can be clearly observed in the right-hand
side upper part of the Table, which is statistically the most reliable one.
Table 5
The distribution of Abell's clusters according to their distance and richness in the
area -5° < D < 15°; 7^h < RA < 18^h
Distance 1,2,3,4 5 6
Group together
Richness
Group
I 10 68 57
76.9% 88.3% 67.8%
II, III 3 9 27
together 23.1% 11.7% 32.2%
IV, V
together - - -
2) The observed number of clusters of richness group I divided by the number of
clusters of richness group II in the first four distance groups goes increasing in a
statistically less significant manner, whereas in the sixth distance group it decreases
considerably.
Before checking the above statement numerically, let us introduce the function
N(m) commonly used in stellar statistics. Let the function N(m) regarding the clusters of
galaxies represent the number of clusters found in the field under examination, in which
the magnitude of the tenth brightest member is lower than the fixed magnitude, m.
Considering that differences in the brightness of the tenth brightest member of clusters
arise probably only from differences in their distances [1a], the function N(m) practically
gives the number of clusters which are located nearer than a given limiting distance. It is
also evident that in the knowledge of the function m(delta) (Table 3), the limit of count may
also be expressed by distance parameter delta, and in this way the function N(delta) can be defined.
Function N_A(m) related to the entire Abell Catalogue, and N_I(m), N_II(m) ... showing the
numbers of clusters belonging to the different richness groups, will also be introduced.
To check the statement of Section 2 it is sufficient to compare the ratios N_I/N_II
resulting from Table 4a (See Table 6).
The variation of the quotient N_I/N_II, can be best described by a function
that increases as far as the fourth group, is fairly constant between groups 4 and 5, then
abruptly decreases after distance group 5. As the first two or
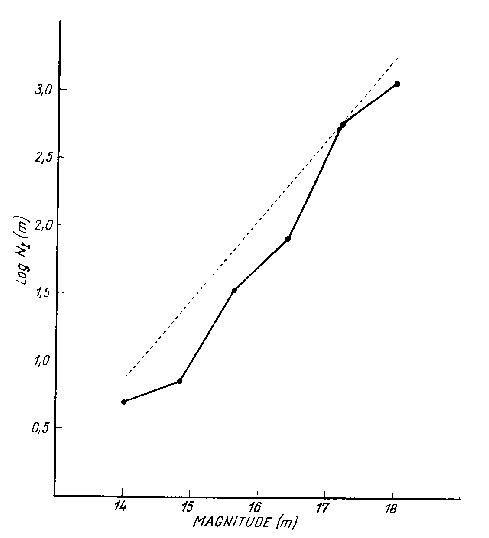 Fig. 1a. Function Log N_I(m)
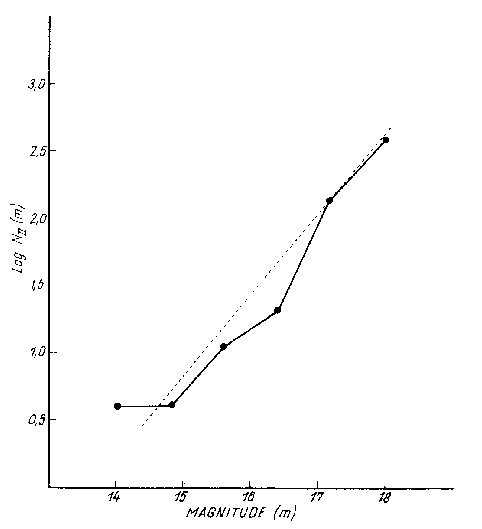 Fig. 1b. Function Log N_II(m)
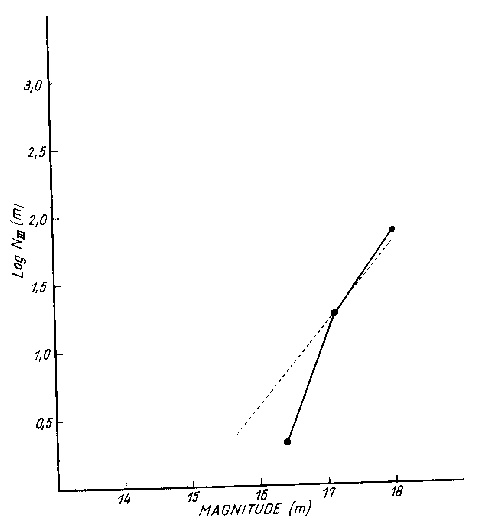 Fig. 1c. Function Log N_III(m)
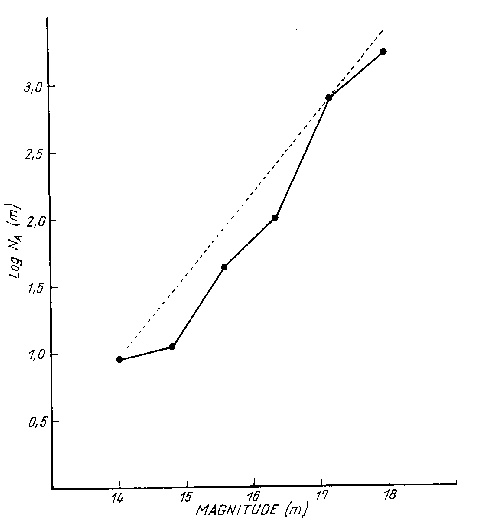 Fig. 1d. Function Log N_A(m)
three quotients are taken from poorer statistical samples, the possibility that the
increase found in the first four groups is partially due to some random effect cannot be
excluded.
Table 6
Limiting 14.0^m 14.8^m 15.6^m 16.4^m 17.2^m 18.0^m
Magnitude
Ratio
N_I/N_II 5/4=1.25 7/4=1.75 33/11=3.00 81/20=4.05 599/141=4.24 1223/384=3.18
The function Log N(m) referring to each richness group and the whole material separately
are represented in Figures 1a, b, e and d.
These Figures clearly show the dependence on richness of the N-function. The
dashed lines, expressed by the equation N = 0.6 m + const. in case of not too great
distances correspond to the homogeneous space distribution of the clusters of galaxies [5].
The additive constants have always been selected so that the dashed line should fit the
point corresponding to distance group 5. The curve Log N_A(m) in distance groups 2, 3, 4
is nearly parallel to the dashed line of the slope 0.6. This suggests that the space
distribution of the clusters in the volume of space under consideration and the statistical
sample of the catalogue are fairly homogeneous.
3) The correlation between the richness and the distance of the clusters results
from a stronger correlation between the morphological type and the distance of the
clusters.
Taking Zwicky's morphological criteria [4, 6, 7] as a basis let us classify the
clusters belonging to the various richness groups as compact, medium compact, and open
clusters. It will be obvious that the correlation found on the right-hand side of Table 5
between the richness and the distance of the clusters is primarily due to a marked
decrease in the abundance ratio of clusters of lower degree of compactness. To illustrate
this statement, Table 7 gives the
Table 7
Abundance ratios of compact and medium compact clusters in richness group I
Distance Group 5 6
Type
Medium compact 44 20
Richness group I 68.7% 42.6%
Compact 20 27
Richness group I 31.3% 57.4%
distribution of compact and medium compact clusters belonging to richness group I, between
distance groups 5 and 6. 1 n lack of other data, the comparison is restricted to the region
of the sky included in the first volume of Zwicky's Catalogue.
4) The correlation between distance and richness of clusters of galaxies observed
in Abell's Catalogue does not originate in some phenomenon of nature, it results from the
peculiarities of Abell's measurements used as a basis to the compilation of the, Catalogue.
This statement rests upon a comparative analysis of Abell's and Zwicky's Catalogues
of clusters of galaxies.
The Zwicky Catalogue considers in its classification the morphological
characteristics (degree of compactness) and the distance of the clusters of galaxies. It
should be noted here that Zwicky's definition for distance groups differs from that of
Abell discussed above. An arrangement in groups similar to that of Table 4a, worked out
for this catalogue is given in Table 8.
Table 8
The distribution of clusters of galaxies listed in Zwicky's Catalogue, according to their
compactness and distance
Distance Near Medium Distant Very
Group Distant Distant
Degree of
Compactness
Compact 1 14 33 130
1.1% 6.8% 10.7% 30.6%
Med. Comp. 39 19 146 202
42.9% 48.1% 46.9% 47.5%
Open 51 93 132 93
56.0% 45.1% 42.4% 21.9%
In accordance with the composition of other tables, Table 8 indicates not only the
number but, also the percentage distribution of the clusters of galaxies among the various
morphological groups for each distance group separately.
From Table 8 it follows that the abundance ratio of clusters of lower degrees of
compactness in Zwicky's Catalogue decreases with the distance. Confronted with those
discussed in Section 3 this seems to be similar to the anomaly of abundance ratios found
in Abell's data. The analogon of the statement of Section 1 applies also to the data
contained in Zwicky's Catalogue, that is to say, a strong correlation between the type and
the distance of the clusters appears also here, and is generally independent from the
direction. There is, however, a definite divergence between the two Catalogues as regards
the statement of Section 2. From the first distance group on the abundance ratio of
compact to medium compact clusters in Table 8 increases with distance uniformly, strongly
and strictly monotonously, contrary to the change definitely not monotonous and quite
sudden found in Abell's Catalogue. This can be better followed on Log N diagrams plotted
for Zwicky's types of clusters, represented in Figures 2 a, b and c.
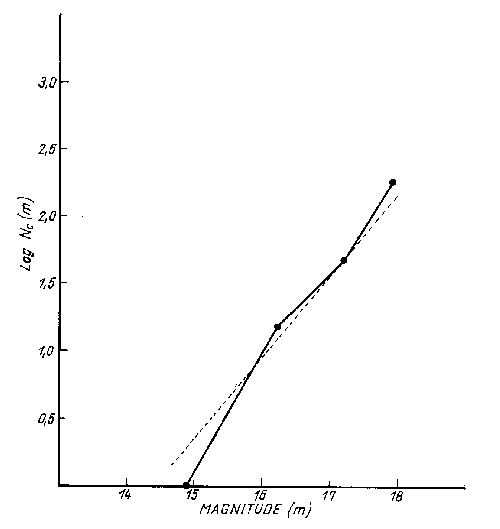 Fig. 2a. Function Log N_c(m) plotted for Zwicky's
compact clusters
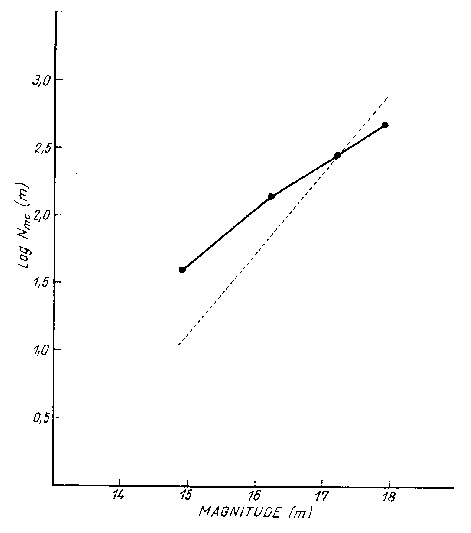 Fig. 2b. Function Log N_{mc}(m) plotted for Zwicky's
medium compact clusters
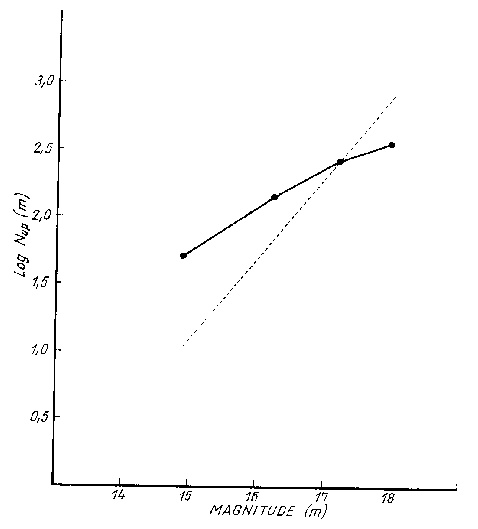 Fig. 2c. Function Log N_{op}(m) plotted for Zwicky's open
clusters
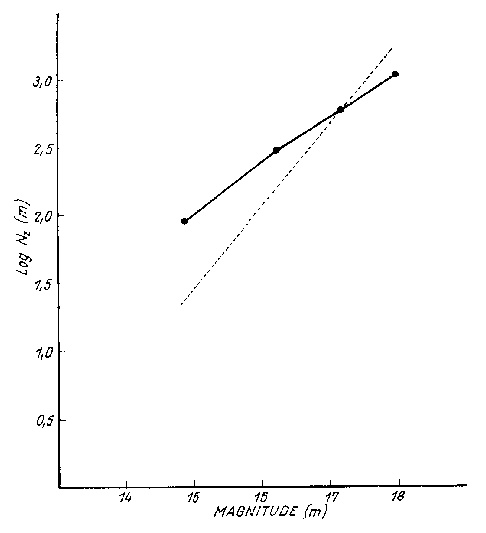 Fig. 2d. Function Log N_Z(m) plotted for all clusters
of galaxies included in Zwicky's Catalogue
Zwicky has defined the distance groups by red shift values. They are expressed
here by Abell's photored magnitudes.
From Figures 2 a, band c it is clear that the apparent variation in the abundance
ratio of clusters of various types does not come from compact clusters becoming more
frequent with the distance, but it originates in apparent decrease of the space frequencies
of medium compact and open clusters. Considering that medium compact and open clusters are
more frequent in space, the N_Z(m) diagram plotted for the entire material of Zwicky's
Catalogue will obviously strongly deviate from that which could be expected in case of a
homogeneous space distribution beginning with the very first distance group (Fig. 2d).
It follows from this that if Zwicky's Catalogue is approximately complete, the
distribution in space of the clusters of galaxies is inhomogeneous; beginning from the
nearest distances, the actual density of the space distribution of the clusters
significantly decreases. It is evident, however, that a real natural phenomenon of this
kind should manifest itself also from the very first point of the N_A(m) diagram, which
is not the case in Figure 1d. Consequently, in Zwicky's Catalogue there must be some kind
of selection in the measurements. Starting from other considerations, Abell has examined
this selection in detail. According to his results, the "contour" within which Zwicky
counts the members of the clusters, systematically varies with the distance, and this
variator largely depends on the type of the cluster of galaxies under consideration [ 8a].
The effect of the selection is that at greater distances generally less galaxies are
counted in the clusters, and owing to this, the number of objects considered as clusters
goes decreasing. In case of compact clusters the decrease is not too considerable, but in
case of more diffuse clusters it becomes very significant. This is the source of the
variation of the abundance ratio in Zwicky's Catalogue. Particularly in the case of
clusters of lower degree of compactness with the increase of distance an increasing
selection, that is to say, a Log N(m) curve of decreasing slope could be expected. This is
shown in Figures 2b and 2c. Most probably, the apparently monotonous variation of the
abundance ratio in Zwicky's Catalogue must be ascribed to a single effect, which means
that the results of the Catalogue are incompatible with the assumption that in nature the
real density of the space distribution of medium compact clusters at great distances
undergoes an abrupt change. Contrary to the facts observed, such a change, superposed to
the independent selection-effect, should be easy to observe. Abell's Catalogue shows an
abrupt change of about three times in the abundance ratio of compact to medium compact
clusters between distance groups 5 and 6 in the field of the sky examined by Zwicky (cf.
Table 7). Considering what has been said above such a variation cannot exist in reality,
it must come from some systematic error in Abell's measuring procedure. A numerical
comparison shows that the anomaly in Abell's Catalogue, if it were a real one, could offer
a satisfactory explanation in itself for the surprisingly mild slope of the final section
of the Log N_Z(m) curve. But this supposition excludes the existence of the Zwicky
selection which, however, does exist as it manifests itself more and more distinctly with
the increasing distance (cf. the slopes of curves la, b, d and Table 7). It should be
noted that Zwicky's Delta m and contour criteria both differ from that of Abell's owing to
which Zwicky's Catalogue includes also clusters of lower population. It is per se unlikely
that the anomaly in the abundance ratio of smaller clusters is compensated by clusters of
even smaller population. Yet, for a check, clusters of adequate richness have been selected
from Zwicky's Catalogue and their distribution according to types compared to the distribution
of those included in Abell's Catalogue. Also this investigation has led to the above conclusion.
In conclusion it may be stated that the data published in both catalogues of
clusters of galaxies are affected by significant systematical errors. For Zwicky's
Catalogue the source of the error has been detected. In the following an attempt is made
to trace the origin of the selection manifesting itself in Abell's Catalogue.
5) An analysis of Abell's measuring procedure leads to the conclusion that the
correlation between the richness and the distance of the clusters results from the
inadequacy of Abell's convention for the angular diameters of the counting circle, which
reads theta = K/delta.
Let us consider the possible sources of errors one by one. Errors may come from 1)
an inadequate identification and from 2) an erroneous classification of clusters into
richness and distance groups. Both sources of errors may be either systematical or random.
As the origin of a systematical, tendency-like effect is looked for, random errors are of
no importance for the present investigation. Abell himself has investigated possible
errors in his identification procedure [1b]. According to his results, these cannot amount
to more than 1 - 2 per cent. Systematic errors in classification, on the other hand,
should be investigated separately to see whether they can produce relative effects
depending on the type of the clusters under examination.
Undoubtedly, the factors influencing the measurements as instrumental errors,
intrinsic and external inhomogeneities of the photoplates, atmospheric extinction and
interstellar or intergalactic absorption cannot result in favouring a certain type- of
clusters to the detriment of the others. It is more difficult to assess the effects of
using in the definition of clusters unequal magnitude intervals or inadequate angular
diameters of the circles within which cluster galaxies are counted.
Let us first survey the systematical errors in the scale of magnitude.
There is a considerable chance that in morphologically different clusters member
galaxies of different types are photographed. First of all, it should be elucidated whether
the error in the observed magnitude can depend. on the type of the galaxies in question.
Against the supposition, that the errors in magnitude would depend on the type of
galaxies under examination advocates the fact that there is a one-to-one relation between
the brightness and the mean red shift of clusters of galaxies, without regard to the type
or richness of the cluster. This is shown by Abell's m(delta) relationship [1c],
represented in Figure 3 with the indication of the degree of richness of the clusters of
galaxies used for calibration.
The natural scatter showing in Figure 3 can hide a difference of about one tenth
of a magnitude between the m(delta) relations of clusters of different types, but a
relative effect in counts can come only from a differential error in the magnitude scale,
which, evidently, must be smaller by one more order of magnitude. (It should be remembered
here that Abell's distance groups
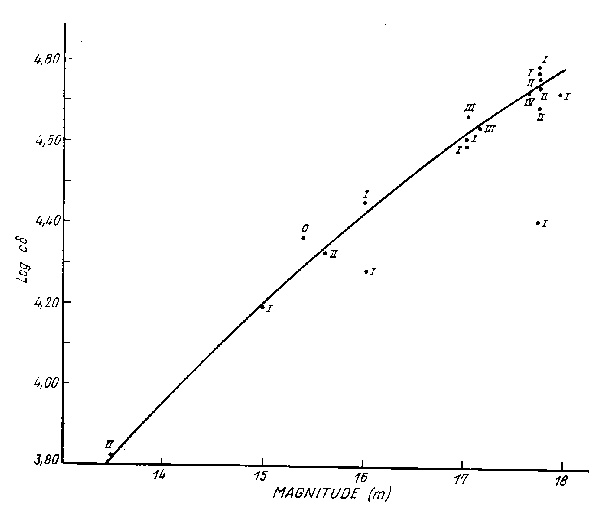 Fig. 3. Relation between Abell's photored magnitude and red shift. Figures next the points
indicate the richness group of the clusters of galaxies. The ordinate bears the
logarithm of the product of the red shift and the velocity of light (After Abell [1])
are defined with an accuracy of 0.1^m, and the probable error in individual magnitude
determinations is about 0.2^m.) For completeness' sake it should be mentioned that
magnitudes measured at great distances can change independently from possible errors of
measurements also because of the red shift appearing in their spectra. This effect is
compensated by the K-correction. Theory holds that the value of the K-correction is
slightly dependent on the type of galaxies and hence the differential magnitude correction
is of the order of 0.01^m magnitude in the spectrum range in which Abell made his
measurements [9a, 10a, 11a].
We have to assume therefore that the Abell scale of magnitude can be subjected
only to distortions independent from the type of the galaxies examined. Such an error of
magnitude may influence the limits of the distance groups, but not in a manner dependent
on the richness or on the type of the clusters of galaxies. Through the error in the
convention Delta m = 2 (cf. p. 4) the error in magnitude affects the count of the members
of the clusters, yet, as shown in Figure 4, a small variation of the measured interval of
magnitude (of maximum ±0.1^m) brings about an identical and small relative change (of
maximum 6-7 per cent.) in the counts of galaxies in the various clusters
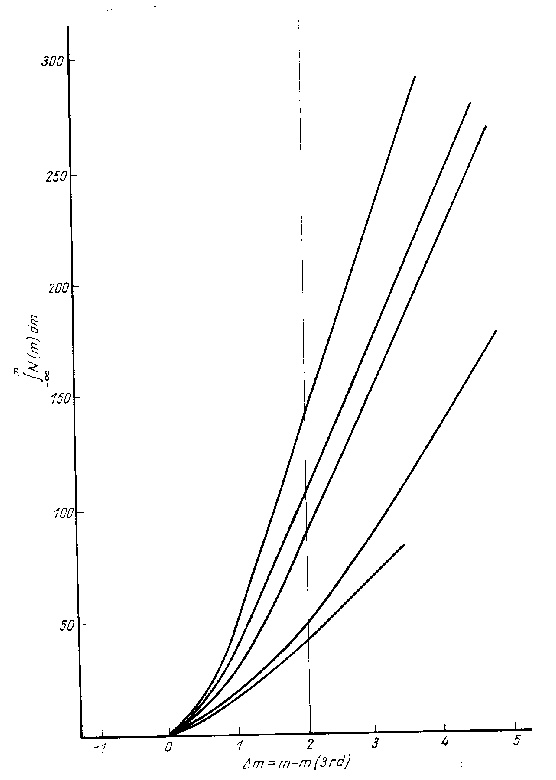 Fig. 4. The dependence of the counts of galaxies in clusters of different richness on
the value Delta m adopted in the couNting. The five curves relate to five clusters of
different richness. (After Abell [1], Fig. 2.)
thus producing only slight and fairly
equivalent changes in the abundance ratio of the various types of clusters. Therefore,
an error in the magnitude cannot have any significant relative influence.
This conclusion is supported by a further consideration. According to Abell's
discussion the presence of an error of magnitude of technical origin in the data of the
catalogue is most probable [1d], it is, however of some importance only for galaxies not
very far away, and manifests itself in the reduction of Delta m, whereas for galaxies in
distance groups 5 and 6 only a slight effect contrary to the above may be expected (cf.
the m(delta) curves of papers [1] and [9]). On the other hand, the anomaly in the abundance
ratio becomes significant just between distance groups 5 and 6 and is not contrary in
sense to the less significant change, found at the smallest distances.
It appears that the systematic variation in the abundance ratio of various types
of clusters of galaxies discussed in Sections 1, 2, 3 and represented in Table 4a cannot
originate in any error of measurement, except the convention regarding to the angular
diameters of the counting circles. Considering what has been said in Section 4, it may be
stated that Abell's convention must be in error.
Let us examine the effects that may be expected if for clusters at different
distances the angular diameters of corresponding sizes are correctly described by function
theta (delta), greatly differing from theta = K/delta.
Abell wanted to limit the counts with angular diameters rather narrow, covering
only the more dense central parts of the clusters. He has found a suggestive expression
for the condition that in this inner space the number of galaxies, n should be fifty or
more, calling it "compactness criterion". The clusters belonging to different Abell
richness groups are classified on the basis of the same number n, that is to say,
practically on the ground of the degree of their central density or their compactness.
Though Zwicky defines the degree of compactness of clusters by characteristics to be
observed in the innermost, still narrower central parts of the galaxies [4, 6, 7], it is
natural that a statistical investigation finds a very close positive correlation between
the two kinds of concept of "compactness". According to our examination Abell's richness
group III, that includes highly compact clusters, consists of clusters considered compact
also in Zwicky's sense without exception; Abell's group II consists of such only for the
greater part; and group I predominantly includes clusters of other types, classified by
Zwicky as medium compact or as open.
Let us consider first the case when with the growing distance the counting circle
defined by Abell covers more and more restricted parts of the clusters. In this case
Abell's counting procedure imposes a "compactness criterion" becoming more and more
limited with the growing distance of the clusters observed. Less compact or more diffuse
clusters meeting the criterion to an ever smaller extent will get gradually omitted from
the catalogue. Table 6 reveals the presence of this omission in the catalogue.
By applying this procedure a number of clusters fail to enter the various richness
groups. The higher the percentage of non-compact clusters, the higher the ratio of
misclassified ones. Consequently, this effect should show best in the first richness group
- in complete accordance with the data listed in Table 4a. It is quite obvious that the
diminution of the number of clusters in richness group I cannot be counterbalanced by the
misclassification of a corresponding number of clusters in richness group II, which is
poorer in clusters and sustains a lower relative loss.
According to experience and to all cosmological theories in the first three
distance groups the red shift may be considered proportional to distance [3b, 12a], and in
this case Abell's convention regarding the counting circle must be right. An excessive
restriction of the counting circle can be significant and of a rapid rate only in the
farthest distance groups.
The opposite of this error in the angular diameter will not be examined here in
detail. In the apparent abundance ratio of the clusters it would produce the opposite
effect and would clash with the facts observed. It would also be completely irreal from
the point of view of theory [10b].
Considering the connection between the apparent loss of members of clusters and
the loss of members of richness groups on an illustrative numerical example let the
observed numbers of galaxies in medium compact clusters belonging to distance group 6 and
to richness group I be lower by, say, 20 per cent, than those belonging to distance group
5. (In reality, only the average loss of members can be expressed by a single number.) On
the other hand let us assume that the systematic observational error does not
significantly influence the number of members counted in compact clusters in the same
distance and richness groups. The clusters considered meet the criterion
 (where n is the number of galaxies counted). In accordance with our assumption each
cluster classified as medium compact, whose number of members in the distance group 5
would have been
 , would have failed to be counted owing to an increased
observational error. The loss reaches 43 per cent. of the possible values n for richness
group I Yet, in accordance with a number of other independent observations, Table 4 shows
that the space frequency of the clusters rapidly grows as n decreases. Owing to this fact
the number of medium compact clusters in which is not 43 per cent. of the
total amount of medium compact clusters in richness group I, but considerably higher.
As a result, we find that by failing to count only 20 per cent. of the galaxies in
each cluster classified as medium compact, in the first richness group the majority of
medium compact clusters gets lost. A similar operation taking 30 per cent. as a basis
shows that more than 72 per cent. of the medium compact clusters in richness group I would
be lost. This, would probably result in an anomaly in the apparent abundance ratio,
exceeding the observed one. Thus the apparent loss in members of the first richness group
is a very sensitive indication of small systematic losses in the counts of the membership
of the clusters.
Abell himself has made informative investigations to reveal the extent to which a
possible error in the angular diameter could influence the count of galaxies in clusters.
(He does not mention any investigation referring to the number of clusters in richness
groups.) In his opinion "the recorded "richness" of a cluster would seldom be affected
significantly if the radius of the counting circle were changed by 10 or 15 per cent."
[8b]. Though the probable relative error in the radius of Abell's counting circle is more
than 15 per cent. (cf. remark d in the present Section), at the first glance this
statement seems to be hardly reconciliable with what has been said above. Let us take a
numerical example again. Supposing the erroneous reduction of the counting circle between
distance groups 5 and 6 makes the counts in the clusters of more diffuse consistency drop
by an average of about 20 per cent. It has been demonstrated above that such a systematic
effect can produce radical changes in the numbers of clusters found in the various richness
groups. Yet the change in the numbers of members in individual clusters being only at the
limit of accuracy of the count, is practically untraceable, and Abell is right in terming
it "insignificant". To prove this we quote Abell [1e]: ,The counts of membership of a cluster,
intended as richness criteria, are approximate only. It was desirable, therefore, to group
the cluster into categories according to their richness in such a manner that a negligible
number of clusters would be misclassified by more than one group interval. The standard error
of an individual count was estimated at about 17 per cent." It is seen that Abell considers
the misclassification of clusters into the next richness group still tolerable. Our investigation,
on the other hand, is critically influenced just by the systematic occurrence of this phenomenon.
This means, that for the detection of otherwise untraceably small systematic errors in the
counting of galaxies, and through this, for the determination of the error in the
convention regarding the angular diameters, a new method of high sensitivity has been
developed.
The following points should be noted here:
a) The objects investigated by Abell for the determination of the change in count
were, naturally, not without exception medium compact clusters belonging to distance
groups 5 and 6, it even might be that not a single such cluster was among them. A
narrowing down of the radius of the counting circle by 15 per cent. might significantly
influence such clusters also individually.
b) Abell also admits in principle that the strong correlation between distance and
richness might be the result of some small selection in the measuring procedure [8c].
c) Naturally, it does not follow from the above that besides the error in the
determination of the counting circle no other error in observation or no natural
phenomenon can influence the anomaly in the frequency distribution observed to a smaller
extent.
d) It may be proved independently from the Einstein equations that provided the
magnitudes of the synthetically brightest members of the clusters of galaxies [la, 3a] do
not show systematic deviations larger than one magnitude in the „world picture" [13], in
conformity with the relativistic theory of the propagation of light Abell's convention
regarding the angular diameters is certainly erroneous. Between the end points of distance
groups 5 and 6 a relative variation of about 25 per cent. of the actual diameters
(in space) defined by counting circle may be expected.
A short train of ideas proving the above statement is given in the Appendix.
6) The function theta(delta) giving the correct angular diameters for the
corresponding parts of the clusters of galaxies can be determined to a reasonable accuracy
for the interval 0.16 < delta < 0.20 by repeating a small fraction of Abell's measurements
with the use of considerably modified counting circles.
The angular diameter theta can be defined by any corresponding dimension of
clusters of galaxies of any type. This means that the function theta(delta) is undefined
to a constant factor. From those discussed in Section 5 it is known that if Abell's
measurements are repeated by using any of the correct functions theta(delta), no
strong apparent correlation can result between the type and the distance of the clusters.
Based on this remark, a method permitting the approximate determination of the correct
theta(delta) function for small distance ranges may be developed.
In distance groups 5 and 6 delta does not change considerably. Through this short
interval the function theta(delta) may safely be approximated by a single linear
function. According to experience, the field of clusters covered by Abell's counting
circle from the fifth distance group on is reduced to such an extent that its further
restriction would significantly affect the count, and hence the observed abundance ratio
of the clusters of galaxies. For this reason the undetermined factor in function
theta(delta) should be selected so that in case of a value delta belonging to
distance group 5, Abell's function theta = K/delta should coincide with the real
function theta(delta) that is to say theta(delta_5) = K/delta_5.
To approximate the function theta(delta) thus defined, take a few adequate
linear functions, theta_i, all fulfilling the condition theta_5 = theta_i(delta_5), and
use them in turn to count the members in the clusters belonging to distance groups 5 and 6,
leaving, of course, all the rest of Abell's conventions unchanged. Go on with this procedure
until the apparent correlation between the richness and the distance of the clusters ceases
to appear.
This programme, rather tiresome, may considerably be simplified without the
results being significantly affected and can be executed on photoplates taken with smaller
Schmidt telescopes if the task is reversed. Instead of experimenting with the enlargement
of the counting circles to eliminate the anomaly manifesting itself in distance group 6,
which is under a strong selection effect, counts should be made in distance group 5, more
convenient for observation, by using adequately reduced counting circles to produce the
anomaly observed in distance group 6. In this case the observations may be restricted to
distance group 5. The extent of the required reduction may be determined in first
approximation after the examination of a few scores of clusters. This process artificially
produces the effect of selection in the measurements, and thus the error in the Abell
formula, theta = K/delta may be revealed.*
7) The function N_{corr}(m), corrected for error in the counting circle for the
first five distance groups reasonably agrees with the one published by Abell, but in
distance group 6 it becomes even steeper than function N_{III}(m).
The correctness of this statement is very easy to control. Owing to the excessive
reduction of the counting circle, discussed in Section 5, the counts of galaxies belonging
to a cluster decrease as the distance increases. In accordance with theory and
observations, this effect goes increasing with the distance, which means that it makes the
slope of function Log N(m) milder. Though this effect is significant only for more diffuse
clusters, to a smaller extent
*A recounting of the clusters making part of Abell's distance groups 3, 4, 5 is
planned on plates taken with the 60/90/180 cm Schmidt telescope of the Mountain station of
the Konkoly Observatory and on copies of the National Society Palomar Sky Atlas.
it necessarily appears also in the case of highly compact and rich clusters. This means
that the curve corrected for the selection must be even steeper than the one representing
the function Log N_{III}(m). The latter function is known to the required statistical
accuracy only between distance groups 5 and 6. In smaller distances, however, the extent
of the restriction of the counting circle and its effect on the outer, less compact parts
of the clusters are of no great significance (cf. Section 2), and thus it may be
substituted by the Log N_A(m) curve with a fair approximation. The corrected curve is
shown in Figure 5.
The correctness of the Log N(m) curve, made steeper in its final section, is also
indicated by the evenness of its course. In opposition to those of the original curve, the
points of the corrected diagram display only a very slight scatter and are located along a
mild curve of a uniform bend (cf. also Section 9). It is worth to mention that the
statistical weight of the individual points in Figure 5 rapidly increases from the left to
the right, and therefore the points of the curve on the left-hand side of the Figure may
show some scatter, whereas those on the right-hand side only systematic deviations. In all
probability, we have succeded in correcting the latter in the first approximation.
8) Further points advocating the function Log N_{corr}(m) of greater steepness may
be found in the parts of Abell's Catalogue statistically not investigated by the Author
himself and also in Zwicky's Catalogue.
Abell's Catalogue covers the entire area of the celestial sphere that may be
observed from the Mount Palomar Observatory. For a statistical investigation, however,
only about 2/3 of the clusters listed in the Catalogue have been used, and those that
could be observed on moderatly low galactic latitudes, i.e. under poorer observing
conditions, have been excluded. On the basis of the Catalogue, analogous of Table 4a and
Figure 1d related to the equatorial region of the Galaxy have been composed.
Table 9
The distribution of clusters of galaxies according to their distance and richness, as map
be deduced from Abell's data for clusters located at low galactic latitudes
Distance Group 1 2 3 4 5 6
Richness Group
I 2 2 2 8 49 88
100% 100% 66.7% 80% 77.8% 73.9%
II - - 1 2 11 24
33.3% 20% 17.4% 20.2%
III - - - - 1 7
1.6% 5.9%
IV - - - - 2 -
3.2%
V - - - - - -
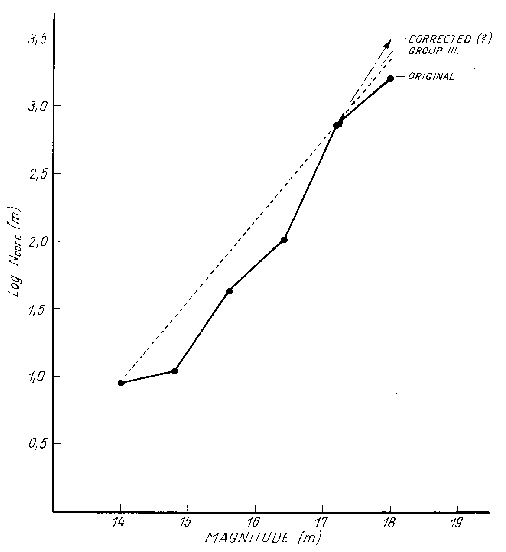 Fig. 5. The functions Log N_A(m) and Log N_{corr}(m)
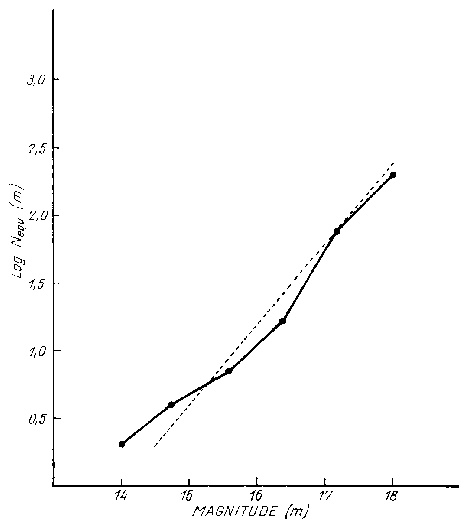 Fig. 6. The Log N_{equ}(m) diagram of Abell's clusters of
galaxies at low galactic latitudes
As seen in Figure 6 and Table 9, the correlation between the distance and the
richness of the clusters, and the higher steepness of the diagram for richness group III
in distance groups 5 and 6, manifests itself clearly also in a poorer, but independent
statistical sample.
Putting Figures 2b and 2c of Section 4 side by side it is seen that the counts of
medium compact and open clusters in Zwicky's catalogue are strongly reduced by some
observational selection. Abell [8a] analyses Zwicky's counting procedure in detail and
demonstrates that with this counting procedure in two clusters, of the same type but of
different distances, a lower count will necessarily result for the more distant one. In
case of clusters of lower central density, this loss proves to be important, whereas in
case of compact clusters it plays only a minor role. Following from this it is obvious
that the actual diagram Log N_c(m) is slightly steeper than that in Figure 2a obtained by
direct observation. This means that even from Zwicky's completely independent data, the
slope of the correct Log N curve at the right end exceeds that of the line N = 0.6 m + const.
9) The lowest sections of Log N curves constructed on the basis of Abell's
Catalogue suggest the presence of the Local Supergalaxy.
All Log N functions deduced from Abell's material are characterized by strikingly
high N values for the first distance group. Considering the low number of clusters found
in distance group 1 and 2, this fact is of no great importance for a statistical
investigation. It is worth to note, however, that as shown by independent investigations
[14a], field galaxies brighter than 15 magnitudes are also more frequent in space than
less bright ones, that is to say, our surroundings to a given distance is likely to form a
distinct unit of higher density. Considering statistical uncertainty and possible changes
in density in the Local Supercluster there is no need to try to identify the lowest part
of the observed Log N curve with that of some homogeneous and isotropic cosmological model.
Notes on the evaluation of the empirical relationships
theta(delta) and N(delta)
Current cosmological theories predict various relations between the quantities m,
delta, N and theta* principially accessible for observation. The checking of these
relations by observation permit to reject inadequate theories [15]. From among all the
possible functional relations of the four observable quantities, three are independent. So
far only the relationship m(delta) has been determined to an accuracy suitable for
cosmological evaluation [9b]. Our results permit the presumption that the relationships
N(delta) and theta(delta) also can be determined to a greater accuracy, and thus all
relationships of cosmological importance will be cleared up. For the function N(delta)
this has been rendered possible by the elimination of a systematic error, and for
theta(delta) by the application of a new method. As regards further systematic errors
in the material
*The function theta(delta) discussed in Section 6 is identical with the
angular diameter - red shift relation required in cosmology, provided only that the
average sizes of the clusters of galaxies are unchanged.
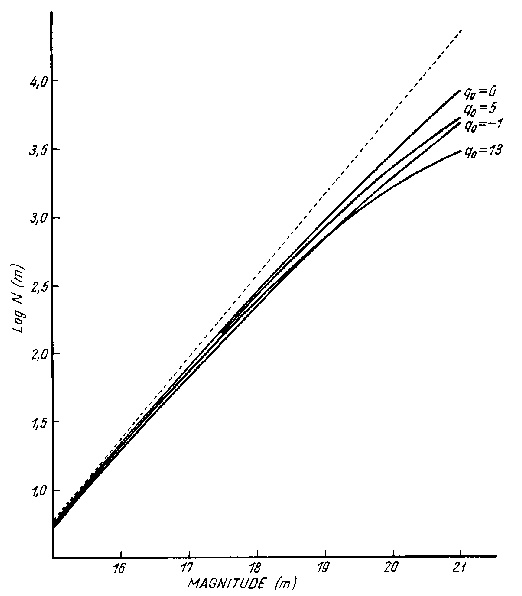 Fig. 7. Theoretical Log N(m) diagrams for steady-state and relativistic cosmological
models (Lambda = p = 0).
q_0 = parameter of cosmological deceleration [10c],
Lambda = cosmical constant,
p = pressure
(After Sandage [10d])
used no definite statement can be made yet. Consequently all that will be said in
connection with the evaluation of the observational relationships, should be considered as
tentative.
I. Abell's original Log N_A(m) and Log N_A(delta) diagrams within the limit's of
the accuracy of observations fit well with all curves predicted by various current
homogeneous cosmological models, whereas the course of the corrected Log N_{corr}(m)
diagram considerably differs from any of these curves.
For a comparison, the theoretical Log N(m) diagrams of some of the most important
cosmological models are represented here; these are the curves to fit in with the
observational points of Figure 5 after corresponding shifts parallel to the axes (Figure 7).
By collating Figure 3 and Figures 13, 14 from Lit. No. [9] it appears that the
anomalous increase of the function N_{corr}(m) corrected for the error in the angular
diameter does not come from an error in Abell's magnitude scale (from which an error in
the opposite sense could be expected) but it is a reflection of some natural phenomenon.
In this case the analysis of the correction process tending to eliminate the anomaly
observed in the abundance ratios of the various types of clusters would indicate that the
difference between empirical and theoretical Log N(m) functions is due to the change of
the space frequency of clusters, and not to the simultaneous spreading of their members.
II. If the average sizes of the clusters of galaxies did not undergo significant
changes 10^8-10^9 years ago, i.e. if theta represents a "metric angular diameter" [10b],
then, according to the predictions of the cosmological models investigated by Sandage [10],
the Abell's convention regarding the angular measures shows a relative error between
distance groups 5 and 6 greater than 15 per cent, only in case when the cosmological
deceleration parameter, q_0 is greater than 13. (Based on Table 1 and 6 in Sandage's work
referred to as [10].) The determination of the actual error in the angular diameter of the
counting circle is still to be expected from further observations, yet the current value
q_0 < 5 [11b], appears rather unlikely.*
In fair agreement with the above conclusion, theoretical curves of those
cosmological models can be fitted best to the right-hand side upper section** of the
empirical relationship m(delta) for which q_0 is of the order of magnitude of 10 at least
[10]. It is the more remarkable, that when observations relating to smaller distances and
correspondingly nearer times are considered, the best fitting theoretical curve
corresponds to q_0 = 2.5 [9b, 11b]. Possible explanations are an inaccuracy of
magnitude measurements, an uncertainty of knowledge regarding the development of galaxies,
a lack of information on intergalactic obscuration, the uncertainty of the K-correction,
the possible inhomogeneity of the velocity field of the Metagalaxy, a rapid decrease of
the deceleration of universal expansion or the anomalous curvature of space. The latter
two possibilities require the investigation of more general models of the Metagalaxy than
those considered by Sandage.
In a paper to follow it will be shown, considerably more generalized (and partly
independently from the Einstein equations) that in case the functions N(delta) and
theta(delta) are correct the density of the space distribution of large clusters of
galaxies goes growing in every direction with the distance. On the other hand, the
deceleration parameter, q_0 as determined from data related to distance groups 3, 4, 5 and
6 is not of an order of magnitude of 10 only if the structure of the space differs from
that assumed at the deduction of Friedmann's equation, or else if the average sizes of the
clusters of galaxies in different distance groups are strongly different. These conclusions
apply to models in which the velocity field is homogeneous and isotropic.
As a possible interpretation of the two conclusions it should be mentioned that a
metagalactic system, of roughly spherical shape and of a radially increasing density (just
as ,association-like" clusters of galaxies, often of similar
*In this case the relative error in the radius of the counting circle would be
smaller than 10 per cent.
**Observations of distance groups 3-6. Data refer to 10^8-10^9 years back in time.
structures [14b], planetary nebulae and some stellar associations) might be considered as
the product of an explosion. On the other hand, the strong deceleration of universal
expansion may be the consequence of the gravitational effect of an exceptionally high
density of material or of radiation, or else of some law of gravity, different from
Newton's law.* It is important to know that when taking such high gravitational effects
into consideration the dynamics of the individual large clusters of galaxies and that of
the Metagalaxy itself cannot be considered independently [12b, 16-19].
In principle it is possible and in a strongly inhomogeneous model of the
Metagalaxy it cannot even be considered unlikely that, contrary to our premise, the field
of velocity in the range under examination shows significant systematic inhomogeneity,
which means that the changes of velocity resulting from the relationships m(delta) and
theta(delta) occur not in time (negative acceleration) but in space.** In this case,
of course, the dynamical inferences regarding density and law of gravity would not apply.
Finally, we wish to point out once more that the empirical support of the ideas
outlined above is not complete yet, and that the definitive clearing up of the problems
brought up will need control observations and further discussions.
It is a pleasure to thank my wife for several useful conversations and for
extensive help with the numerical work in this paper. Special thanks are due to
Dr. I. Almár, for reading and commenting on the manuscript.
* In the general theory of relativity a corresponding modification of the law of
gravity is obtained in the case of Lambda << 0, where Lambda is the cosmical constant [11c].
** The train of ideas developed in the Appendix applies, with slight modifications,
also in this case.
APPENDIX
On the theoretically expected error in Abell's convention regarding the angular diameters
of clusters*
The absolute luminosity, L and the apparent luminosity, l, of galaxies are
interconnected by the known relationship [20]
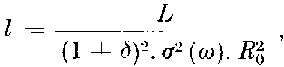 (1A)
where delta is the red shift,
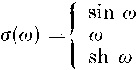 depending on the structure of
space, R_0 = R(t_0), R(t) the cosmological scale factor, t_0 the instant of the
observation. Using the formulae m = -2.5 log l and M = -2.5 log L to pass from
luminosities to magnitudes, for apparent and absolute magnitudes the following expression
results:
 (2A)
Starting from the usual metrics of relativistic cosmology, the following
relationship between the apparent and actual diameters of an object may be inferred [20]:
 (3A)
where Delta is the linear diameter of the object, and theta is the angular diameter.
Considering that R_0/R = 1 + delta, and in Abell's observations theta = K/delta:
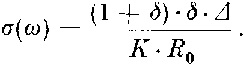 (4A)
Substitute the term found for sigma(omega) into relationship (2A):
 (5A)
Formula (5A) does not include the term sigma(omega) which means that it is
obtained without the integration of Einstein's equations or of Friedmann's equation, and
is independent from them.
Denote the term on the left-hand side of equation (5A) by mu. If the absolute
brightness of the galaxies under observation is the same, then
 (6A)
* This supplement contains the proof of the statement in Section 5 note d.
and
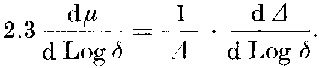 (7A)
Observations made by Humason, Mayall and Sandage [9b] have revealed the following
relationship between photovisual magnitudes corrected for red shift spectrum change
(K-correction) and the red shift itself*:
Table A_1
Relation between the photovisual magnitudes of the synthetically brightest members
of 18 clusters of galaxies and their red shifts
Cluster Cluster delta m
Number Designation
1 Virgo ..................... .004 8.27
2 Perseus 0316+4121.......... .018 11.72
3 Coma 1257+2812.......... .022 11.80
4 Hercules 1603+1755.......... .036 13.09
5 2308+0720.......... .043 13.79
6 2322+1425.......... .044 14.18
7 1145+5559.......... .052 14.70
8 0106-1536.......... .053 14.45
9 1024+1039.......... .065 14.89
10 1239+1852.......... .072 14.19
11 Cor. Bor. 1520+2754.......... .072 14.96
12 0705+3506.......... .078 15.46
13 Bootes 1431+3146.......... .131 16.21
14 1055+5702.......... .134 16.22
15 0025+2223.......... .159 16.28
16 0128+1840.......... .173 16.49
17 0925+2044.......... .192 16.41
18 Hydra 0855+0321.......... .202 16.70
From Table A_1 the corresponding curve mu(delta) may be derived (Fig. A_1).
Figure A_1 shows the absolute value of the derivative
 and, together with it, the relative error in Abell's angular diameters,
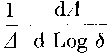 to be in general negligibly small for the first four
distance groups** (in the same range the abundance ratio of more diffuse clusters does not
drop either), whereas from the fifth distance group on it abruptly starts growing.
Substituting the derivatives by the change ratios taken from Figure Al for the
* The results of the more recent photoelectric observations made by Baum [21] have
not been considered here because he had used apertures inversely proportinal to the red
shift.
** The derivative of the function mu(Log delta) also in the range
-1.7 < delta < -1.3 differs from zero. This is likely to be the result of an excess speed
or an excess space curvature occuring in the Local Supergalaxy and might be brought into
connection with the anomaly in the abundance ratio of less significance, discussed in
Section 2.
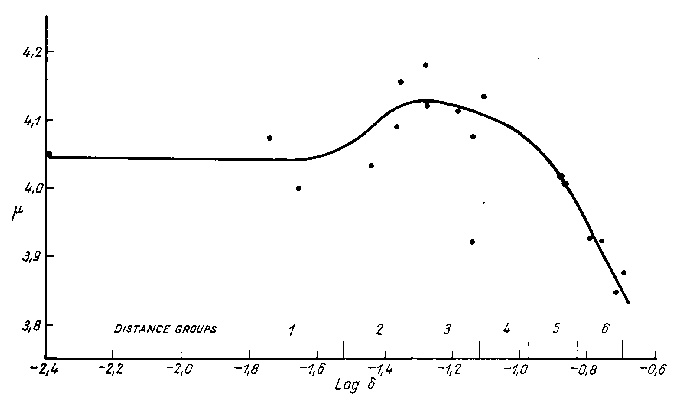 Fig. A_1. mu = 0.2 m - log (1 + delta)^2. delta versus red shift, for 18 clusters of
galaxies
corresponding distances in distance groups 5 and 6 the following equation is obtained
 (8A)
The relative error in the angular diameter to be expected between distance groups
5 and 6 appears to be considerably larger than 10-15 per cent. as mentioned by Abell
(cf. p. 19). Yet this value is uncertain, for several reasons. Magnitude measurements may
be affected by systematic errors. Magnitudes listed in Table A_1 are corrected by the
K-term but its value is uncertain. No reliable data on intergalactic obscuration are
available and its effect cannot be taken into account. Finally, the scanty information we
have on the evolution of galaxies cannot give sufficient support to the assumption used in
Formula (6A) according to which M is independent from time. The conspciuous drop of the
curve A_1, however, would not correspond to facts unless a sudden systematic drop of about
1.5^m occurred in the absolute intrinsic brightness of galaxies. It is seen that our
conclusion hardly depends on possible cosmogonical changes.
Figure A_1 contradicts the opinion generally spread in astronomy that the red
shift is a linear function of "distance", which is also the starting point of Abell's
working hypothesis. Observations indicate that "distance by apparent size" [11c] and the
concept of distance based on red shift from distance groups 4 on are sharply different
[10f].
References:
1. Abell, G. O.: Ap. J. Suppl. Ser. Vol. III. Pp. 211-288 (1958) a) Pp. 219-220 - b) Pp. 221-222 - c) Pp. 223-225 - d) Pp. 215-218, 225 e) p. 227 2. Just, K.: Ap. J. 129, p. 268 (1959) 3. McVittie, G. C.: in ''Handbuch der Physik" LIII. Pp. 445-488 (Springer-Verlag, Berlin, 1959) a) p. 479 - b) Pp. 483-484 4. Zwicky, F., Herzog, E., and Wild, P.: Catalogue of Galaxies and of Clusters of Galaxies Vol. I. (California Institute of Technology, 1960) 5. Hubble, E.: Observational Approach to Cosmology p. 58. (Oxford: Clarendon Press, 1957) 6. Zwicky, F.: Morphological Astronomy, p. 157. (Springer-Verlag, Berlin, 1957) 7. Zwicky, F.: in "Handbuch der Physik" LIII p. 395. (Springer-Verlag, Berlin, 1959) 8. Abell, G. O.: in "Problems of Extra-Galactic Research" IAU Symposium No; 15. (Macmillan Company, New York, 1962) a) Pp. 220-223 - b) Pp. 223-225 - c) p. 237 9. Humason, M. L., Mayall, N. U. and Sandage, A. R.: Ap.J. 61, p.97 (1956) a) p. 159 - b) Pp. 146-151 10. Sandage, A. R.: Ap.J. 133, Pp. 355-392 (1961) a) p. 362 - b) Pp. 376-380 - c) p. 357 - d) Pp. 363, 371 -375 e) Pp. 363, 378 - f) p. 367 - g) p. 381 11. McVittie, G. C.: Fact and Theory in Cosmology (Eyre and Spottiswoode, London, 1961) a) p. 131 - b) p. 137 - c) Pp. 144-146 12. McVittie, G. C.: General Relativity and Cosmology (Chapman and Hall Ltd. London, 1956) a) p. 153 - b) Pp. 116-118 - c) p. 147 13. Bondi, H.: Cosmology, p. 71 (Cambridge U. P., 1960) 14. Proceedings of the Conference on Instability of Systems of Galaxies, edit. by Neyman. J., Page, Th. and Scott, E. A. J. 66, Pp. 533-636 (1961) a) p. 609, Fig. 4. - b) p. 630 15. Balazs, B. and Paal, G.: Nature 189, p. 992 (1961) 16. Paal, G.: Acta Phys. Hung, in press 17. Schluter, A.: A.J. 60, Pp. 141-143 18. Zelmanov, A. L.: in ,Trudy 6.soveschania po voprosam cosmogonii" Pp. 156, 170 (Acad. Nauk S.S.S.R., Moscow, 1959) 19. Heckmann, O.: Theorien der Kosmologie, Pp. 17-19, 46 (Springer-Verlag, Berlin, 1942) 20. Heckmann, O. and Schucking, E.: in ''Handbuch der Physik" LIII. Pp. 509-511 (Springer-Verlag, Berlin, 1959) 21. Baum, W. A.: in "Problems of Extra-Galactic Research" IAU Symposium No 15. p. 396 (Macmillan Company, New York, 1962)