A MAGYAR MITTEILUNGEN
TUDOMÁNYOS AKADÉMIA DER
CSILLAGVIZSGÁLÓ STERNWARTE
INTÉZETÉNEK DER UNGARISCHEN AKADEMIE
KÖZLEMÉNYEI DER WISSENSCHAFTEN
BUDAPEST-SZABADSÁGHEGY
Nr. 59
E. ILLÉS-ALMÁR AND I. ALMÁR
PERIOD CHANGES OF THE SATELLITE
1960 EPSILON 3
IN 1963/64 AS DEDUCED FROM
OBSERVATIONS WITHIN
THE INTEROBS PROGRAM
BUDAPEST, 1965
PERIOD CHANGES OF THE SATELLITE 1960 epsilon3 IN 1963/64
AS DEDUCED FROM OBSERVATIONS WITHIN
THE INTEROBS PROGRAM*
by
E. ILLÉS-ALMÁR and I. ALMÁR
Zusammenfassung. Aus [7] wurden die Beobachtungen des Satelliten 1960 epsilon3
(Kabine Sputnik 4) ausgewählt und die besten 39 Durchgänge, die sich zwischen 21 August
1963 und 27 Sept. 1964 verteilen, bearbeitet. Zuerst berechnete eine elektronische
Rechenmaschine nach der Methode [9] die zu 393 simultanen Vermessungen gehörigen XYZR
Raumkoordinaten des Satelliten. Dann wurde (nach einem Vorschlag von I. D. Shongolowitsch)
bei jedem Durchgang die Durchgangszeit des Satelliten über einen ausgewählten geographischen
Breitenkreis bestimmt (Tab. 3). Insofern die Periode sich gleichmässig
änderte, konnte die Beschleunigung pro Umlauf dP/dn mittels der Abweichungen zwischen den
beobachteten und den mit einer konstanten Periode berechneten Durchgangszeiten bestimmt
werden. Es wurden für 31 Durchgänge (267 Raumpunkte enthaltend) Periodenänderungen dP/dn
berechnet (Tab. 4). In allen beobachteten Zeitabständen war die Periodenänderung konstant,
mit Ausnahme der ersten, wo am 26 August 1963 der |dP/dn| Wert - parallel mit einer Verminderung
der Sonnenfleckenzahl und der Gesamtfläche der Sonnenflecken - plötzlich abgenommen hat
(Tab. 5, Abb. 2-8). Diese Änderung war sechsmal grösser als der Standardfehler der vorherigen
dP/dn Werte und entsprach einer Verminderung der Luftdichte in der Perigeumhöhe (255 km)
um 31%. Es ist bemerkenswert, dass die |dP/dn| Werte in Juli und Sept. wesentlich kleiner waren
als die früheren. Diese Verminderung konnte auch unabhängig davon durch den zeitlichen
Verlauf der Umlaufszeit bewiesen werden. Dieser Umstand hängt wahrscheinlich auch mit der
Abnahme der Sonnenaktivität zusammen und daraus folgt der prolongierte Untergang des Satelliten.
INTRODUCTION
Air drag is playing a vital role among perturbing forces acting upon the motion of
artificial satellites. Its effect becomes visible in the decrease of a, e and the period of
revolution (P), these changes being connected with air density in the region near perigee.
The decrease of the nodal period of revolution, easily measurable by observing the
satellite's reappearance above a given geographic latitude, yealds a suitable tool for the
investigation of the influence of air drag on satellite motion. As the deviations between
observed and calculated transit times (O-C), on the one hand, and the rate of period
* Paper presented at The International Symposium on Satellite Tracking (October
14-17, 1965, Budapest.)
change, on the other hand, are closely connected, even a regular tracking
network of comparatively small extent might produce valuable data for
atmospheric physics. Experience shows, however, that the density of upper
atmosphere depends on the intensity of solar activity, hence satellite orbit
studies may lead to a better understanding of geophysical influences of the
Sun in general.
Several successful attempts have been made to utilize optical obser-
vations - including also rough visual fixes available in large quantities - in
order to investigate changes in the orbital elements of artificial satellites [1].
As optical observations in the general case give only the direction of the satellite
with respect to the tracking station, the determination of orbital elements
is usually carried out by means of classical celestial mechanics based on a
set of observations and on the method of successive approximation (Laplace,
Gauss). From an adequate number of optical fixes orbital elements can be
obtained, referring to the whole time interval during which the observational
material has been collected. The method is more effective if the material is
of higher accuracy, more extensive, and covers a longer portion of the whole
orbit [2]. In practice, however, because of the quick changes in the elements
of artificial satellites due to deviations of the Earth's gravitational field from
a central field and also due to air drag, some assumptions must be introduced
concerning the direction and speed of changes in the orbital elements in the
period under investigation.
If perfect synchronism of observations carried out from a base line of
appropriate length on the same satellite can be guaranteed in some way or
another, the instantaneous position in space of the satellite is fixed. In this
case orbit studies which are based on a limited number of observations are
possible. This possibility means, in a fortunate case, a shorter time interval
during which the shift of orbital elements may be either easily taken into
account or neglected. This fact, important mainly for low-orbit satellites,
gives an opportunity of studying even quick changes of certain orbital elements
(e.g. period of revolution).
The synchronism of optical fixes may be assured, in general, by several
methods:
a). If short light signals are emitted by a satellite at definite times
(e.g. ANNA-1B), the position of the satellite with respect to the stars can
be photographed from stations at both ends of a base line. This is the best
solution of the problem, but owing to technical difficulties it cannot be used
frequently.
b) If the camera control systems are connected so that they are activ-
ated by the same time signal, then every satellite illuminated by the sun can
be photographed simultaneously from the tracking stations. The drawback
of the method is that this perfect synchronism encounters serious technical
difficulties.
c) If the apparent path of the satellite is supposed to be a great
circle,
pairs of simultaneous observations may be selected quite independently of
time statements [3]. The topocentric radius vector M_2S belonging to a given
topocentric radius vector M_1S must lie, however, in the plane defined by the
known radius vector M_1S and the base line M_1M_2, and also in the, plane
described by the apparent path of the satellite (notations see on Fig. 1). The
line of intersection of these planes fixes the direction of the satellite from
M_2 at a specified moment. One drawback of this method is that it requires
extensive calculations.
d) An interpolation can be used to select a pair of simultaneous observ-
ations, frequent and consecutive from at least one of the stations and sporadic
from the other, occurring within the same time interval. It is well known
that the apparent orbit of an artificial satellite is quite smooth within an
interval of less than a minute. Therefore this method has the advantage of
reducing the random errors in the observations, since the interpolated values
represent mean values of a set of observed azimuthal or equatorial coordinates,
provided the orbit is smooth. The method was used in both the Soviet and
American triangulation programs [4], [5]; it has been introduced by M. Ill
to visual observations [6].
In order to increase the number of simultaneous observations a special
network of Hungarian, German, later Soviet, Bulgarian, Polish and Roumanian
tracking stations was established in 1961/62 under the designation INTEROBS.
It has been organized, according to its coordinator Mr. M. Ill, for the purpose
of performing serial observations within previously fixed time intervals on
certain artificial satellites. All observations obtained during these intervals
(„campaigns") were summarized and published at Baja (Hungary) [7]. Several
methods have been suggested [8] to evaluate simultaneous observations
selected from this material by means of graphic interpolation. The aim of the
present paper is to investigate tracking data on the cabin of Sputnik 4 (1960 epsilon3)
using a combination of methods proposed at the conference of satellite observers
at Riga in 1965.
Our experiences have shown that the observational material of the first
INTEROBS cycles, collected mainly in Eastern Europe, did not enclose a
portion of the orbit long enough to allow exact determination of all orbital
elements (e and omega in particular) separately for every revolution. Hence, follow-
ing a proposal of I. D. Zhongolovich, we intended only to study the changes
of the nodal period of revolution of the satellite.
From the material available simultaneous observations carried out in
the following intervals have been selected: 21-30 Aug. 1963, 17 Feb., 10-13
Apr., 8-13 June, 7-12 July and 18-27 Sept. 1964.
Evaluation has been limited to the following transits:
TABLE 1
Dates No. of transit Number of sim. pairs
in [7] of observations
1963
21 Aug. 2 6
22 4 15
23 5 9
23 6 18
24 7 1
24 8 8
25 9 2
26 12 9
27 13 8
27 14 4
TABLE 1 (cont.)
No. of transit Number of sim. pairs
Date in [7] of observations
29 16 12
29 17 5
30 19 5
1964
17 Feb. 27 14
10 Apr. 38 1
10 40 1
11 42 22
12 46 32
13 49 5
8 June 71 4
9 77 3
11 83 1
12 85 17
13 89 3
13 92 1
7 July 93 28
8 94 21
9 95 27
10 96 6
12 98 18
18 Sept. 118 10
20 119 12
22 120 9
22 122 16
23 123 7
24 127 2
25 128 5
26 134 8
27 138 18
Total: 39 transits 393 simultaneous points
The contribution of tracking stations to the observational material is
the following
TABLE 2
Country Station Number of
number fixes
Ryazan U.S.S.R. 1042 136
Baja Hungary 1113 124
Budapest Hungary 1111 84
Vologda U.S.S.R. 1014 84
Arkhangelsk U.S.S.R. 1004 80
Cluj Roumania 1132 47
Chernovtsy U.S.S.R. 1062 45
Riga U.S.S.R. 1040 36
Kiev U.S.S.R. 1023 29
Kishinev U.S.S.R. 1024 27
Bautzen G.D.R. 1120 21
TABLE 2 (cont.)
Country Station Number of
number fixes
Tartu U.S.S.R. 1051 17
Olsztyn Poland 1151 17
Rostov U.S.S.R. 1041 14
Rodewisch G.D.R. 1185 8
Erevan U.S.S.R. 1018 7
Dnepropetrovsk U.S.S.R. 1017 5
Stara Zagora Bulgaria 1102 5
Birsk U.S.S.R. 1085 4
Kazan U.S.S.R. 1020 1
Petrozavodsk U.S.S.R. 1038 1
Zvenigorod U.S.S.R. 1072 1
Total: 22 stations 793 fixes.
Plotting the celestial coordinates against time, pairs of simultaneous observations
have been selected by the aforementioned method of graphic interpolation. If serial fixes
were made from several stations at the same time, we tried to adopt the procedure of
interpolation on the sequences of each station. Single observations are weighted by 1;
coordinates interpolated at the beginning or at the end of a sequence (uncertain values)
by 2; reliably interpolated values by 3.
The authors would like to thank Mr M. Ill and Mr K. Süto for kindly permitting the
use of pairs of simultaneous points selected by them from the material of the Aug. 1963,
Feb. and Apr. 1964 intervals.
THE METHOD
Instantaneous positions in space of the satellite have been determined from pairs
of simultaneous fixes according to the procedure proposed at the Riga conference [9]. Its
program used in the computer reduction (electronic computer Type Elliott 803) is given in
the Appendix.
Starting from observations in the equatorial coordinates (alpha_1 delta_1 and
alpha_2 delta_2 respectively) equations are written for planes in a rectangular system
fixed in space, satisfying the following two conditions: a) they each contain one
observing station, M_1 or M_2; b) they contain angles alpha_1 and alpha_2 with the [XY]
plane of the coordinate system respectively.
The coordinates x_s and y_s of the satellite are given by the line of intersection
of the planes (mu). If straight lines are drawn inside these planes containing the angles
90° - delta_1, 90° - delta_2 (measured from the North Pole) from stations M_1 and M_2
respectively, their intersection with mu provides two fictitious positions of the
satellite in space (S_I, S_II) (see Fig. 1). Forming their appropriately weighted mean
value, points in space can be obtained which
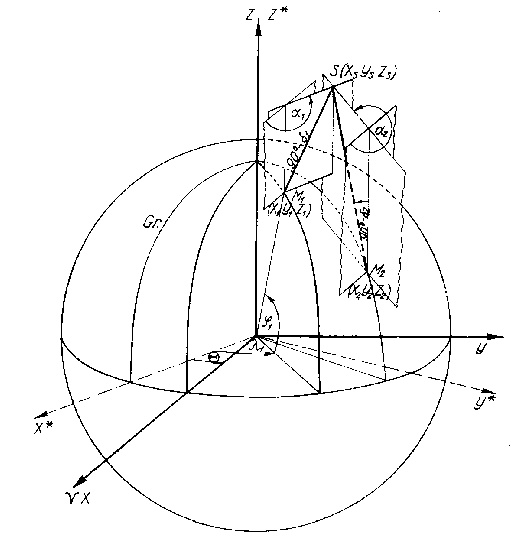 Fig. 1.
serve as a basis for further calculations (S_1, S2,...). The set of equations used is a
simple consequence of the basic equation of cosmic triangulation [10]:
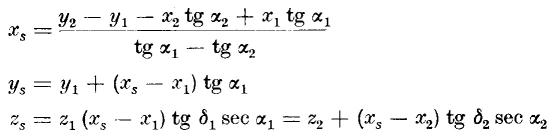 It is to be noted that the method offers the advantage of providing a pair of solutions
even in the case of not absolutely accurate observations (without a least-squares
solution), as the errors in the initial data present themselves in the deviation of the
two different results for the z_s coordinate of the satellite. The use of serial fixes
makes a graphic smoothing of the x_s, y_s, z_s and
 values feasible.
I. D. Zhongolovich proposed in a paper presented at the Riga conference under the
title "Remarks to the Interobs program" that changes of the nodal period of revolution of
satellites should be determined from the visual observations. He proved that sequences of
spatial positions give transit times above a given geographic latitude circle (phi_0)
accurate to at least a few tenths of a second. Consequently from two passes observed on
two consecutive nights the mean period of revolution of the satellite is determinable to
a few hundredths of a second. There is hereby a hopeful possibility to analyse quick period
changes of low-orbit satellites with an adequate accuracy.
First of all the geocentric latitude of the subsatellite points (phi_n) is needed.
It can be easily derived from space coordinates, namely through
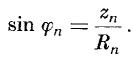 Plotting phi_n, as a function of the epoch of observation (t_n) we are able to perform on
the smoothed curve a graphic determination of the satellite's crossing time over the given
latitude circle (t_0). The numerical procedure proposed by Zhongolovich is more accurate
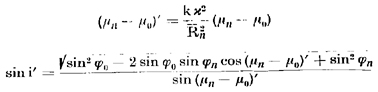
and makes extrapolation possible. If the path element in question is short, equation
 holds true, where
 if R_n and a are expressed in kilometers, (t_n - t_0) in seconds and (mu_n - mu_0)
in degrees.
Calculating the transit times t_0 belonging to phi_0 from every pair (t_n phi_n)
separately, their mean value
 is to be formed. As a first step, however,
approximate values of i, a and e are needed. Orbital elements published by prediction
services might be used as a first approximation. Taking them as a starting point, all t_0
values on a selected long transit of high quality should be calculated. If the t_0 values
thus obtained show a monotonous decrease or increase as a function of time, the adopted
value of i has to be corrected. To derive its correct value we may proceed as follows: if
e.g. t_01 < t_0 < t_02 where t_01 and t_02 are arbitrary t_0 values at the
beginning (t_n1) and at the end (t_n2) of the given transit respectively, we have
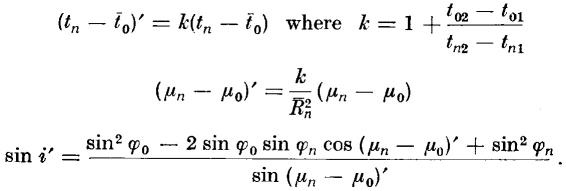 Dashed letters are the corrected quantities. A mean value of i', derived from
several pairs of (t_n1, t_n2) equals the correct inclination of the orbital
plane.
Then follows the determination of a using values of a pair of well
observed transits separated by nearly 24 hours
 . With the approximate value of the
orbital period, the revolution number (n) between the two selected transits can
be guessed.
Hence we get
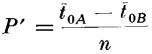 the nodal period of revolution in a closer approximation. Kepler's third law then yields a
(the deviation between nodal and sidereal period of revolution is not significant -
see later) and combining it with e we obtain kappa. The value of e can be easily estimated
if there are observations near perigee or apogee (i.e. R_per or R_ap is known), because
then
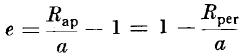 will hold.
Finally, using the corrected i and kappa values, the calculation of t_0 from every
point of every transit has to be completed. It is advisable to choose phi_0 inside or at
least near to the observed portions of the orbits in question, but experience shows that
it is acceptable also if subsatellite points are not farther from the selected latitude
circle than 6-8 degrees. The mean value of the t_0 values represents the observed crossing
time over the latitude phi_0 during a given transit:
 For organizational reasons, as a rule, Interobs cycles lasted 7-10 days per month,
therefore period changes were investigated within each cycle separately.
Calculations may be carried out as follows. Let us suppose as a first approximation
that the period is constant and equals to its approximate value, P', furthermore that the
starting epoch
 Plotting the O - C values against time, usually a parabola is obtained, in accordance with
the general tendency of decreasing of the period of revolution. Then the P_0 period,
belonging to the first of the transits observed, is to be determined, using either graphic
or - following a proposal of M. Ill - numerical solution. He supposes that during the
given time interval nodal period increases steadily by Delta sec per each revolution,
then
 where
 and the period changes during one revolution by
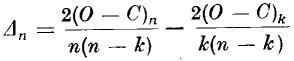 where (O - C)_k belongs to the k^th, (O - C)_n to the n^th orbit and
 n > k. For practical purposes two well observed transits should be selected.
Repeating the calculation of residuals using the P_0 value from either the graphic
or the numerical solution we have
 which yields as a result the rate of change of the nodal period for each transit
separately
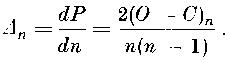 If these results are equal, i.e. Delta_n = const., our assumption appears to be valid and
the procedure yields the period change in the whole interval in question. If Delta_n
varies, we should try to divide the interval into several parts and select points near
enough to each other to allow the determination of a Delta_n = const. value. In practice
it may seem reasonable to plot first 2(O - C)_n as a function of n(n - 1) and test whether
the points lie on a single straight line or not. If it can be assumed that Delta_n = const.,
it is worth while to carry out the inverse procedure, namely to determine P_z, the period
of revolution belonging to the last transit of the interval. Then in the opposite direction
 hence Delta_m can be calculated exactly in the same manner as in the previous case.
The influence of the errors of the observed O_n values on Delta_n being inversly
proportional to n(n - 1), we formed a weighted mean of the Delta_n and Delta_m pairs for
every transit separately
 The result has been considered as the rate of decrease of the period (in sec/rev) during
the time interval under consideration.
RESULTS
The part of the observational material published in [7], seemingly most suitable
to an investigation of the type outlined above, consisted of 39 transits of 1960 epsilon3.
Altogether 6 transits have been rejected, partly because the path element observed was too
far from the latitude circle phi_0 (pass No. 5), partly because it belonged to a time
interval where the number of suitable transits to deduce period changes proved to be
insufficient (pass No. 27 and passes No. 77, 83, 89, 92 respectively).
One third of all positions in space, given by the computer program, have been
similarly neglected (126 points out of 393). These points have been rejected because
a) they belong to transits already cancelled;
b) they were far from the latitude circle phi_0;
c) the length of their radius vector, R, differed considerably from all other R
values of the transit (in some cases it is a consequence of the decreased parallax of the
satellite as seen from the pair of stations);
d) another set of XYZR values could be derived from other observations but
referring to the same moment. In this case corresponding quantities have been averaged.
A review of the whole observational material is given in Table 1. Positions in
space actually used, the partial results of the Zhongolovich method and transit times are
summarized in Table 3.
TABLE 3
t_n z_n R_n t_0-t_n t_0
h m s km km s h m s
1963
21.8 20 34 2.8 6020. 6858.83 20.1 20 34 22.9
34 6.7 6010.5 6848.37 19.9 34 26.6
22.8 21 4 17.9 6110.43 6859.57 81.2 21 5 39.1
4 31.4 6090.99 6861.64 64.9 5 36.3
4 36.4 6087.69 6861.62 62.5 5 38.9
4 40.2 6082.55 6861.98 58.7 5 38.9
5 3.7 6052. 6863. 37.6 5 41.3
5 5.3 6048. 6864. 34.5 5 39.8
5 27.2 6015.09 6862.84 15.3 5 42.5
6 5.0 5942. 6866. -25.1 5 39.9
6 24.0 5902.50 6867.69 -44.7 5 39.3
6 34.2 5878.51 6866.34 -55.1 5 39.1
6 44.0 5853.54 6862.84 -64.7 5 39.3
23.8 20 3 43.9 6094.75 6857.87 70.2 20 4 54.1
3 51.9 6082.94 6855.64 62.9 4 54.8
4 3.1 6062.33 6856.60 47.9 4 51.0
4 5.8 6060.84 6855.22 47.7 4 53.5
4 30.0 6022.95 6857.82 22.4 4 52.4
4 43.4 6001.38 6860.18 8.8 4 52.2
4 58.7 5974.39 6859.39 -5.6 4 53.1
5 5.0 5970.77 6874.76 -10.0 4 55.0
5 46.5 5874.21 6858.28 -53.8 4 52.7
6 5.0 5833.03 6859.42 -72.2 4 52.8
24.8 19 4 0.2 5741.15 6588.34 3.7 19 4 3.9
20 34 57.6 6083.11 6851.52 65.6 20 36 3.2
35 15.1 6058.43 6853.67 47.0 36 2.1
35 17.8 6054.62 6851.09 46.0 36 3.8
35 38.5 6024.46 6856.65 23.9 36 2.4
36 29.0 5932.74 6858.58 -26.5 36 2.5
25.8 19 34 4.3 6103.25 6865.52 71.6 19 35 15.9
36 28.6 5831.57 6879.74 -80.5 35 8.1
26.8 20 5 26.8 6062.73 6859.66 46.4 20 6 13.2
5 30.4 6058.48 6858.20 44.5 6 14.9
5 32.7 6055.18 6857.24 42.8 6 15.5
5 33.3 6054.48 6857.11 42.5 6 15.8
5 40.4 6044.36 6855.46 36.9 6 17.3
6 0.4 6012.86 6856.22 17.3 6 17.7
7 39.0 5808.94 6855.04 -80.6 6 18.4
27.8 19 5 14.4 6000.01 6855.34 10.4 19 5 24.8
5 52.1 5938. 6858.99 24.1 5 28.0
6 4.0 5912.84 6874.50 -42.7 5 21.3
TABLE 3 (cont.)
t_n R_n t_0-t_n t_0
h m s km km s h m s
6 5.0 5910.95 6875.98 -44.2 5 20.8
6 39.3 5825.51 6857.24 -74.5 5 24.8
20 36 49.8 6092.35 6928.63 27.3 20 37 17.1
39 3.7 5760.66 6860.36 -101.9 37 21.8
39 4.6 5754.54 6854.32 -102.1 37 22.5
39 5.6 5747.28 6844.68 -101.5 37 24.1
29.8 18 34 32.3 6073.52 6855.59 56.2 18 35 28.5
34 59.1 6032.15 6857.14 28.3 35 27.4
35 3.8 6029.80 6860.94 24.9 35 28.7
35 4.6 6031.07 6863.07 24.6 35 29.2
35 5.5 6032.27 6865.09 24.2 35 29.7
36 3.8 5905.21 6851.47 -36.7 35 27.1
36 4.8 5903.23 6851.77 -37.8 35 27.0
36 6.1 5901.27 6852.49 -39.0 35 27.1
36 10.5 5900.06 6859.18 -42.4 35 28.1
20 7 23.4 5990.36 6862.02 1.8 20 7 25.2
7 49.8 5939.31 6863.97 -25.6 7 24.2
7 52.9 5941.68 6871.21 -27.6 7 25.3
30.8 19 6 34.6 5968.99 6859.71 -8.6 19 6 26.0
6 34.8 5969.20 6859.39 -8.3 6 25.5
1964
10.4 18 14 7.5 5107.44 6753.54 10.6 18 14 18.1
19 46 14.2 5287.86 6780.66 -32.9 19 45 41.3
11.4 18 34 37.2 4888.92 6822.06 78.5 18 35 55.7
34 40.8 4902.36 6817.63 74.4 35 55.2
34 43.3 4910.40 6813.19 71.6 35 54.9
34 44.9 4916.75 6812.34 69.9 35 54.8
34 48.1 4927.56 6806.41 66.2 35 54.3
34 51.0 4940.47 6806.28 63.0 35 54.0
34 52.5 4944.53 6903.25 61.5 35 54.0
34 56.3 4963. 6801.32 56.6 35 52.9
34 59.0 4974. 6795.90 52.8 35 51.8
34 59.6 4976.64 6805.79 54.1 35 53.7
35 2.9 4994.18 6810.19 50.7 35 53.6
35 5.9 5009.50 6813.21 47.6 35 53.5
35 9.8 5027.16 6814.47 43.3 35 53.1
35 11.5 5032.33 6812.09 41.5 35 53.0
35 13.1 5037.87 6810.68 39.9 35 53.0
35 15.8 5047.97 6809.14 37.0 35 52.8
35 18.4 5056. 6802.86 33.7 35 52.1
35 20.8 5059.60 6799.49 32.2 35 53.0
35 24.9 5072.70 6795.92 28.1 35 53.0
12.4 18 57 18.0 5143.25 6781.82 6.9 18 57 24.9
57 23.5 5175.94 6790.47 0.0 57 23.5
57 28.7 5195.29 6790.15 -5.3 57 23.4
57 31.7 5201.69 6786.30 -7.8 57 23.9
57 33.9 5207.49 6786.19 -9.4 57 24.5
57 39.0 5218.91 6779.86 -13.8 57 25.2
57 43.5 5223.77 6770.78 -17.0 57 26.5
57 46.3 5253.41 6785.25 -22.2 57 24.1
57 50.3 5262.79 6780.38 -25.9 57 24.4
57 55.3 5288.62 6786.64 -31.8 57 23.5
1 57 59.4 5299.50 6784.09 -35.5 57 23.9
58 4.6 5312.73 6780.55 -40.0 57 24.6
TABLE 3 (cont.)
t_n z_n R_n t_0-t_n t_0
h m s km km s h m s
58 9.4 5325.72 6777.97 -44.3 57 25.1
58 14.0 5340.78 6777.23 -48.9 57 25.1
58 18.8 5358.97 6778.01 -54.0 57 24.8
58 23.4 5376.34 6778.87 -59.0 57 24.4
58 26.9 5387.13 6778.15 -62.4 57 24.5
58 30.8 5400.01 6777.84 -66.4 57 24.4
58 33.8 5408.82 6777.49 -69.2 57 24.6
58 38.8 5414.63 6770.89 -72.4 57 26.4
58 42.8 5430.92 6772.68 -77.0 57 25.8
13.4 17 48 47.6 5426.59 6775.45 10.2 17 48 57.8
48 49.3 5437.17 6775.39 6.9 48 56.2
48 56.8 5458.46 6776.53 0.5 48 57.3
50 14.1 5679.94 6774.16 -76.6 48 57.5
8.6 0 18 36.2 4643.84 6754.14 102.3 0 20 18.5
18 48.4 4697.44 6752.85 90.1 20 18.5
19 1.9 4759.26 6751.10 75.8 20 17.7
19 17.6 4820.83 6747.15 60.8 20 18.4
12.6 0 5 42.0 4933.49 6758.85 36.1 0 6 18.1
6 16.5 5069.15 6749.97 0.4 6 16.9
6 19.1 5069.95 6742.04 -1.3 6 17.8
6 20.5 5084.84 6750.54 -3.5 6 17.0
6 24.6 5100.91 6750.15 -7.8 6 16.8
6 31.2 5125.03 6748.76 -14.4 6 16.8
6 33.1 5133.45 6749.98 -16.3 6 16.8
6 34.6 5125.46 6739.29 -16.3 6 18.3
6 37.6 5134.63 6737.21 -19.2 6 18.4
6 42.6 5143.52 6729.61 -23.0 6 19.6
6 44.7 5175.52 6747.64 -28.1 6 16.6
7 13.4 5216.78 6743.11 -57.1 6 16.3
7 19.2 5287.78 6736.80 -61.5 6 17.7
7.7 0 37 59.6 4860.98 6601.83 -56.2 0 37 3.4
38 0.2 4854.41 6601.74 -55.3 37 4.9
38 3.8 4864.64 6635.36 -59.4 37 4.4
38 3.9 4866.70 6640.38 -59.9 37 4.0
38 7.3 4852.35 6639.35 -63.1 37 4.2
38 10.3 4843.32 6644.37 -66.2 37 4.1
38 12.3 4831.54 6639.01 -68.0 37 4.3
38 16.6 4814.69 6640.10 -72.2 37 4.4
38 18.4 4809.48 6643.77 -74.1 37 4.3
38 20.4 4800.52 6642.09 -75.9 37 4.5
38 22.9 4791.36 6645.93 -78.8 37 4.1
38 24.2 4785.95 6645.32 -80.0 37 4.2
38 26.5 4777.49 6648.37 -82.6 37 3.9
38 28.6 4768.32 6649.01 -84.8 37 3.8
38 33.5 4744.89 6642.83 -89.0 37 4.5
38 34.9 4738.86 6644.81 -90.8 37 4.1
38 42.1 4706.07 6639.95 -97.3 37 4.8
38 44.2 4697.43 6640.31 -99.3 37 4.9
38 47.1 4684.79 6639.51 -102.1 37 5.0
38 47.8 4680.92 6638.97 -102.9 37 4.9
38 50.5 4668.94 6637.18 -105.2 37 5.3
38 56.6 4641.99 6638.00 -111.4 37 5.2
38 59.1 4632.78 6636.94 -113.3 37 5.8
39 1.3 4621.96 6637.93 -115.8 37 5.5
TABLE 3 (cont.)
t_n z_n R_n t_0-t_n t_0
h m s km km s h m s
39 6.9 4599.51 6636.37 -120.5 37 6.4
8.7 23 42 45.9 5128.98 6652.95 4.4 23 42 50.3
42 58.8 5067.39 6643.29 -10.0 42 48.8
42 58.9 5073.59 6647.58 -9.3 42 49.6
42 59.6 5072.33 6649.09 -9.9 42 49.7
43 1.3 5055.44 6641.69 -12.8 42 48.5
43 1.6 5063.18 6648.40 -12.1 42 49.5
43 2.8 5068.83 6656.49 -12.3 42 50.5
43 3.3 5056.21 6648.41 -14.0 42 49.3
43 3.8 5043.74 6640.33 -15.6 42 48.2
43 4.5 5054.12 6650.77 -15.0 42 49.5
43 7.3 5019.17 6632.89 -20.4 42 46.9
43 12.0 5000.94 6631.83 -24.9 42 47.1
43 13.3 5004.66 6638.05 -25.2 42 48.1
43 16.8 5003.09 6647.08 -27.4 42 49.4
43 19.0 4998.61 6650.34 -29.2 42 49.8
9.7 22 29 17.5 5277.51 6654.29 45.9 22 30 3.4
29 30.8 5221.53 6643.98 32.0 30 2.8
29 31.1 5229.64 6650.71 31.4 30 2.5
29 32.8 5217.71 6643.07 31.1 30 3.9
29 33.7 5223.84 6650.89 31.1 30 4.8
29 35.5 5217.37 6650.22 29.4 30 4.9
29 47.8 5172.63 6649.83 17.0 30 4.8
29 48.8 5170.49 6649.04 16.6 30 5.4
30 1.5 5124.09 6649.02 3.9 30 5.4
30 1.8 5120.42 6647.84 3.2 30 4.6
30 2.9 5115.17 6648.13 1.7 30 4.6
30 3.5 5113.63 6647.84 1.3 30 4.8
30 4.2 5110.01 6649.05 0.1 30 4.3
30 4.3 5111.41 6651.43 0.0 30 4.3
30 5.6 5103.68 6648.23 -1.4 30 4.2
30 11.0 5081.84 6644.50 -6.4 30 4.6
30 12.0 5072.41 6640.64 -8.1 30 3.9
30 17.7 5063.50 6649.84 -12.4 30 5.3
30 17.9 5062.39 6648.28 -12.3 30 5.6
10.7 22 48 3.4 5187.55 6638.88 23.5 22 48 26.9
48 4.3 5179.83 6634.82 22.1 48 26.4
48 7.4 5174.19 6636.66 20.2 48 27.6
48 15.6 5163.91 6653.04 13.9 48 29.5
48 16.3 5152.48 6647.66 11.9 48 28.2
48 17.3 5137.48 6641.20 9.2 48 26.5
12.7 21 52 27.8 5427.84 6649.54 93.5 21 54 1.3
52 28.8 5425.39 6649.57 92.7 54 1.5
52 29.9 5421.51 6649.09 91.5 54 1.4
52 30.8 5419.21 6649.34 90.7 54 1.5
52 32.0 5415.74 6649.30 89.6 54 1.6
52 32.7 5413.68 6649.39 88.9 54 1.6
52 33.7 5411.67 6659.71 85.8 53 59.5
53 14.1 5281.86 6645.06 49.2 54 3.3
53 19.4 5257.84 6653.90 40.4 53 59.8
53 19.8 5262.27 6647.48 42.9 54 2.7
53 31.1 5211.77 6649.45 27.9 53 59.0
53 32.4 5205.10 6649.63 26.1 53 58.5
53 33.6 5208.04 6648.43 27.2 54 0.8
18.9 2 5 0.6 4954.33 6644.91 -933.9 1 49 26.7
TABLE 3 (cont.)
t_n z_n R_n t_0-t_n t_0
h m s km km s h m s
5 2.3 4948.46 6643.43 -934.6 49 27.7
5 29.7 4829.03 6636.74 -960.6 49 29.1
5 32.2 4813.30 6626.59 -959.6 49 32.6
5 34.1 4812.87 6640.79 -966.3 49 27.8
5 45.2 4760.84 6630.23 -973.6 49 31.6
6 5.7 4675.89 6636.61 -996.0 49 29.7
6 11.2 4657.66 6636.95 -1000.2 49 31.0
20.9 17 30 6.1 4926.57 6674.28 112.0 17 31 58.1
30 7.8 4930.97 6671.76 110.4 31 58.2
30 9.7 4938.37 6671.38 108.4 31 58.1
30 19.8 4982.93 6673.96 97.8 31 57.6
30 26.5 4989.78 6658.22 92.7 31 59.2
30 30.7 5031.35 6678.74 86.6 31 57.3
30 49.3 5095.04 6671.35 68.4 31 57.7
30 50.3 5096.26 6669.22 67.6 31 57.9
22.9 16 34 2.6 5477.57 6656.56 -48.7 16 33 13.9
34 3.8 5479.62 6655.14 -49.9 33 13.9
34 4.8 5482.16 6654.74 -50.8 33 14.0
34 5.8 5485.12 6654.91 -51.8 33 14.0
34 6.9 5487.38 6653.99 -52.5 33 14.4
34 7.9 5491.00 6654.71 -53.8 33 14.1
34 35.6 5568.86 6655.83 -81.3 33 14.3
34 36.8 5573.55 6657.15 -82.6 33 14.2
34 38.0 5578.89 6658.95 -84.1 33 13.9
18 3 29.6 5178.92 6668.67 45.1 18 4 14.7
4 2.9 5297.01 6667.70 11.1 4 14.0
4 30.5 5391.38 6668.67 -17.5 4 13.0
4 48.8 5442.07 6664.26 -34.9 4 13.9
4 52.0 5447.39 6664.68 -36.5 4 15.5
4 59.5 5471.38 6662.69 -45.0 4 14.5
5 4.6 5493.56 6666.04 -51.7 4 12.9
5 30.4 5542.81 6649.05 -73.7 4 16.7
23.9 18 21 34.1 5521.20 6642.81 -67.6 18 20 26.5
22 3.2 5574.84 6631.69 -90.5 20 32.7
22 29.5 5618.38 6620.82 -110.8 20 38.7
22 31.3 5700.50 6661.52 -132.1 20 19.2
22 32.5 5700.74 6660.27 -132.6 20 19.9
23 1.0 5823.06 6695.36 -177.3 20 3.7
24.9 18 38 2.4 5608.90 6655.49 -96.5 18 36 25.9
38 34.2 5677.66 6649.56 -126.2 36 28.0
25.9 17 23 1.7 5609.73 6656.91 -96.4 17 21 25.3
23 3.1 5612.12 6655.79 -97.7 21 25.4
23 17.9 5644.91 6650.97 -112.2 21 25.7
23 18.6 5644.74 6648.72 -112.8 21 25.8
23 19.0 5644.56 6647.10 -113.2 21 25.8
26.9 17 39 0.2 5618.85 6667.50 -96.8 17 37 23.4
40 2.3 5742.56 6651.61 -154.4 37 27.9
40 2.7 5742.10 6651.25 -154.3 37 28.4
40 3.1 5743.18 6651.82 -154.6 37 28.5
40 3.6 5746.71 6653.99 -155.5 37 28.1
27.9 16 25 3.7 5764.70 6657.87 -162.6 16 22 21.1
25 4.7 5765.68 6656.70 -163.5 22 21.2
25 5.7 5766.35 6655.23 -164.4 22 21.3
25 6.5 5767.83 6654.72 -165.3 22 21.2
25 32.9 5805.78 6647.18 -187.6 22 25.3
TABLE 3 (cont.)
tn z_n R_ t_0-t_n tv
h m s km km s h m s
25 33.2 5796.57 6640.98 -185.2 22 28.0
25 33.9 5796.86 6640.72 -185.5 22 28.4
25 35.0 5800.53 6642.86 -186.5 22 28.5
25 35.8 5798.89 6641.80 -186.1 22 29.7
25 36.9 5805.03 6645.17 -188.0 22 28.9
26 4.2 5858.08 6647.43 -217.2 22 27.0
26 5.1 5859.95 6648.00 -218.1 22 27.0
26 6.0 5860.88 6647.78 -218.8 22 27.2
26 6.9 5861.11 6646.86 -219.4 22 27.5
Different kinds of Delta values deduced from 31 passes by graphic or numerical
solution are given in Table 4. In the first column "O" means simply the mean of the t_0
values of Table 3, averaged for each revolution separately. In the second column the
root-mean-square error of (expressed in seconds) is given for all transits
which include a large enough number of observations. Its average value is 0.656.
Note: The epoch O = 496.259943 comes from two O values combined from two
consecutive transits, each containing one pair of simultaneous observations only.
The next table gives the period at the beginning and at the end of each
observation cycle, its mean value, the mean rate of decrease of the period during each
time interval, and its standard error. (As dP/dn changed suddenly on 26 August 1963,
the first cycle has been divided into two parts.) Then follows, as a comparison, |dP/dN|^*,
defined as the slope of a plot of
 against t at the cycles of observation.
Finally theoretical values of
 are given
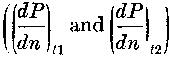 calculated
from the following equations
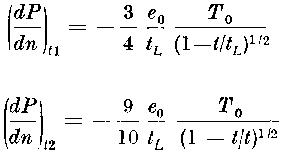 [11] where T_0 = 94.27 min., e_0 = 0.030 are initial orbital elements of the satellite,
TABLE 4
O sigma Weight (O-C)_n n(n-1) Delta_n (O-C)_m m(m-1) Delta_m
 JD 2438... sec day sec/rev day sec/rev sec/rev day
263.357229 +- - 1 - 0 - -.000292 4556 -.0111 -.0111
264.378929 .467 10 -.000012 240 -.0086 -.000161 2652 -.0105 -.0103
265.336725 .389 8 -.000071 930 -.0132 -.000086 1332 -.0112 -.0120
266.294488 - 0.5 -.000162 2070 -.0135 -.000044 462 -.0165 -.0140
266.358366 .309 5 -.000141 2162 -.0113 -.000014 420 -.0058 -.0104
267.316111 - 1 -.000251 3782 -.0115 +.000009 30 +.0518 -.0115
268.337696 .683 7 -.000004 110 -.0063 -.000177 3782 -.0081 -.0080
269.295416 1.320 5 -.000024 650 -.0064 -.000092 2256 -.0070 -.0069
269.359276 - 4 -.000014 702 -.0035 -.000075 2162 -.0060 -.0054
271.274631 .333 8 -.000159 3192 -.0086 -.000010 272 -.0063 -.0084
271.338481 - 3 -.000159 3306 -.0083 -.000003 240 -.0021 -.0079
272.296129 - -.000261 5256 -.0086 - 0 - -.0086
496.259943 - 1 - 0 - -.000168 2162 -.0134 -.0134
497.274926 .237 8 -.000019 240 -.0137 -.000069 930 -.0128 -.0130
498.289868 .186 8 -.000079 992 -.0138 -.000012 210 -.0099 -.0131
499.241334 - 3 -.000178 2162 -.0142 - 0 - -.0142
583.525747 .136 10 - 0 - -.000275 8556 -.0056 -.0056
585.488068 .276 8 -.000027 930 -.0050 -.000117 3782 -.0053 -.0053
586.437551 .194 9 -.000067 2070 -.0056 -.000068 2162 -.0054 -.0055
587.450319 .486 4 -.000123 3782 -.0056 -.000029 930 -.0054 -.0056
589.412511 .389 8 -.000279 8556 -.0056 - 0 - -.0056
656.576036 .582 3 - 0 - -.000781 22952 -.0059 -.0059
659.230532 .200 8 -.000068 1722 -.0068 -.000416 11990 -.0060 -.0061
661.189746 .197 9 -.000175 5256 -.0058 -.000203 6162 -.0057 -.0057
661.252945 .448 5 -.000180 5402 -.0058 -.000198 6006 -.0057 -.0057
662.264160 4.994 0.5 -.000227 8010 -.0049 -.000080 3782 -.0037 -.0045
663.275312 - 1 -.000338 11130 -.0053 -.000026 2070 -.0022 -.0048
664.223213 .105 5 -.000496 14520 -.0059 -.000029 930 -.0054 -.0059
665.234344 .971 4 -.000627 18632 -.0058 -.000005 210 -.0041 -.0058
666.182243 .865 3 -.000787 22952 -.0059 - 0 - -.0059
TABLE 5
Date P_0 day P_z
 dP/dn sigma (dP/dn)* (dP/dn)_t_1 (dP/dn)_t_2
day day day sec sec sec sec
Aug 1963 I. .0638570 .0638443 .0638506 -.0110 +-.0006 -.0101 -.0072 -.0084
Aug 1963 II. .0638570 .0638443 .0638506 -.00755 .00049 -.0101 -.0072 -.0084
Apr 1964 .0634376 .0634303 .0634340 -.0132 .0003 -.0092 -.0089 -.0103
Jun 1964 - - .0633376 - - - - -
Jul 1964 .0633015 .0632956 .0632986 -.00550 .00006 -.0075 -.0098 -.0113
Sep 1964 .0632039 .0631936 .0631987 -.00582 .00020 -.0068 -.0109 -.0126
TABLE 6
Date i e kappa phi_0 mu_0 U_s a h_ap h_per
min km km km
Aug 1963 64.94 .0173 1723.73 60.750 74.394 92.001 6750.80 490 256
Apr 1964 64.98 .0152 1721.87 49.662 57.264 91.401 6721.45 445 241
June 1964 64.98 .011 1721.34 - - 91.264 6714.70 411 263
July 1964 64.98 .011 1721.32 50.217 58.000 91.208 6711.96 408 260
Sept 1964 64.97 .0104 1720.85 53.131 61.996 91.064 6704.89 397 256
and t_L its total lifetime. Orbital elements in the predictions for March 1965,
using the inverse form of the equations quoted above, yielded lifetimes 1874 days and 1896
days respectively. (The actual lifetime of the satellite proved to be somewhat longer.)
Figures No 2-8 have been plotted to illustrate the graphic solution of the problem.
On Fig. No 2, 4, 5 and 7 deviations between observed and
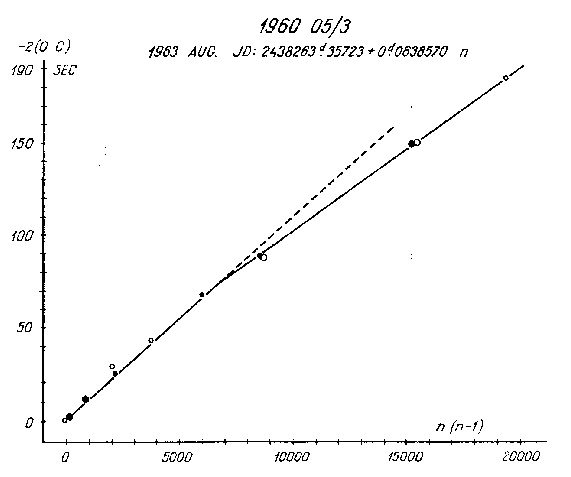 Fig. 2.
calculated transit times (O - C)_n are plotted against n(n - 1); the slope of each straight
line gives Delta_n. C_n values have been derived using the initial period of revolution
P_0 and the starting date O_0. Fig. 2 proves clearly the reality of the sudden change
which occurred on or about the 26 August. Dashed lines indicate (dP/dn)_t_1 and
(dP/dn)_t_2 respectively. (There is certainly a wide gap between the observed and the
theoratical values.) Weights of singular points are marked on each of the
figures by [big filled circle] [small filled circle] [big circle] [small circle]
(in decreasing order). Parameters of major importance for the computations are summarized
in the first columns of Table 6 (i, e kappa and phi_0 mu_0, latters representing the
reference latitude). Approximate orbital elements have been found in [12] and have been
corrected according to the method mentioned above.
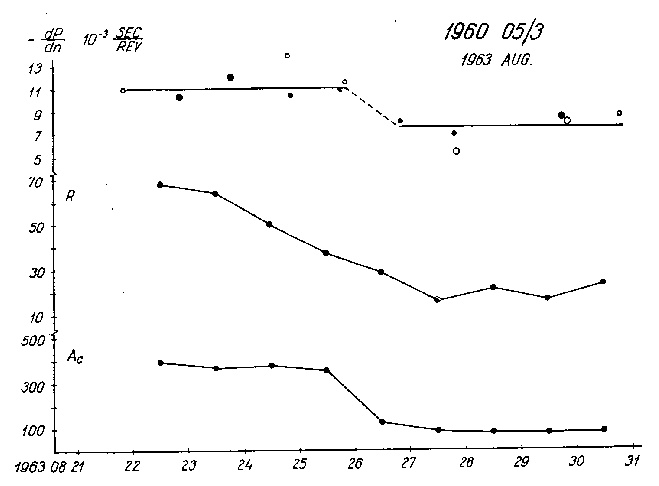 Fig. 3.
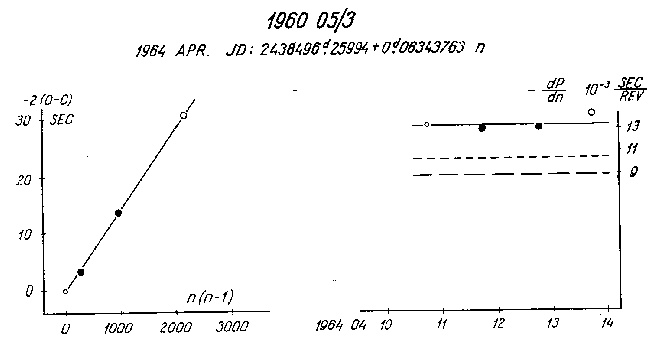 Fig. 4.
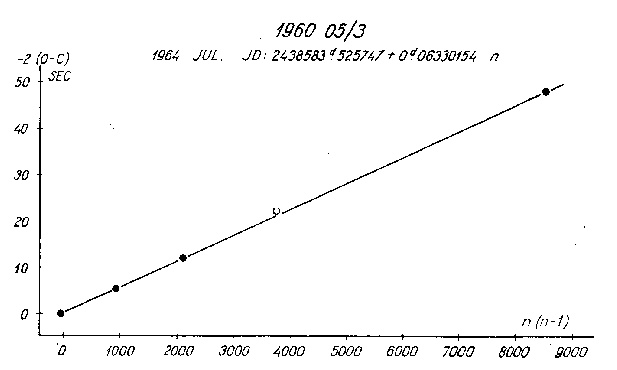 Fig. 5.
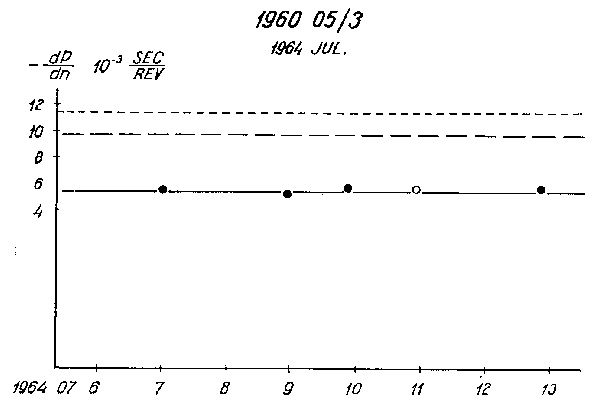 Fig. 6.
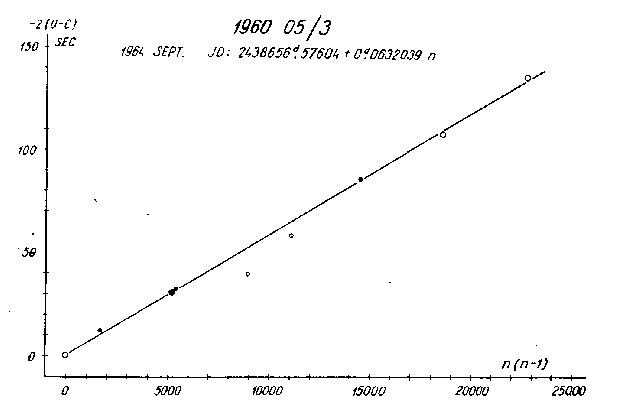 Fig. 7.
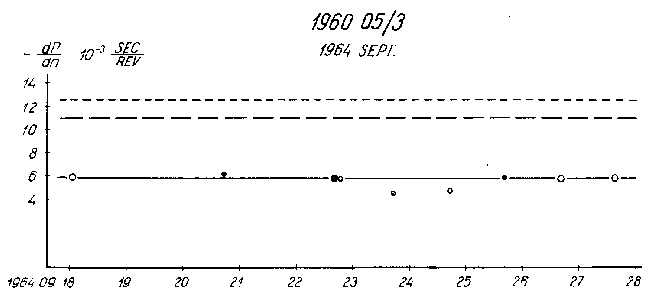 Fig. 8.
The last four columns give U_S (derived from ), a, and the values of h_ap and
h_per - being simple functions of a and e. The sidereal period of revolution can be
computed from
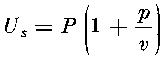 [6], where
 is the daily precession of the orbital plane,
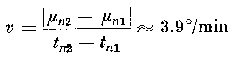 is the average angular velocity easily measurable on the observed path elements. The
sidereal period proved to be longer than the nodal one by 3-4 sec.
Consequently satellite accelerations as derived refer practically to a perigee
altitude of 255 km.
CONCLUSIONS
The Interobs program sets as an aim the investigation of sudden changes in the
upper atmosphere as revealed by satellite drag. Studying the observational data on
1960 epsilon3 (1960 05/3) we demonstrated the possibility of regarding dP/dn as constant
for time intervals of 8-10 days (at least during and about the minimum of solar activity)
and to derive its mean value with no more than 20% external relative error. Consequently
the density of the atmosphere near the perigee altitude of the satellite proved to be
constant during most of the time intervals under consideration. Nevertheless we did not
intend to determine it numerically for the following reasons: we did not succeed to derive
the argument of perigee (the observations covering only a small fraction of the whole orbit)
and also the effective cross-sectional area of the satellite is unknown. As the possibility
of a slow precessional motion of the axis of rotation of the satellite (with a period of
rotation of the order of weeks !) cannot be precluded [13], absolute measurements of air
density are hampered by the corresponding variations of the cross-sectional area of the
satellite at least if only one satellite is under observation.
Sudden variations, like the one shown on Fig. 2 and 3, however, cannot be regarded
as anything else but as the consequences of sudden changes in the density of the upper
atmosphere. Hence according to the changes of drag acting on 1960 epsilon3, air density
near its perigee altitude decreased by 31% on the 26^th August 1963. The change exceeds
six times the standard error of dP/dn for the preceding time interval.
It is natural to try to find a connection between this density decrease and
variations in the actual solar activity, because a strong correlation between certain
solar phenomena and the upper atmosphere is well known [14]. Exactly on the day mentioned
a larger sunspot group turned away to the farside of the Sun, and, as a result, the Wolf
(sunspot) number (R) dropped to about one half of its previous level. At the same time
according to Catanian measurements the spot area (A) decreased to less than one third [15].
The coincidence of the solar and upper atmospheric events is interesting (see Fig. 3).
Significant flares or distinctive events have not been observed during the time interval
under consideration.
In 1964 solar activity had reached its absolute minimum, the average sunspot number
being only 4 in April and July, 5 in September [15]. There were no visible spots on the Sun
during 7-12 July and 16-28 Sept; average sunspot numbers being as low as 7-8-9 in April.
It is by no means surprizing that the acceleration dP/dn proved to be constant during these
time intervals, and its absolute value in April 1964 was considerably larger than in July
or in September. The correlation "more intensive solar activity - more intensive drag"
approximately holds true, suggesting that with decrease in solar activity the upper atmosphere
becomes cooler and shrinks closer to the earth so that at a given geometric altitude the
density becomes less.
The comparison of dP/dn values obtained for different time intervals demands,
however, a lot of precaution because of the shift of the perigee and changes of the
effective cross-sectional area as mentioned above. The general tendency - i.e. that a
cceleration contrary to all expectations is a decreasing function of time - has been
proved by the convex shape (as seen from below) of the
 plot independently.
From the graphically derived slopes of the curve at different points we find
|dP/dn|^* decreasing as well (seeTable 5); even the arithmetical means of
the (dp/dn)^* and dP/dn values derived during the four time intervals under consideration
are practically equal (-0.00839 and -0.00861 s/rev respectively). Accordingly our results
suggest that during 1963/64 air density around the altitude 250-260 km decreased - parallel
with solar activity - to such an extent that the drag encountered by satellite 1960 epsilon3
did not show a rising but a falling tendency considerably prolonging the lifetime of the
satellite. It would be an interesting task to determine whether similar effects occurred in
the motion of other satellites at the same time; unfortunately the Interobs material
available did not allow such an investigation.
Studying all observations of 1960 epsilon3 in 1963/64 it could be ascertained
that in time intervals when at least 3 transits have been well observed (simultaneously
from two stations), the rate of change of the period of revolution, if constant, can be
determined with an error not exceeding 10-15%. Supposing that sudden variations occur in
air density which has an effect on dP/dn larger than this value, the date of change can be
computed with an accuracy of possibly less than one day (in a fortunate case) or at least
1-2 days. Such time resolution is of interest when investigating the time delay of the
influence of certain solar phenomena upon the upper atmosphere. It seems useful to extend
the Interobs program in order to obtain material rich enough to set up actual correlations.
Konkoly Observatory, Budapest, September 1965.
APPENDIX
PROGRAM FOR ELLIOTT 803 COMPUTER TO CALCULATE THE
SATELLITE'S POSITION IN SPACE FROM SIMULTANEOUS
OBSERVATIONS
This program forms only the first part of a larger one to evaluate orbital elements
directly from simultaneous observations (see [9]). The output of some data in excess is
needed for the second part.
Input data
No. 1. number of tracking stations (less than 40);
No. 2. coordinates of tracking stations in a rectangular and in a geographic system:
 No. 3. number of days when observations have been performed (less than 200);
No. 4. hours, minutes and seconds of Greenwich sidereal time at 0^h GMT of days when
observations have been performed;
No. 5. A_1 and A_2 (Parameters in
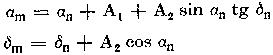 where m is the year of observation,
n is the epoch of the catalogue or atlas);
No. 6. year, month, day and hour (integer numbers) of the first transit;
No. 7. identification number of the satellite (integer of maximum 5 figures);
No. 8. observing data: weight, time (h, m, s), identification number of the coordinate
system (1 means equatorial, 2 means horizontal), right ascension or azimuth (h, m, s
or °, ', ") declination or elevation (°,') serial number of the tracking station
according to No. 2, and serial number of the day according to No. 4. N.B. Maximum
number of simultaneity groups (points in space) on each transit is 100. More than
one observation from the same tracking station cannot be used in one simultaneity
group.
Arriving to the next transit write all input data (No. 8) of the first observation,
then 38( 40( and the time of the new transit as in No. 6. In the case of a new
satellite add 39( and the identification number of the satellite as in No. 7. After
the very last observation add 12 zeros and 38( 34( ).
Output
Every transit is printed out as a separate group. The first line gives: 1. the
identification number of the satellite, 2. year, month, day and hour of the transit.
Line No. 2: time (in degrees) and Theta (in degrees, see [9])of the first real observation;
Line No. 3:
 for the given transit. Spatial coordinates
are tabulated below as follows:
 where n_i is the number of all possible pairs in the simultaneity group when determining
the satellite's position in space. The sign 5( at the end of every transit belongs to
Part II. of the program.
After the last transit all observations neglected during the calculation are
printed out using the following code:
Starting from horizontal coordinates
 starting from equatorial coordinates
 Numbers after these six-figure symbols give the serial number of the observation under
consideration.
Further, whilst determining a position in space, those pairs of observations are
not used where
 these are indicated by the symbol 666666 and k and l are printed out afterwards.
SETS LIHJUVKQWCD(2002)E(4) VARY I=1:1:9
SETV P(240)A(205)B(23)S(160)G(10) READ B(I)
N(11)Z(400) REPEAT I
SETF TRIG ARCTAN SQRT READ Q
SETR 40 READ W
JUMP IF J=1TO20
1) READ L JUMP UNLESS B3=B13TO3
VARY I=I : 1 : L JUMP UNLESS B2=B12TO3
VARY H=0 : 40: 6 JUMP UNLESS B1=B11TO3
READ P(I+H) JUMP TO5
REPEAT H 20) B11=B1
REPEAT I B12=B2
READ L B13=B3
VARY I=1 :1:L B3=.01666666 * B3
READ A(I) B2=B2+B3
READ A(I+1) B2=.01666666 * B2
READ A(I+2) B1=B1+B2
A(1+2)=.01666666 * A(I+2) B20=15*B1
A(I+1)=A(I+2)+A(I+1) B1=1.00273791 * B20
A(I+1)=.01666666 * A(I+1) B14=B1+A(W)
A(I)=A(I)+A(I+1) 23) JUMP UNLESS B14> 360TO4
A(I)=15 * A(I) B14=B14-360
REPEAT I JUMP TO23
READ G9 4) B1=B14/180
READ G10 B15=SIN B1
N1=0 B16=COS B1
N4=0 5) B1=P(Q) * B16
N8=0 B2=P(Q+40) * B15
VARY I=I :1:4 S(J+4)=B1-B2
READ EI B1=P(Q) * B15
REPEAT I B2=P(Q+40) * B16
2) READ V S(J+5)=B1+B2
C=1001 S(J+6)=P(Q+80)
H=0 JUMP IF B4=1TO16
21) D2001=0 JUMP IF B8>60TO10
J=1 JUMP IF B8> 30TO9
U=0 JUMP IF B8>20TO8
22) READ S(J) JUMP IF B8> 15TO7
JUMP IF B8> 12TO6 12) B1=B14-B7
B9=B9-5 B1=B1-P(Q+120)
JUMP TO10 26) JUMP IF B1 <0TO14
6) B9=B9-4 13) JUMP IF B1 < 360TO15
JUMP TO10 B1=B1-360
7) B9=B9-3 JUMP TO13
JUMP TO10 14) B1=B1+360
8) B9=B9-2 JUMP TO26
JUMP TO10 15) 131=131/180
9) B9=B9-1 B2=SIN B1
10) B7=.01666666 * B7 B3=MOD B2
B6=B7+B6 JUMP UNLESS B3>.99996TO27
B6=.01666666 * B6 D(C)=333333
B5=B5+B6 C=C+1
B9=.01666666 * B9 U=U+1
B8=B9+BS D(C)=U
B5=B5/180 C=C+1
B6=COS B5 JUMP IF C> 1997TO34
B5=SIN B5 JUMP TO22
B8=B8/180 27) B1=COS B1
B9=COS B8 S(J+1)=B2/B1
B8=SIN B8 S(J+7) =8 (J+4)*(J+1)
B1=P(Q+160) * B8 S(J+2)=1/B1
B2=P(Q+200) * B9 JUMP TO19
B2=B2*B6 16) B7=.01666666*B7
B1=B1+B2 B6=B6+B7
JUMP UNLESS B1 > .999TO24 B6=.01666666*B6
D(C)=111111 B5=B5+B6
C=C+1 B5=15*B5
U=U+1 B9=.01666666*B9
D(C)=U B8=B8+B9
C=C+1 B7=B5/180
JUMP IF C> 1997TO34 B6=COS B7
JUMP TO22 B7=SIN B7
24) B2=B1*B1 B7=G10*B7
B2=1-B2 B6=G10*B6
B2=SQRT B2 B9=B8/180
S(J+3)=B1/B2 B9=TAN B9
B3=-B9*B5 B7=B7*B9
B2=B3/B2 B7=B7+G9
B3=MOD B2 B5=B5+B7
JUMP UNLESS B3>.99996TO25 B8=B8+B6
D(C)=222222 JUMP IF BS < 90TO17
C=C+1 B8=180-B8
U=U+1 B5= B5+ 180
D(C)=U 17) JUMP UNLESS B8>87.5TO28
C=C+1 D(C)=444444
JUMP IF C> 1997TO34 C=C+1
JUMP TO22 U=U+1
25) B3=P(Q+160) * B1 D(C)=U
B3=B8-B3 C=C+1
B7=B2*B2 JUMP IF C> 1997TO34
B7=1-B7 JUMP TO 22
B7=SQRT B7 28) JUMP UNLESS B5<0TO29
B7=B2/B7 B5=360+B5
B7=ARCTAN B7 JUMP TO28
B7=180 * B7 29) JUMP IF B5 < 360TO18
JUMP IF B2 > 0TO11 B5=B5-360
JUMP IF B3> 0TO 12 JUMP TO29
B7=-180-B7 18) 138=138/180
JUMP TO12 S(J+3)=TAN B8
11) JUMP IF B3 > 0TO 12 B5=B5/180
B7=180-B7 B2=SIN B5
B8=MOD B2 G2=G2+S(K+6)
JUMP UNLESS B8>.99996TO30 G4=8(K)*G2
D(C)=555555 N3=N3+G4
C=C+1 G1=G1-S(L+4)
U=U+1 G1=G1*S(L+3)
D(C)=U G1=G1*S(L+2)
C=C+1 G1=S(L+6)+G1
JUMP IF C> 1997TO34 G1=G1*S(L)
JUMP TO 22 N3=N3+G1
30) 135=COS B5 I=I+1
S(J+1)=B2/B5 35) L=L+8
S(J+7)=S(J+4)*S(J+1) JUMP IF L <JTO31
S(J+2)=1/B5 33) K=K+8
19) U=U+1 L=K+8
D2001=D2001+ 1 JUMP IF L < JTO31
JUMP UNLESS D2001=1TO37 D(H)=I
B22=1320 Z(4H+1)=N7/N5
B23=1314 Z(4H+2)=N2/N5
37) J=J+8 Z(4H+3)=N3/N6
JUMP TO22 B17=Z(4H+1)*Z(4H+1)
3) I=0 N1=N1+B17
N2=0 B18=Z(4H+2)*Z(4H+2)
N3=0 N4=N4+B18
N5=0 B19=Z(4H+3)*Z(4H+3)
N6=0 N8=N8+B19
N7=0 B17=B17+B18
K=1 B17=B17+B19
L=K+8 Z(4H+4)=SQRT B17
31) G7=8(K)*S(L) H=H+1
N5=N5+G7 S1=S J
G8=S(K)+S(L) J=1
N6=N6+G8 JUMP TO20
G1=S(L+5)-S(K+5) 38) LINE
G1=G1-S(L+7) PRINT V,5
G1=G1+S(K+7) SPACES 5
G2=S(K+ 1)-S(L+ 1) PRINT E1,4
G6=MOD G2 PRINT E2,2
JUMP UNLESS G6<.1TO32 PRINT E3,2
D(C)=666666 PRINT E4,2
C=C+1 LINE
D(C)=K PRINT B22
C=C+1 PRINT B23
D(C)=L LINE
C=C+1 PRINT N1
JUMP UNLESS C > 1997TO35 PRINT N4
LINE PRINT N8
D2002 =C-1001 LINE
VARY C=1001 : 1 : D2002 VARY I=0 : 1 : H
PRINT D(C) VARY K=1 : 1 : 4
LINE PRINT Z(4I+K)
REPEAT C REPEAT K
C=1001 PRINT DI
JUMP TO35 LINE
32) G1=G1/G2 REPEAT T
G6=G1*G7 OUTPUT 21
N7=N7+G6 OUTPUT 17
G2=G1-S(K+4) N1=0
G3=G2*S(K+1) N4=0
G3=S(K+5)+G3 N8=0
G5=G3*G7 D2001=0
N2=N2+G5 H=0
G2=G2*S(K+3) JUMP TO22
G2=G2*S(K+2) 34) C=C-1
LINES 3 JUMP TO22
CYCLE K=1001 : 1: C 40) VARY I=1 : 1: 4
PRINT DK,6 READ EI
LINE REPEAT I
REPEAT K JUMP TO22
C=1001 36) STOP
JUMP TO22 START 1
39) READ V
REFERENCES
[1] D. G. King-Hele and D. M. C. Walker: Space Research 2, p. 918, 1961.
D. G. King-Hele: JBIS 19, p. 374, 1964.
R. H. Merson and A. T. Sinclair: RAE Technical Rep. No 64036, 1964.
M. Ill: Nabljudenija ISZ 3, 1964.
M. J. Marov: Kosmiceskie issledovania Vip 6 1964.
[2] e.g. H. F. Michielson: PhS and E 6 No 6 1962.
[3] Z. Ceplecha: BAC 10 41 1958.
C. Popovici: Nabljudenija ISZ 1 33 1962.
[4] D. E. Segolev Nabljudenija ISZ 1 40 1962.
[5] G. Veis: SAO Sp. Rep. No 133 1962.
[6] M. Ill: Baja Mitt. No. 1 1962.
[7] Ergebnisse der im Rahmen des Interobs-Programms abgehaltenen Kooperationswochen
1, 2, 1964, 1965.
[8] J. Bienewski: Biuletyn polskich ... 8 58 1963.
W. Baran: Artificial Earth Satellites. Observations and Investigations in Poland
105 1965.
I. Almár and M. Ill: Nabljudenija ISZ 1 46 1962.
[9] E. Illés and I. Almár: Nabljudenij ISZ 3 1964.
[10] G. A. Ustinov: Nabljudenija ISZ 2 19 1963
[11] e.g. D. G. King-Hele: Progress in the Astronautical Sciences 1 1962. (The same
equation used with two different coefficients.)
[12] G. A. Cebotarev - E. N. Makarova: Bjulleteni stancii ... No 40 34 1964.
[13] L. G. Jacchia: Smithsonian Astrophysical Observatory 1962 Dez 31.
[14] e.g. H. K. Paetzold and H. Zschörner: Space Research 1 p. 28 1960.
N. L. Slovohotova: Nabljudenia Isz 2 3 1963.
[15] Quarterly Bulletin on Solar Activity, Eidgen Sternwarte Zürich
Solnecnije dannie
ERRATA
In Mitteilunlgen der Sternwarte der Ungarischen Akademie der
Wissenschaften Nr. 59
p. 9 last two equations read