Non-Periodic Phenomena in Variable Stars
IAU Colloquium, Budapest 1968
THE EVIDENCE FOR VARIABLE INFALL OF MATERIAL IN THE
ULTRAVIOLET EXCESS STARS*
MERLE F. WALKER
Lick Observatory, University of California+
In a previous paper (Walker 1966), the results of the writer's
spectroscopic study of the UV excess stars in the Orion Nebula and in
NGC 2264 were outlined. These stars form a subgroup of the T Tau class
of variables and like the T Tau stars are extremely young objects still
in the process of contracting gravitationally from the pre-stellar
medium. Apart from the UV excess itself, the spectra of the UV excess
stars are similar to those of normal T Tau variables, having emission
lines of hydrogen, Ca II, and sometimes helium, Fe I, and an underlying
late-type absorption spectrum which is partially totally obscured by a
blue continuum. However, unlike the regular T Tau variables which
occasionally display a P Cyg spectrum with violet-displaced absorption
lines, 10 out of a sample of 23 UV excess stars showed, at least at
times, an inverse P Cyg or "YY Ori" spectrum. In these objects, the
emission lines tend to have approximately the radial velocity of the
cluster, while redward-displaced absorption lines of hydrogen and
sometimes Ca II are observed having radial velocities of 150 to 400
km/sec more positive than the cluster velocity. Explanation in terms of
binary motion appears ruled out by the fact that except for observations
of YY Ori on two dates, the absorption lines are always displaced to the
red. Thus, it has been assumed that whereas the P Cyg spectrum in
regular T Tau stars indicates ejection of material from the star, the
inverse P Cyg spectrum in the UV excess stars indicates actual infall of
material.
* Contributions from the Lick Observatory, No. 292
+ On leave, during 1968-1969, at Cerro Tololo Inter-American
Observatory, La Serena, Chile.
The fact that the inverse P Cyg spectrum is observed only among the UV
excess stars suggests that the UV excess itself results in some way from
the infall, while the fact that the phenomenon tends to occur among the
intrinsically brighter UV excess stars suggests that the interaction of
the infalling material with the star causes the system to brighten, the
stars with the larger amounts of infalling material being affected the
most. If this interpretation is correct, then we might expect that if
the rate of infall is variable, a correlation ought to exist between the
brightness of the star and the intensity of the inverse P Cyg absorptions.
To investigate this question, spectra were obtained of SU Ori, one of the
more rapid light-variables among the UV excess stars showing the inverse
P Cyg lines. Table 1 lists the spectroscopic and photometric observations of
this star. The spectra were obtained with the prime-focus spectrograph of
the 120-inch reflector and a grating and camera giving a dispersion of 96 A/mm.
The spectrum was recorded on baked Kodak IIaO plates or film. The photometric
observations were derived from photovisual plates taken simultaneously by
the observer at the 20-inch Carnegie astrograph, or by Mr. Harlan using
a yellow-corrected aerial camera lens. The magnitudes of the variable were
obtained by measuring the plates in a Sartorius photometer, using as standards
stars in the region for which photoelectric observations were available
(Walker 1968).
Table 1
Spectroscopic and Photometric Observations of SU Ori
V_r
Plate No. Date (UT) Exp. (km/sec) V
(min) (mag)
em. abs.
ES-384 Jan. 27, 1963 165 -40 +- 8 +332 +-14 14.5
ES-926 Nov. 30, 1964 206 + 3 +- 2 ---^1 15.3
ES-936* Jan. 27, 1965 107 + 1 +-13 --- 15.3
ES-950 Jan. 30, 1965 330 +53 +- 3 ---^1 15.0
ES-953 Jan. 31, 1965 285 +39 +- 5 +382 +-11 14.5-15.0
ES-1206 Jan. 19, 1966 257 +17 +- 7 ---^1 15.6
* Plate underexposed, only emission lines visible. Omitted from Figure 1.
^1 Absorption spectrum absent.
The five best spectra are reproduced in Figure 1, where they are arranged
in order of decreasing brightness. The observations show that there is indeed
a correlation between the brightness of the star and the presence and intensity
of the redward-displaced absorption lines. A similar result is suggested by
the existing observations of XX Ori, listed in Table 2. The data for this star
are less satisfactory since only three plates are available and since
the photometric observations consist merely of relatively crude visual
estimates at the telescope, comparing the variable to other stars in the field.
Nevertheless, it again appears that the inverse P Cyg spectrum disappears
when the star becomes faint. Thus, the observations appear to confirm
the hypothesis that material is falling into these stars at a variable rate
and that an increase in infall causes the system to brighten.
Table 2
Spectroscopic and Photometric Observations of XX Ori
V_r
Plate No. Date (UT) Exp. (km/sec) V
(min) (mag)
em. abs.
ECL-218* Nov. 21, 1962 120 +50 +- 5 ---^1 14.6
ES-312 Nov. 22, 1962 124 +20 +- 6 +333 +-9 14.6
ES-402 Feb. 27, 1963 127 - 6 +- 3 ---^2 15.1
* Plate taken with Lallemand electronic camera and coudé spectrograph;
dispersion 48 A/mm.
^1 Absorption spectrum present, but too weak to measure.
^2 Absorption spectrum absent.
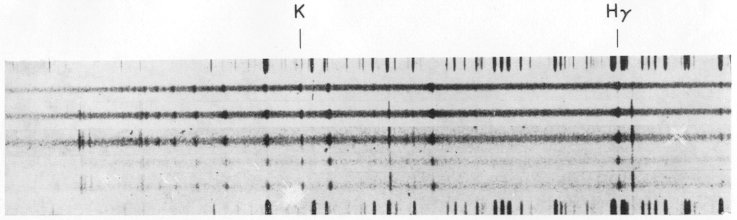 Fig. 1. Spectra of SU Ori showing disappearance of the redward-displaced
absorption lines of hydrogen and ionized calcium with decreasing
brightness of the star. From top to bottom the plates and magnitudes
are: ES-384, V = 14.5; ES-953, V = 14.5-15.0; ES-950, V = 15.0;
ES-926, V = 15.3; ES-1206, V = 15.6.
That complications to this simple picture exist is shown by the radial
velocity measurements. The large negative radial velocity of the emission
lines of SU Ori on plate ES-384, when the "YY Ori" lines are strong, might be
explained by encroachment of the absorption lines onto the red side of the
emission features. However, Table 1 shows that considerable variation of the
emission lines occurs which is not correlated with the brightness of the star
or the intensity of the inverse P Cyg lines.
The nature of these stars is clearly very complex, and their observation
is difficult owing both to their faintness (the brightest of them is about
B = 14) and to the irregular nature of their variations; Table 1 shows that
observations of SU Ori had to be continued over three observing seasons
before plates covering a large range in magnitude could be obtained. Thus, a
long period of study with large telescopes will be required before we will
possess the necessary observational data for an understanding of this very
interesting stage in the gravitational contraction phase of stellar evolution.
REFERENCES
Walker, M. F., 1966, Stellar Evolution. Ed. Cameron, A. G. W., and Stein, R. F.,
New York: Plenum Press, p. 405.
Walker, M. F., 1968, Astrophys. J., (in press). 155, 447
Fig. 1. Spectra of SU Ori showing disappearance of the redward-displaced
absorption lines of hydrogen and ionized calcium with decreasing
brightness of the star. From top to bottom the plates and magnitudes
are: ES-384, V = 14.5; ES-953, V = 14.5-15.0; ES-950, V = 15.0;
ES-926, V = 15.3; ES-1206, V = 15.6.
That complications to this simple picture exist is shown by the radial
velocity measurements. The large negative radial velocity of the emission
lines of SU Ori on plate ES-384, when the "YY Ori" lines are strong, might be
explained by encroachment of the absorption lines onto the red side of the
emission features. However, Table 1 shows that considerable variation of the
emission lines occurs which is not correlated with the brightness of the star
or the intensity of the inverse P Cyg lines.
The nature of these stars is clearly very complex, and their observation
is difficult owing both to their faintness (the brightest of them is about
B = 14) and to the irregular nature of their variations; Table 1 shows that
observations of SU Ori had to be continued over three observing seasons
before plates covering a large range in magnitude could be obtained. Thus, a
long period of study with large telescopes will be required before we will
possess the necessary observational data for an understanding of this very
interesting stage in the gravitational contraction phase of stellar evolution.
REFERENCES
Walker, M. F., 1966, Stellar Evolution. Ed. Cameron, A. G. W., and Stein, R. F.,
New York: Plenum Press, p. 405.
Walker, M. F., 1968, Astrophys. J., (in press). 155, 447