Non-Periodic Phenomena in Variable Stars
IAU Colloquium, Budapest, 1968
FLARES OF UV CETI TYPE STARS
Introductory Paper by
R. E. GERSHBERG
Crimean Astrophysical Observatory, USSR
The term "flare stars" is used sometimes as a synonym to "eruptive
stars" and in that case the term "flare" covers a wide range of
phenomena of stellar variability. I intend to give a review of
observational and theoretical results bearing on the classical flare
stars of UV Ceti type only and I shall use the words "flare" and
"flare stars" only in that limited sense. Owing to the restricted time,
I have no possibility to give the detailed history of the investigations
of the UV Ceti type stars. This history can be found in Joy's (1960),
Oskanjan's (1964) and Haro's (1968) reviews - therefore I shall submit
the state of the problem only for the present moment. That is why I
shall not refer to a number of investigations which were important for
their times but were surpassed by following studies.
The dMe-objects with quick flares of brightness are attributed to
classical flare stars of UV Ceti type. Today no spectral or photometric
criteria are known which would permit to establish the relation of a dMe
to the UV Ceti type by observing it in a quiet state. About 25 UV Ceti
type stars are at present known, and they make nearly a quarter of the
known dMe stars and about 5 per cent of all the dM objects; because M
dwarfs represent to about 80% per cent of galactic stellar population,
one may suppose that the flares of UV Ceti-type stars are the most
wide-spread kind of stellar variability.
Among the 25 UV Ceti type stars 19 are known as binaries. 3 of them are
spectroscopic binaries, 2 of them have distances less than 1" between
the components; in the other 14 visual binaries the fainter components
are flare stars. The masses of flare stars are small: the mass of UV Cet
itself is equal to 0.04M sun, that is less than a minimum mass of a main
sequence star; the mass of EQ Peg is equal to 0.13M sun, and that of DO Cep
to 0.16M sun (Petit, 1961). The diameters of flare stars are about 3 times
less than that of the Sun (Lippincott, 1953). The luminosities of these
objects are low, and the absolutely faintest star, van Biesbroeck's object,
BD +4 4048 B, M_v = 18.6m, is a flare star. But we are not certain
that there exist systematic differences in masses, sizes, luminosities
and percentage of binaries between flare and normal M-dwarfs. The
dispersion of the peculiar velocities of dMe and UV Ceti type stars is
2-2.5 times less than that of normal dM stars (Gliese, 1958).
After giving this short stellar statistical characterization of UV Ceti
type stars, we may pass to discuss the flares themselves.
OBSERVATIONS
In accordance with the topic of our Colloquium it is necessary to begin
with the time features of flares.
Time distribution of flares
For nearly 20 years there had been a belief that the flares of UV Ceti
type stars occurred irregularly. But Andrews (1968) found some recurrence
in the time distribution of 9 flares of YZ CMi: 2 intervals between flares were
near to 122h, 3 near to 73h and 3 near to 47h; later Andrews found the same
effect with a characteristic interval near 48h for flares of V 1216 Sgr.
A closeness of all these quasiperiods to values wick are divisible by 24h
supposes a possible effect of observational selection.
The most detailed consideration of a possible periodicity of flares has
been carried out by Chugainov: he has studied the time distribution of
28 flares which, were registered during a cooperative observation of UV
Cet organized by Lovell at several observatories. Chugainov has found as
the best periodic representation of maximum flare moments:
T_max = const + 0.1821d X E.
11 periods of this cycle are equal to 48.1h. But the deviations, O-C,
are large: mean(O-C) = 43m and (O-C)_max = 99m. The registered flares have
occurred not in all, but only in 70 per cent of "critical moments"; but
that is not a contradiction to the hypothesis of periodicity of flares:
the remaining 30 per cent of flares could have small amplitudes or occurred
on the opposite side of the star. The arguments against the periodicity
hypothesis are the large mean(O-C), a value which is close to 1/6 of the period
proposed, and a possibility to represent the observable time distribution of
flares as a Poisson distribution. This year the Working Group on Flare Stars
organized several cooperative observations of UV Ceti type stars with attemps
to realize a 24^h photometric patrol. We hope to receive an important
information on the time-distribution of flares from these observations,
but their discussions have not yet been finished.
Nearly 15 years ago Oskanjan (1964) has found variations of the flare activity
level of UV Cet from season to season. A list of photoelectric observations of
this star made by the end of 1967 is given in Table 1 (Gershberg and Chugainov, 1968).
It is seen that the mean monitoring time per flare spent by different observers
varies from 4.1h to 47h. But this table does not permit to reach a final
conclusion: first, using different telescopes and different spectral bands we
have different thresholds of flare detection; second, it is not clear whether
a mean monitoring time per flare can characterize a flare activity level.
In order to clear up these points, let us consider Chugainov's, observations
of UV Ceti which were carried out for 4 years with the same instrumental and
photometric system. Three different criteria of the flare activity level are
given in Table 2: the mean monitoring time per flare, the mean radiative energy
of a flare and the ratio of the radiative energy of flares to the radiative
energy of the star calculated by integrations over the monitoring time. These
data show the reality of the flare activity level variations and detect some
correlation between different criteria of this level.
Table 1.
List of photoelectric observations of UV Ceti
Total Mean
Spectral monitoring Number monitoring
Observer Season Telescope region time of flares time per flare
(hours) registered (hours)
Roques 1952 12" refractor without 94 2 47
filter
Chugainov 1963 64 cm meniscus V 25 3 8.4
Chugainov 1964 telescope V 47 4 12
Chugainov 1965 V 70 17 4.1
Chugainov 1966 70 cm reflector H_beta 49 12 4.1
Eksteen 1966 16" reflector V 24 3 8.0
Chugainov 1967 64 cm meniscus V 35 8 4.4
telescope
Table 2.
Different criteria of the flare activity level of UV Ceti
Ratio of radiative
Number of flares Mean monitoring Mean radiative flare energy in
Season registered time per flare energy of flare V-region to the stellar
(hours) in V-region (ergs) radiation in V during
monitoring
1963 3 8.4 9.3 X 10^30 0.0060
1964 4 12 3.2 X 10^30 0.0014
1965 17 4.1 9.0 X 10^30 0.012
1967 8 4.4 8.3 X 10^30 0.012
Before finishing the discussion of time characteristics of UV Ceti type
star flares and going to photometric characteristics, it is necessary to
note, that observations carried out by different instrumental methods
give us results which are difficult to compare. As seen from Table 3,
even experienced visual observers overestimate systematically the
amplitudes of flares registered and miss small flares. On the other
hand, observations in UV region have a threshold of flare detection
three times lower than those in blue and 9 times lower than those in
visual region (Kunkel, 1967). This point complicates the statistical
discussion of flare features.
Table 3.
Comparison of the results of simultaneous visual (Odessa)
and photoelectric (Crimea) monitoring of the brightness of UV Ceti
Date U. T. M_vis m_v
19.9.65 21h 03m 0.9
20.9. 00 18 2.1 1.0
00 52 0.35
22.9. 22 59 0.4
23.9 23 46 1.1 0.65
24.9 00 32 2.9 1.9
26.9 00 47 4.0 >=1.5
28.9 00 11 0.4
21 09 2.1 1.15
1.10. 21 12 2.3 1.4
2.10. 21 57 0.4
23 54 4.2 1.7
Table 4.
Comparison of the observed and calculated Balmer decrements according to Kunkel
(1967)
The observations of EV Lac flare on 11.12.1965
U. T. H_beta H_gamma H_delta H_zeta H_eta H_10 H_11
3h 55m 1.0 1.24 1.48 1.22 1.17 0.94 0.80
4 00 1.0 1.04 1.16 0.92 0.63 0.64 0.47
4 03 1.10 1.28 1.10 0.90 0.67 0.59
4 08 1.0 1.13 1.06 0.76 0.54 0.52 0.38
4 56 1.0 1.15 0.90
Photometric characteristics and energetics of flares
Light curves of UV Ceti type star flares are very asymmetrical: as a
rule, after a very quick increase of brightness there is a sharp,
momentary maximum which is followed by a smoother decay (see Figs. 4 and 6).
According to statistics (Gershberg and Chugainov, 1968) which is based on
the discussion of about 100 photoelectric light curves, the time of flare
growth is 10 to 30 sec for the half of the flares and 3 to 100 sec for 90 per
cent of the flares. The time of photometric decay of flares is 10 to 100 times
as large as that of flare growth, but, as a rule, the rate of increase of
energy output just before the maximum is only 2 to 3 times as large as
the rate of decrease of energy output immediately after the maximum.
Then the flare decay slows down and such details as secondary maxima and steps
of constant brightness appear on the light curve. Strong secondary maxima
occur usually 5-10 min later than the main maximum and the light curve
of secondary maximum is more symmetrical; this photometric feature can be
regarded as a criterion to distinguish two close flares from a flare with
a secondary maximum. As a rule, on the ascending branch of the light
curve - in contrast to the descending branch - no deviations from a monotone
growth of brightness are seen. Often, but not always, a slow brightening
appears some minutes before the sharp beginning of the flare and the amplitude
of such a slow brightening amounts to several tenths of a stellar magnitude.
Flares of UV Ceti type stars are known with amplitudes up to 3-4 magn.
Of course, the lower limit of flare amplitudes is determined with the precision
of photometric observations. The behavior of UV Ceti type stars outside the
flares is not clear up to now; the observers, who were monitoring the brightness
of these stars visually and photographically, sometimes noted small and slow
variations of brightness with amplitudes up to 0.3-0.5 magn. and with
a characteristic time close to half an hour; but such secondary brightness
variations were not confirmed by special photoelectric observations.
According to Gershberg and Chugainov (1968) and Kunkel (1967) the total
radiation of flares of the most active UV Ceti type stars amounts to 0.1-1 per
cent of the energy of the radiation of these stars outside the flares.
For the best studied 4 flare stars the distributions of flares according to
their energy of radiation (L) are given in Fig. 1. One sees that the total
energy of flare radiation in blue region amounts to 3 X 10^(31+-2) ergs and more
than half of the flares radiate 10^(31+-1) ergs. Fig. 1 permits to conclude that
an absolutely brighter star shows stronger flares on the average and certainly
this conclusion can not be due to the observational selection effect.
For the same 4 stars the distributions of flares according to their absolute
rates of increase of energy output before maximum (dl/dt) are given in Fig. 2.
In all investigated cases these rates were within the limits 10^27 and
3 X 10^28 ergs/sec^2. The narrowness of these histograms should be noted, they
are 2-3 times narrower than the previous ones. It is suspected that the brighter
the star is, the slower are the flares on an average, but we did not find any
correlation between the total radiative energy of individual flares and their
rate of increase.
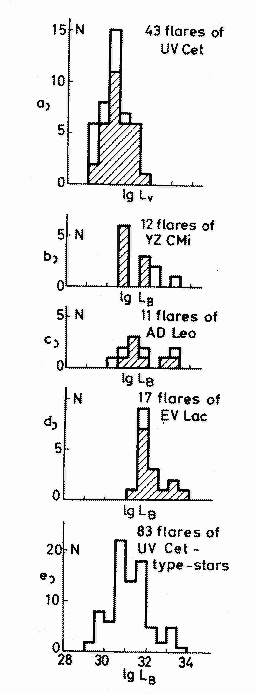 Fig. 1. Flare distributions according to their total radiative energy for
4 UV Ceti stars. Non-dashed districts are less certain data.
Fig. 1. Flare distributions according to their total radiative energy for
4 UV Ceti stars. Non-dashed districts are less certain data.
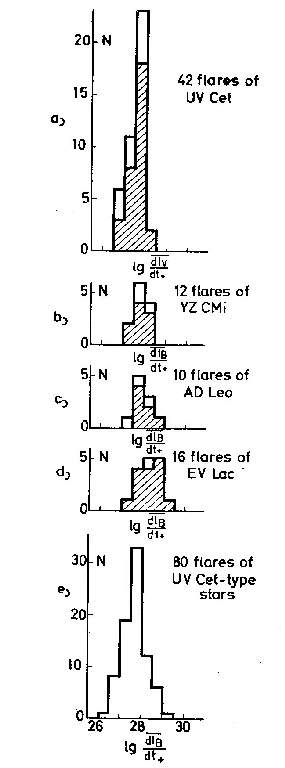 Fig. 2. Flare distributions according to their absolute rates of energy output
increase before maximum for 4 UV Cet stars. Non-dashed districts are
less certain data.
Intrinsic colors of flares
The most certain and complete information on the intrinsic colors of UV Ceti
type star flares was obtained by Kunkel (1967). By using his data a two-color
diagram of flares is drawn in Fig. 3: the location of several flares of three
UV Ceti type stars near their maxima are marked with different symbols and three
broken lines represent the tracks of flares which could be studied
colorimetrically for a long time. This diagram gives a good idea of the
intrinsic colors of flares near their maxima (B - V approx. 0.0m +- 0.3m,
U-B approx. -1.1m +- 0.2m) and of the character of a flare drift on the two-color
diagram (to the right and slightly downwards) during their decay.
Spectral features of flares
In 1948 Joy and Humason (1949) took the first slit spectrogram of an UV Ceti
flare. The examination of this unique plate taken with the exposure of 144 min
has shown that during the flare the emission hydrogen lines became much stronger,
CaII emission intensified, but to a less extent emission lines of HeI and HeII
appeared which had not been seen in the quiet state star spectrum. Absorption
lines almost disappeared, being veiled by a continuum which was very strong in
UV spectral region; the spectrophotometric temperature of that continuum
exceeded 10000 deg K, widths of the emission hydrogen lines amounted to 2 A,
and the decrement was not steep.
Fig. 2. Flare distributions according to their absolute rates of energy output
increase before maximum for 4 UV Cet stars. Non-dashed districts are
less certain data.
Intrinsic colors of flares
The most certain and complete information on the intrinsic colors of UV Ceti
type star flares was obtained by Kunkel (1967). By using his data a two-color
diagram of flares is drawn in Fig. 3: the location of several flares of three
UV Ceti type stars near their maxima are marked with different symbols and three
broken lines represent the tracks of flares which could be studied
colorimetrically for a long time. This diagram gives a good idea of the
intrinsic colors of flares near their maxima (B - V approx. 0.0m +- 0.3m,
U-B approx. -1.1m +- 0.2m) and of the character of a flare drift on the two-color
diagram (to the right and slightly downwards) during their decay.
Spectral features of flares
In 1948 Joy and Humason (1949) took the first slit spectrogram of an UV Ceti
flare. The examination of this unique plate taken with the exposure of 144 min
has shown that during the flare the emission hydrogen lines became much stronger,
CaII emission intensified, but to a less extent emission lines of HeI and HeII
appeared which had not been seen in the quiet state star spectrum. Absorption
lines almost disappeared, being veiled by a continuum which was very strong in
UV spectral region; the spectrophotometric temperature of that continuum
exceeded 10000 deg K, widths of the emission hydrogen lines amounted to 2 A,
and the decrement was not steep.
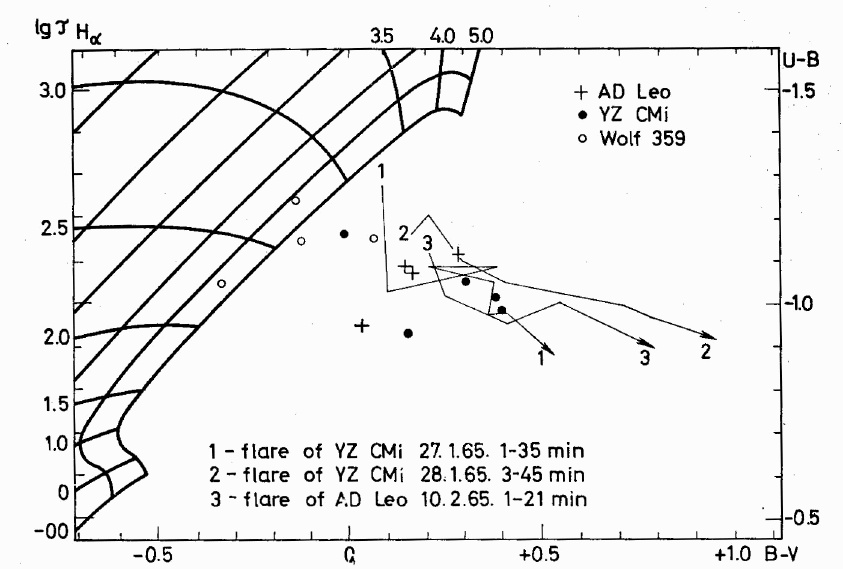 Fig. 3. Two-color diagram for UV Cet star flares. In the left and upper part
of the plot there are the colors of hot ionized hydrogen clouds of different
temperatures and optical thickness.
Having used a high sensitive receiver (image tube), the spectral
observations of flares were carried out in Crimea in 1965 and nearly 30
spectrograms of 10 flares of AD Leo and UV Cet were obtained with a time
resolution from 20 sec up to 1 - 2 min (Gershberg and Chugainov, 1966,
1967); simultaneously the brightness of the star was being monitored
photoelectrically. The light curve of the strongest. AD Leo flare
registered by us is given in Fig. 4, the time intervals of flare
spectrographying are marked too. Five spectra of this flare are
reproduced in Fig. 5. During the strong flare the stellar spectrum
transformed beyond recognition in the photographic region, but the
changes were not so striking in green and red. The most prominent
feature in all flare spectra is an intensification of Balmer emission
lines. The quantitative treatment of the spectrograms shows that the
equivalent widths of the emission hydrogen lines during the flares
approach tens of angstroms, the augmentations of the widths at a half
intensity level amount to 3-5 A. With the flare decaying, the continuum
radiation decreases first of all and line emission decreases more
slowly; sometimes line emission is still visible when a wide-band
photoelectric photometry does not find a trace of a flare. The widths of
emission lines return to the normal state more quickly than the
intensities of these lines do. The helium lines were found only near
flare maxima, the maximum in CaII takes place later than that in
hydrogen lines. The veiling of intensity jumps near the TiO-band limits
and that of the absorption line lambda 4227 A give a possibility to evaluate
a part of flare continuum in the whole continuum radiation for moderate
intense flares.
Later Chugainov (1968) carried out two sets of photoelectric observations
of EV Lac and UV Cet flares; he used narrow-band interference filters and
confirmed time variations; he determined absolute values of equivalent widths
of the H_beta-line spectrographically with the image tube device.
The same year important spectral studies of UV Ceti type star flares
were carried out by Kunkel (1967). Kunkel's essential success is an
investigation on the UV spectral region of flares and spectrophotometric
measurements at a wide wave-length interval. Kunkel has found and
measured the emission jump near the Balmer limit, he has confirmed the
fact of a quick disappearance of the strong continuum radiation and the
quick narrowing of emission lines after the flare maximum and found the
Balmer decrement at several stages of the flare. He has shown that the
relative rate of the flare decay in the lines is nearly one half of the
rate in the continuum, and the decay in CaII is the slowest one.
At present we do not possess any information on flare line profiles,
their Doppler shifts and possible anomalies in abundances of elements
and isotopes. Nowadays such investigations are on the very limit or
beyond the limit of instrumental power.
Fig. 3. Two-color diagram for UV Cet star flares. In the left and upper part
of the plot there are the colors of hot ionized hydrogen clouds of different
temperatures and optical thickness.
Having used a high sensitive receiver (image tube), the spectral
observations of flares were carried out in Crimea in 1965 and nearly 30
spectrograms of 10 flares of AD Leo and UV Cet were obtained with a time
resolution from 20 sec up to 1 - 2 min (Gershberg and Chugainov, 1966,
1967); simultaneously the brightness of the star was being monitored
photoelectrically. The light curve of the strongest. AD Leo flare
registered by us is given in Fig. 4, the time intervals of flare
spectrographying are marked too. Five spectra of this flare are
reproduced in Fig. 5. During the strong flare the stellar spectrum
transformed beyond recognition in the photographic region, but the
changes were not so striking in green and red. The most prominent
feature in all flare spectra is an intensification of Balmer emission
lines. The quantitative treatment of the spectrograms shows that the
equivalent widths of the emission hydrogen lines during the flares
approach tens of angstroms, the augmentations of the widths at a half
intensity level amount to 3-5 A. With the flare decaying, the continuum
radiation decreases first of all and line emission decreases more
slowly; sometimes line emission is still visible when a wide-band
photoelectric photometry does not find a trace of a flare. The widths of
emission lines return to the normal state more quickly than the
intensities of these lines do. The helium lines were found only near
flare maxima, the maximum in CaII takes place later than that in
hydrogen lines. The veiling of intensity jumps near the TiO-band limits
and that of the absorption line lambda 4227 A give a possibility to evaluate
a part of flare continuum in the whole continuum radiation for moderate
intense flares.
Later Chugainov (1968) carried out two sets of photoelectric observations
of EV Lac and UV Cet flares; he used narrow-band interference filters and
confirmed time variations; he determined absolute values of equivalent widths
of the H_beta-line spectrographically with the image tube device.
The same year important spectral studies of UV Ceti type star flares
were carried out by Kunkel (1967). Kunkel's essential success is an
investigation on the UV spectral region of flares and spectrophotometric
measurements at a wide wave-length interval. Kunkel has found and
measured the emission jump near the Balmer limit, he has confirmed the
fact of a quick disappearance of the strong continuum radiation and the
quick narrowing of emission lines after the flare maximum and found the
Balmer decrement at several stages of the flare. He has shown that the
relative rate of the flare decay in the lines is nearly one half of the
rate in the continuum, and the decay in CaII is the slowest one.
At present we do not possess any information on flare line profiles,
their Doppler shifts and possible anomalies in abundances of elements
and isotopes. Nowadays such investigations are on the very limit or
beyond the limit of instrumental power.
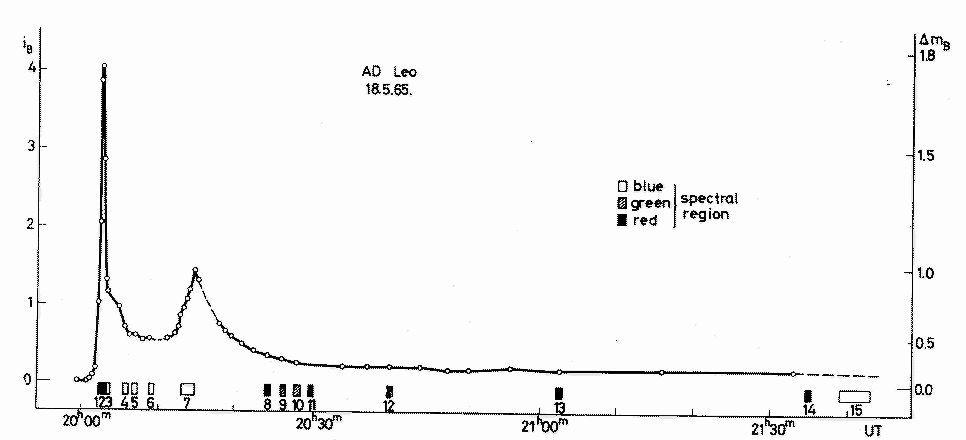 Fig. 4. Light curve of the AD Leo flare on 18.5.1965. Numbered
rectangles mark time intervals of spectrographying the flare.
Fig. 4. Light curve of the AD Leo flare on 18.5.1965. Numbered
rectangles mark time intervals of spectrographying the flare.
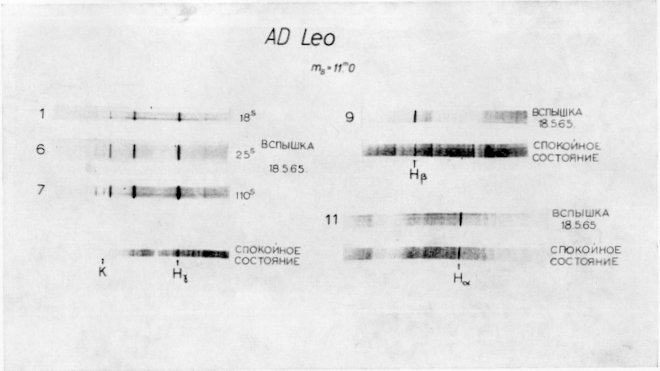 Fig. 5 Spectrograms of AD Leo during the strong flare on 18.5.1965 and
in the quiet state on 4.6.1965. Numbers on the left correspond to the
numeration in Fig. 4.
Polarimetric studies
Attempts to measure the polarization of UV Ceti type flare radiation
were undertaken more than once. But as it was shown by Efimov (1968),
all those observations had been made without due regard to the extreme
rapidity of UV Ceti type flares. It is clear that when studying
polarimetrically a variable source, the whole cycle of consecutive
measurements must be made during the time which is small in comparison
with the characteristic time of the source variations. But UV Ceti type
flares are weak, therefore the quantum fluctuations of flare radiation
flux turn out to be an essential obstacle when using small or moderate
telescopes and small time averages for polarimetric measurements. It is
necessary to use a large telescope and a special rapid-acting polarimeter
(may by, similar to the device which was constructed by Oskanjan,
Kubichela and Arsenijevich in Jugoslavia some years ago) in order to
obtain reliable results on polarization features of flares.
Radio emission of flares
Excluding the sun, the UV Ceti stars are the only stellar bodies from
which radio emission is certainly registered up to now. Radio emission
of UV Ceti flares was found by Lovell (1964) with Jodrell Bank radio
telescopes in 1958. First the radio emission of flares was found
statistically by superposition of the radio records during 23 small
optical flares (Lovell, 1963). But now we have more than two dozens of
individual radio flare records at wave lengths in the range from 20 cm
to 15 m.
Fig. 5 Spectrograms of AD Leo during the strong flare on 18.5.1965 and
in the quiet state on 4.6.1965. Numbers on the left correspond to the
numeration in Fig. 4.
Polarimetric studies
Attempts to measure the polarization of UV Ceti type flare radiation
were undertaken more than once. But as it was shown by Efimov (1968),
all those observations had been made without due regard to the extreme
rapidity of UV Ceti type flares. It is clear that when studying
polarimetrically a variable source, the whole cycle of consecutive
measurements must be made during the time which is small in comparison
with the characteristic time of the source variations. But UV Ceti type
flares are weak, therefore the quantum fluctuations of flare radiation
flux turn out to be an essential obstacle when using small or moderate
telescopes and small time averages for polarimetric measurements. It is
necessary to use a large telescope and a special rapid-acting polarimeter
(may by, similar to the device which was constructed by Oskanjan,
Kubichela and Arsenijevich in Jugoslavia some years ago) in order to
obtain reliable results on polarization features of flares.
Radio emission of flares
Excluding the sun, the UV Ceti stars are the only stellar bodies from
which radio emission is certainly registered up to now. Radio emission
of UV Ceti flares was found by Lovell (1964) with Jodrell Bank radio
telescopes in 1958. First the radio emission of flares was found
statistically by superposition of the radio records during 23 small
optical flares (Lovell, 1963). But now we have more than two dozens of
individual radio flare records at wave lengths in the range from 20 cm
to 15 m.
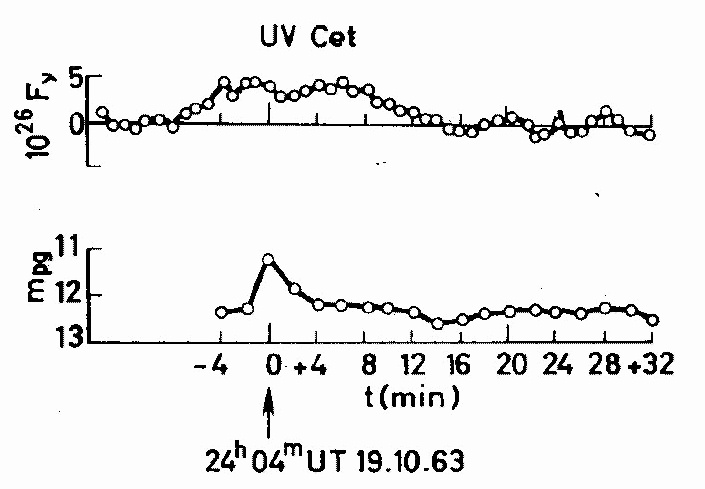 Fig. 6. Radio and optical flare of UV Cet on 19.10.1963.
The radio emission of flares varies as quickly as the optical radiation.
The radio emission is characterized by a high brightness temperature: a
moderate UV Cet radio flare distributed over the whole stellar disk
corresponds to Tb approx. 10^15 deg K. A typical radio flare record and its light
curve are given in Fig. 6. According to a rough estimate, a flare
radiates 100 times less energy in the radio wave-length range than in
the optical flare energy. Lovell (1964) found a certain delay in radio
emission at the lower frequencies when observing the UV Cet flare on
25.10.1963 at two frequences. (Fig. 7)
The radio emission of the V 371 Ori flare on 30.11.1962 was studied in
the fullest detail (Fig. 8): Australian investigators found the flare
radio emission at 3 frequencies and at 410 MHz sharp and deep fadings
were observed (Slee et al. 1963).
Fig. 6. Radio and optical flare of UV Cet on 19.10.1963.
The radio emission of flares varies as quickly as the optical radiation.
The radio emission is characterized by a high brightness temperature: a
moderate UV Cet radio flare distributed over the whole stellar disk
corresponds to Tb approx. 10^15 deg K. A typical radio flare record and its light
curve are given in Fig. 6. According to a rough estimate, a flare
radiates 100 times less energy in the radio wave-length range than in
the optical flare energy. Lovell (1964) found a certain delay in radio
emission at the lower frequencies when observing the UV Cet flare on
25.10.1963 at two frequences. (Fig. 7)
The radio emission of the V 371 Ori flare on 30.11.1962 was studied in
the fullest detail (Fig. 8): Australian investigators found the flare
radio emission at 3 frequencies and at 410 MHz sharp and deep fadings
were observed (Slee et al. 1963).
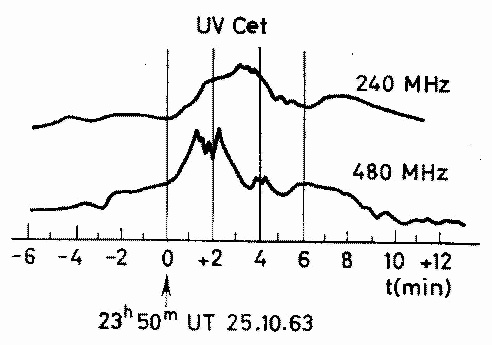 Fig. 7. Radio emission drift over frequencies during the UV Cet flare
on 25.10.1963.
Fig. 7. Radio emission drift over frequencies during the UV Cet flare
on 25.10.1963.
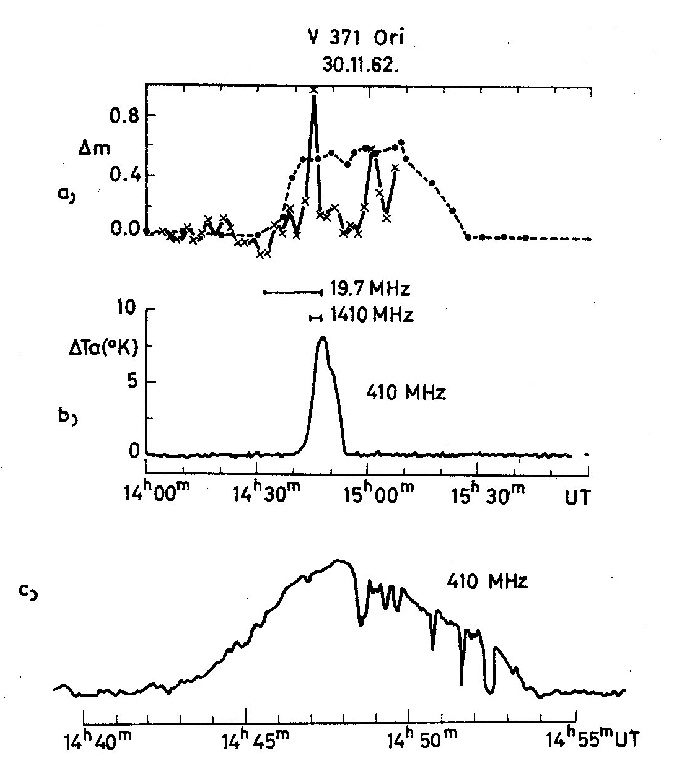 Fig. 8. V 371 Ori flare on 30.11.1962.
a) optical observations: solid line - photographical,
dashed line - visual monitoring of brightness;
b) radio observations: solid line is the smoothed record at 410 MHz,
segments mark time intervals when the flare is recorded at other
frequencies;
c) the flare-record at 410 MHz.
INTERPRETATION AND HYPOTHESES
Let us go to phenomenological interpretations and the physical hypotheses
related to UV Ceti flares.
It is known that in 1924 Hertzsprung found for the first time a stellar flare,
similar to UV Ceti flares, and in accordance with the spirit of the 20th years
astronomy he supposed that the falling of an asteroid on the star could be
regarded as a cause of the flare. Now this idea may be considered only as a
historical curiosity. Since the beginning of intensive study of flare stars in
1948 nearly a dozen hypotheses have appeared. Today, the so-called nebular or
chromospheric flare model has the closest contact with observations. Therefore,
I shall give an account of this scheme and then shall describe other models
and hypotheses in short.
Nebular or chromospheric model
The main supposition of the nebular model is that an optical flare is
connected with a quick appearance of a hot ionized gaseous cloud above
the photosphere of a cold star; this cloud is deprived of external
sources of ionization and radiates due to irreversible recombinations.
Let us compare this scheme with the observations.
If during a flare the mass of the cloud is constant and its optical
thickness is small, then it is not difficult to calculate the expected
light curve. The comparison of 10 observed EV Lac flares with
theoretical curves, which have been calculated for the simplest
isothermal radiative process, are given in Fig. 9. (Gershberg, 1964). In
half of the cases we have an agreement. Later calculations were carried
out taking the cooling effects into account (Gershberg, 1967), and now
we calculate the theoretical curves making allowance for self-absorption
in the Balmer lines; as a result, the theoretical curve-family enriches
and a possibility to fit the theory to the observations increases. But
one ought not to undergo a delusion: on one hand, a rich theoretical
curve-family makes the comparison of the theory with observations
non-critical; on the other hand, no theoretical curves calculated for a
homogeneous and uniformly expanded cloud are able to explain such
details of light curves as secondary maxima and time intervals of
constant brightness, and to interpret the ascending branches of flares.
Therefore, the observed light curves are not in contradiction with the
nebular model but this model is too primitive to give a complete theory
of the observed light curves. It should be noted that many observers
have represented the observed light curves of UV Ceti flares as one or
two exponential curves, and this representation is not worse than the
nebular one; but the exponential representation is not substantiated
physically, it is an erroneous conclusion of a wrong hypothesis on a hot
spot (see below).
The nebular interpretation of color features of flares is given in
Fig. 3 according to Kunkel (1967). The colors of a hot ionized hydrogen
cloud, which has the optical thickness tau_H alpha = 0-10^5, are located
in the left and upper part of the plot. From the relative positions of
flares and nebular models on the two-color diagram one can conclude that
the flare radiation at maxima has the same colors as the hot gas in the
case of T_e >= 30000 deg K and tau_H alpha approx. 10^2 to 10^3. The approximate
character of Kunkel's calculations (a stationary gas in LTE-conditions,
self-absorption effects in coherent approximation) does not permit to insist on
the values T_e and tau_H alpha obtained, but the agreement between observations
and the nebular model is at hand. With the same certainty, Fig. 3 shows a flare
drift according to the nebular model during the flare decay. Kunkel interprets
this drift as an increasing contribution of an equilibrium hot photospheric
spot - a photosphere's "burn" - to the surplus stellar radiation.
Fig. 8. V 371 Ori flare on 30.11.1962.
a) optical observations: solid line - photographical,
dashed line - visual monitoring of brightness;
b) radio observations: solid line is the smoothed record at 410 MHz,
segments mark time intervals when the flare is recorded at other
frequencies;
c) the flare-record at 410 MHz.
INTERPRETATION AND HYPOTHESES
Let us go to phenomenological interpretations and the physical hypotheses
related to UV Ceti flares.
It is known that in 1924 Hertzsprung found for the first time a stellar flare,
similar to UV Ceti flares, and in accordance with the spirit of the 20th years
astronomy he supposed that the falling of an asteroid on the star could be
regarded as a cause of the flare. Now this idea may be considered only as a
historical curiosity. Since the beginning of intensive study of flare stars in
1948 nearly a dozen hypotheses have appeared. Today, the so-called nebular or
chromospheric flare model has the closest contact with observations. Therefore,
I shall give an account of this scheme and then shall describe other models
and hypotheses in short.
Nebular or chromospheric model
The main supposition of the nebular model is that an optical flare is
connected with a quick appearance of a hot ionized gaseous cloud above
the photosphere of a cold star; this cloud is deprived of external
sources of ionization and radiates due to irreversible recombinations.
Let us compare this scheme with the observations.
If during a flare the mass of the cloud is constant and its optical
thickness is small, then it is not difficult to calculate the expected
light curve. The comparison of 10 observed EV Lac flares with
theoretical curves, which have been calculated for the simplest
isothermal radiative process, are given in Fig. 9. (Gershberg, 1964). In
half of the cases we have an agreement. Later calculations were carried
out taking the cooling effects into account (Gershberg, 1967), and now
we calculate the theoretical curves making allowance for self-absorption
in the Balmer lines; as a result, the theoretical curve-family enriches
and a possibility to fit the theory to the observations increases. But
one ought not to undergo a delusion: on one hand, a rich theoretical
curve-family makes the comparison of the theory with observations
non-critical; on the other hand, no theoretical curves calculated for a
homogeneous and uniformly expanded cloud are able to explain such
details of light curves as secondary maxima and time intervals of
constant brightness, and to interpret the ascending branches of flares.
Therefore, the observed light curves are not in contradiction with the
nebular model but this model is too primitive to give a complete theory
of the observed light curves. It should be noted that many observers
have represented the observed light curves of UV Ceti flares as one or
two exponential curves, and this representation is not worse than the
nebular one; but the exponential representation is not substantiated
physically, it is an erroneous conclusion of a wrong hypothesis on a hot
spot (see below).
The nebular interpretation of color features of flares is given in
Fig. 3 according to Kunkel (1967). The colors of a hot ionized hydrogen
cloud, which has the optical thickness tau_H alpha = 0-10^5, are located
in the left and upper part of the plot. From the relative positions of
flares and nebular models on the two-color diagram one can conclude that
the flare radiation at maxima has the same colors as the hot gas in the
case of T_e >= 30000 deg K and tau_H alpha approx. 10^2 to 10^3. The approximate
character of Kunkel's calculations (a stationary gas in LTE-conditions,
self-absorption effects in coherent approximation) does not permit to insist on
the values T_e and tau_H alpha obtained, but the agreement between observations
and the nebular model is at hand. With the same certainty, Fig. 3 shows a flare
drift according to the nebular model during the flare decay. Kunkel interprets
this drift as an increasing contribution of an equilibrium hot photospheric
spot - a photosphere's "burn" - to the surplus stellar radiation.
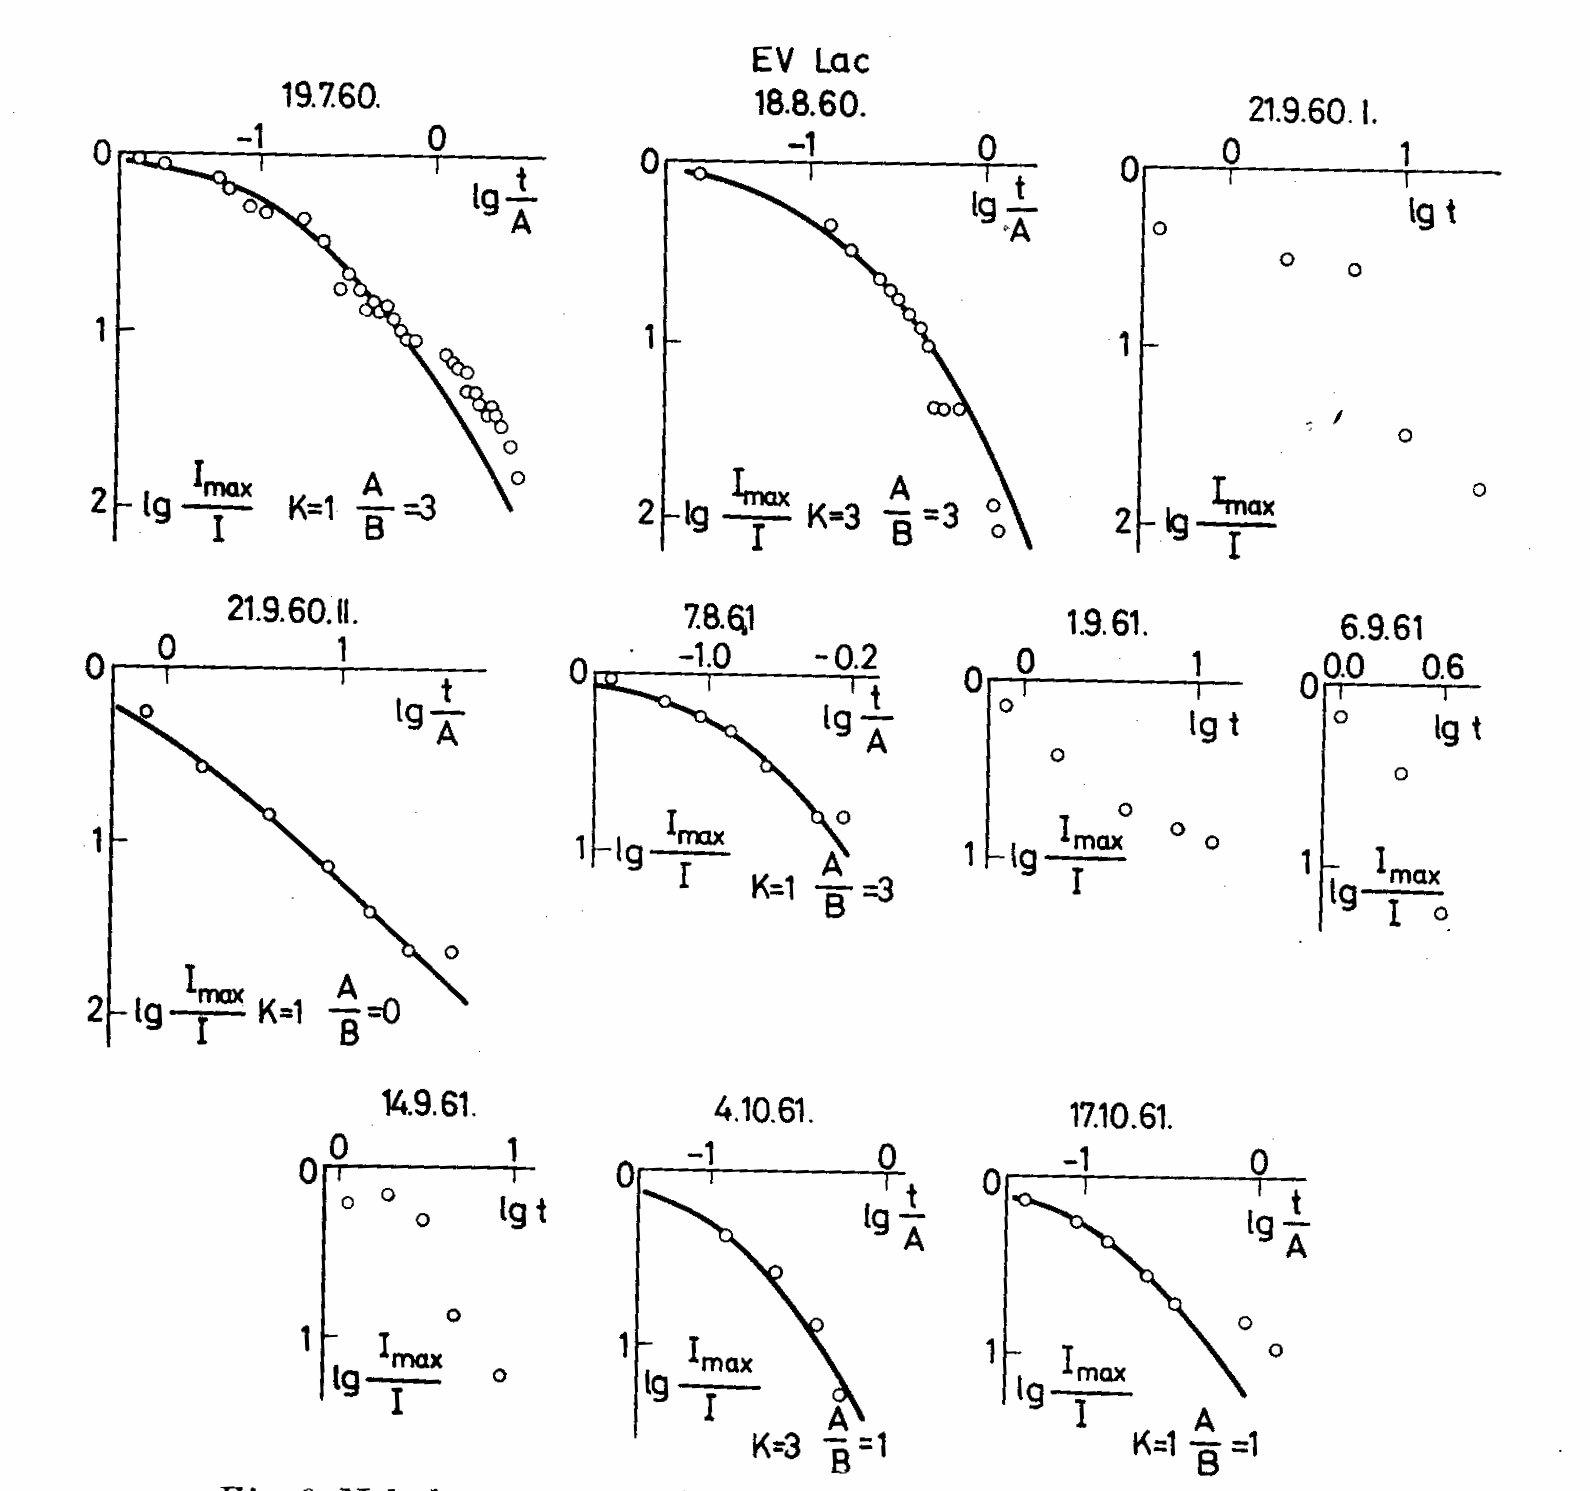 Fig. 9. Nebular representations of 10 light curves of EV Lac flares.
Qualitative spectral features of a UV Ceti type flare - the appearance of
strong continuum emission and strong intensification of line emission - were
known from previous observations by Wachmann (1939), Joy and Humason (1949),
and Herbig (1956) and naturally they fit to the nebular model. Our observations
(Gershberg and Chugainov 1966; 1967) and those of Kunkel (1967) permit to make
a quantitative comparison.
Fig. 9. Nebular representations of 10 light curves of EV Lac flares.
Qualitative spectral features of a UV Ceti type flare - the appearance of
strong continuum emission and strong intensification of line emission - were
known from previous observations by Wachmann (1939), Joy and Humason (1949),
and Herbig (1956) and naturally they fit to the nebular model. Our observations
(Gershberg and Chugainov 1966; 1967) and those of Kunkel (1967) permit to make
a quantitative comparison.
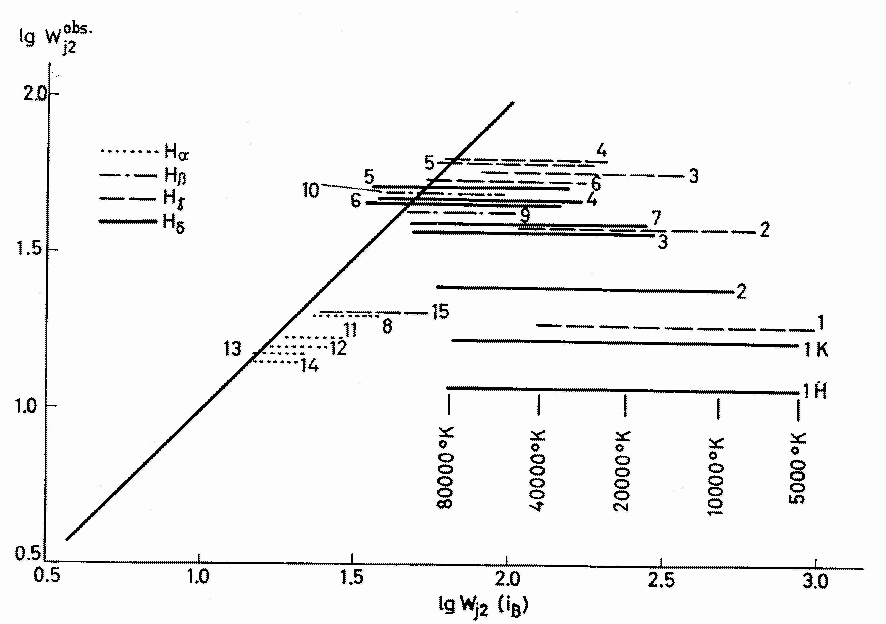 Fig. 10. Comparison of the observed equivalent widths of Balmer lines in
the AD Leo flare on 18.5.1965. and corresponding equivalent widths
calculated in accordance with the flare brightness at different times
for the optically thin flare model.
The comparison of the equivalent widths of Balmer emission lines observed
in the AD Leo flare on 18.5.1965 with the equivalent widths calculated in
accordance with the brightness of the flare and in supposition of an
optically thin gas is given in Fig. 10. It is seen that at the beginning
of the flare the equivalent widths observed are ten times less than the
calculated ones. The same results follow from other spectrograms of AD
Leo and UV Cet flares. Since our calculations have been carried out for
T_e <= 80000 deg K, the obtained disagreement can be explained either by a
higher temperature, or by self-absorption effects in the lines. Kunkel's
observations decide this dilemma: the considerable magnitude of the
emission Balmer jump found by him means T_e < 25000 deg K. It should be
noted that this upper limit of temperature may not be far from the real
temperature because of the existing HeII emission. Comparing the
observed and calculated Balmer decrements (see Table 5) Kunkel has found
an independent and decisive argument for the chromospheric flare model:
observed line intensity ratios from H_beta to H_11 correspond to radiation of
the gas of the temperature T_e = 20000 to 25000 deg K and of the same
optical thickness what has been obtained from colorimetric studies.
Physical hypotheses
The phenomenological nebular model of flares permits several physical
interpretations. The possible existence of a characteristic time between flares
suggests the assumption of active regions on the stellar surface and of a
rather quick rotation of the star. The origin of a hot cloud above the
photosphere can be connected either with a shock wave appearance, or with a hot
"bubble" coming to the surface (Gorbatzkij, 1964), or with solar chromospheric
flare type processes.
Table 5
Calculated Balmer decrements for LTE-conditions, coherent re-emission in lines,
n_e = 30x 10^13 cm^-3 and V_turb. = 20 km/sec.
lg tau_H alpha H_alpha H_beta H_gamma H_delta H_xi H_eta H_10 H_11
T_e = 20000 deg K
2.0 0.55 1.00 1.06 0.74 0.32 0.22 0.16 0.12
2.5 0.63 1.00 1.32 1.27 0.68 0.49 0.36 0.27
3.0 0.76 1.00 1.31 1.55 1.26 0.97 0.73 0.56
3.5 0.81 1.00 1.21 1.45 1.65 1.49 1.26 1.02
4.0 0.84 1.00 1.13 1.29 1.57 1.64 1.60 1.46
T_e = 25000 deg K
2.0 0.51 1.00 1.09 0.78 0.35 0.24 0.17 0.13
2.5 0.58 1.00 1.37 1.35 0.74 0.53 0.39 0.29
3.0 0.68 1.00 1.36 1.65 1.37 1.06 0.81 0.62
3.5 0.75 1.00 1.25 1.54 1.79 1.64 1.39 1.12
4.0 0.78 1.00 1.17 1.36 1.70 1.80 1.76 1.61
An analogy between solar and UV Cet type flares was suspected by
Greenstein and Whipple nearly 20 years ago, then it was spoken about by
the Burbidges, Schatzman, Struve and al., but now this analogy becomes
clearer and deeper. Indeed, both types of events have a strongly
pronounced explosive behavior, they have no clear periodicity, but there
are epochs of different activity level; the same emission lines appear
in the spectra of both types of flares and there is similarity in the
sequence of the flaring of different lines and in the character of
intensity and line width variations during the flare decay; both types
of optical flares are accompanied by strong radio flares, and the
physical parameters of the hot gas responsible for the optical flares
are similar. Therefore we have a good reason to suspect the similarity
in intrinsic physical causes of both types of flares.
As it is known, the energy source of chromospheric flares is the magnetic
field, and the solar activity is determined by magneto-hydrodynamic phenomena
which are mostly caused by convective motions. As UV Ceti stars are bodies
of small mass and their inner structure is completely convective, it is natural
to expect strong magneto-hydrodynamic motions and, as a result, a flare
activity in these stars. The decisive confirmation of this conception
has been obtained recently. Poveda (1965) showed that the convection
must be very strong in stars of low luminosity up to K1-stars and
Haro (1968) found a high flare activity of stars (in clusters of different age)
up to the same spectral class. The main but the only parameter of the
modern theory of stellar evolution - the mass - is used in this conception;
therefore, in order to explain the differences between dMe and UV Ceti type
stars and between dMe and normal M dwarfs, it is necessary to appeal either to
evolutionary considerations or to additional parameters, as rotation, anomaly
of element abundance, binary systems' features etc. We may note that the
approximate characteristic time of flare activity level variations is a few
months for UV Cet and the orbital motion characteristic time is tens of
years for the L726-8AB-system (UV Cet = L726-8B), therefore a close
connection between these phenomena can not exist.
Alternative models and hypotheses
Finally we submit some critical comments on other phenomenological
models and physical hypotheses.
Recent results on UV Ceti-type star flares permit to reject some
previous models of flares. For instance, the ideas about a flare as an
appearance of a hot equilibrium photospheric spot, and hypotheses on
pure synchrotronic or pure Compton nature of flare radiation must be
rejected in view of the discovery of the Balmer emission jump and the
strong line emission in flares. It is also necessary to reject different
hypotheses of external excitation of flares as the flare frequency and
the drift of radio emission to long wavelength range indicate inner
causes of these events.
Ambarzumjan (1954) supposed that the UV Ceti type flares were connected
with ejections of an unknown "pre-stellar matter" from the stellar
interior. Recent experimental data do not confirm this hypothesis but
they do not disprove it either.
Since 1956 Schatzman (1967) has developed a stellar vibrational
instability theory and applied it to different stellar flares; but this
mechanism cannot be responsible for UV Ceti type flares as its basis is
a strong dependence of the thermonuclear reaction rate on temperature
and density of matter and such a reaction is not maintained in small
mass M dwarfs.
Kolesnik (1966) has used a maser effect in nonequilibrium plasma to interpret
the flares. The necessity of such a hypothesis is not obvious today.
For the last years Gurzadjan (1965, 1966) has been developing a theory
of UV Ceti type flares; all nebular features of flares are regarded as
secondary effects while the primary one is supposed to be a fast electron
ejection and their Compton interaction with the photospheric radiation.
According to this hypothesis the electron energy must exceed 10^5 to 10^7
times the optical energy of the flare and does not excite any observable
consequences on the star; this is the main difficulty in Gurzadjan's theory.
It is my pleasure to thank Dr. W. E. Kunkel, who courteously sent me his
Dissertation. Prof. Haro for making available a preprint of his review
on flare stars and Dr. P. F. Chugainov, Chairman of Working Group on
Flare Stars, for the information on premilinary results of cooperative
observations. All these data were very useful while preparing this
report.
REFERENCES
Ambarzumjan, V. A., 1954, Sobbsch. Bjurak. Obs. 13.
Andrews, A. D., 1966, Publ. astr. Soc. Pacific 78, 324; 542.
"Non stable stars". Ed, by. Arakeljan, M. A., Erevan 1957.
Chugainov, P. F., 1966, Astr. J. 43, 1168.
Chugainov, P. F., 1968, Izv. Krym. astrofiz. Obs. 38, 200, 40.
Efimov, YU. S. 1968, Krym. astrofiz. Obs. 41.
Gershberg, R. E., 1964, Izv. Krym. astrofiz. Obs. 32, 133.
Gershberg, R. E., 1967, Izv. Krym. astrofiz. Obs. 36, 216.
Gershberg, R. E., and Chugainov, P. F., 1966, Astr. Zu. 43. 1168.
Gershberg, R. E., and Chugainov, P. F., 1967, Astr. Zu. 44, 260.
Gershberg, R. E., and Chugainov, P. F., 1968, Izv. Krym, astrofiz. Obs. 40.
Gliese, W., 1958, Z. Astrophys. 45, 293.
Gorbatzkij, V. G., 1964, Astr. Zu. 41, 53.
Gurzadjan, G. A., 1965, Astrofizika 1, 319, C. R. Ac. Sci. USSR.
Gurzadjan, G. A., 1966a, Astrofizika 2, 217.
Gurzadjan, G. A., 1966b, C. R. Ac. Sci. USSR, 166, 53.
Haro, G., 1968, Flare stars. "Clusters and binaries", Ed. by B. Middlehurst,
Chicago.
Non-stable stars. Symposium No. 3. IAU. Ed by Herbig, G. H. Cambridge, 1957.
Herbig, G. H., 1956, Publ. astr. Soc. Pacific 68, 531.
Joy, A. H. and Humason, M. L., 1949, Publ. astr. Soc. Pacific 61, 133.
Joy, A. H., 1960, "Stellar Atmospheres". Ed. by Greenstein, J. L. Chicago, p. 666.
Kolesnik, L G., 1966, Dissertation, Kiev.
Kunkel, W. E., 1967, An optical study of stellar flares. Austin, Texas.
Lippincott, S. L., 1953, J. astr. Soc. Can. 47, 24.
Lovell, B., Whipple, F. L., and Solomon, L. H., 1963, Nature 198, 228.
Lovell, B., Whipple, F. L., and Solomon, L. H., 1964, Nature 201, 1013.
Lovell, B., 1964. Scient. Am. 211, No. 2, 13.
Oskanjan, V., 1964, Publ. Obs. astr. Beograd No. 10.
Petit, M., 1961, J. Observateurs 44, 11.
Poveda, A., 1964, Nature 202, 1319.
Slee, O. B., Solomon, L. H., and Patston, G. E., 1963, Nature, 199, 991.
Wachmann, A. A., 1939, Beob. Zirk. 21, 25.
COMMENT
Lortet-Zuckerman: I did not understand whether the nebular model may
account for the high observed ratio of radio to optical energy.
The ratio radio to optical energy is two or three orders greater
for flare stars than for the sun.
Fig. 10. Comparison of the observed equivalent widths of Balmer lines in
the AD Leo flare on 18.5.1965. and corresponding equivalent widths
calculated in accordance with the flare brightness at different times
for the optically thin flare model.
The comparison of the equivalent widths of Balmer emission lines observed
in the AD Leo flare on 18.5.1965 with the equivalent widths calculated in
accordance with the brightness of the flare and in supposition of an
optically thin gas is given in Fig. 10. It is seen that at the beginning
of the flare the equivalent widths observed are ten times less than the
calculated ones. The same results follow from other spectrograms of AD
Leo and UV Cet flares. Since our calculations have been carried out for
T_e <= 80000 deg K, the obtained disagreement can be explained either by a
higher temperature, or by self-absorption effects in the lines. Kunkel's
observations decide this dilemma: the considerable magnitude of the
emission Balmer jump found by him means T_e < 25000 deg K. It should be
noted that this upper limit of temperature may not be far from the real
temperature because of the existing HeII emission. Comparing the
observed and calculated Balmer decrements (see Table 5) Kunkel has found
an independent and decisive argument for the chromospheric flare model:
observed line intensity ratios from H_beta to H_11 correspond to radiation of
the gas of the temperature T_e = 20000 to 25000 deg K and of the same
optical thickness what has been obtained from colorimetric studies.
Physical hypotheses
The phenomenological nebular model of flares permits several physical
interpretations. The possible existence of a characteristic time between flares
suggests the assumption of active regions on the stellar surface and of a
rather quick rotation of the star. The origin of a hot cloud above the
photosphere can be connected either with a shock wave appearance, or with a hot
"bubble" coming to the surface (Gorbatzkij, 1964), or with solar chromospheric
flare type processes.
Table 5
Calculated Balmer decrements for LTE-conditions, coherent re-emission in lines,
n_e = 30x 10^13 cm^-3 and V_turb. = 20 km/sec.
lg tau_H alpha H_alpha H_beta H_gamma H_delta H_xi H_eta H_10 H_11
T_e = 20000 deg K
2.0 0.55 1.00 1.06 0.74 0.32 0.22 0.16 0.12
2.5 0.63 1.00 1.32 1.27 0.68 0.49 0.36 0.27
3.0 0.76 1.00 1.31 1.55 1.26 0.97 0.73 0.56
3.5 0.81 1.00 1.21 1.45 1.65 1.49 1.26 1.02
4.0 0.84 1.00 1.13 1.29 1.57 1.64 1.60 1.46
T_e = 25000 deg K
2.0 0.51 1.00 1.09 0.78 0.35 0.24 0.17 0.13
2.5 0.58 1.00 1.37 1.35 0.74 0.53 0.39 0.29
3.0 0.68 1.00 1.36 1.65 1.37 1.06 0.81 0.62
3.5 0.75 1.00 1.25 1.54 1.79 1.64 1.39 1.12
4.0 0.78 1.00 1.17 1.36 1.70 1.80 1.76 1.61
An analogy between solar and UV Cet type flares was suspected by
Greenstein and Whipple nearly 20 years ago, then it was spoken about by
the Burbidges, Schatzman, Struve and al., but now this analogy becomes
clearer and deeper. Indeed, both types of events have a strongly
pronounced explosive behavior, they have no clear periodicity, but there
are epochs of different activity level; the same emission lines appear
in the spectra of both types of flares and there is similarity in the
sequence of the flaring of different lines and in the character of
intensity and line width variations during the flare decay; both types
of optical flares are accompanied by strong radio flares, and the
physical parameters of the hot gas responsible for the optical flares
are similar. Therefore we have a good reason to suspect the similarity
in intrinsic physical causes of both types of flares.
As it is known, the energy source of chromospheric flares is the magnetic
field, and the solar activity is determined by magneto-hydrodynamic phenomena
which are mostly caused by convective motions. As UV Ceti stars are bodies
of small mass and their inner structure is completely convective, it is natural
to expect strong magneto-hydrodynamic motions and, as a result, a flare
activity in these stars. The decisive confirmation of this conception
has been obtained recently. Poveda (1965) showed that the convection
must be very strong in stars of low luminosity up to K1-stars and
Haro (1968) found a high flare activity of stars (in clusters of different age)
up to the same spectral class. The main but the only parameter of the
modern theory of stellar evolution - the mass - is used in this conception;
therefore, in order to explain the differences between dMe and UV Ceti type
stars and between dMe and normal M dwarfs, it is necessary to appeal either to
evolutionary considerations or to additional parameters, as rotation, anomaly
of element abundance, binary systems' features etc. We may note that the
approximate characteristic time of flare activity level variations is a few
months for UV Cet and the orbital motion characteristic time is tens of
years for the L726-8AB-system (UV Cet = L726-8B), therefore a close
connection between these phenomena can not exist.
Alternative models and hypotheses
Finally we submit some critical comments on other phenomenological
models and physical hypotheses.
Recent results on UV Ceti-type star flares permit to reject some
previous models of flares. For instance, the ideas about a flare as an
appearance of a hot equilibrium photospheric spot, and hypotheses on
pure synchrotronic or pure Compton nature of flare radiation must be
rejected in view of the discovery of the Balmer emission jump and the
strong line emission in flares. It is also necessary to reject different
hypotheses of external excitation of flares as the flare frequency and
the drift of radio emission to long wavelength range indicate inner
causes of these events.
Ambarzumjan (1954) supposed that the UV Ceti type flares were connected
with ejections of an unknown "pre-stellar matter" from the stellar
interior. Recent experimental data do not confirm this hypothesis but
they do not disprove it either.
Since 1956 Schatzman (1967) has developed a stellar vibrational
instability theory and applied it to different stellar flares; but this
mechanism cannot be responsible for UV Ceti type flares as its basis is
a strong dependence of the thermonuclear reaction rate on temperature
and density of matter and such a reaction is not maintained in small
mass M dwarfs.
Kolesnik (1966) has used a maser effect in nonequilibrium plasma to interpret
the flares. The necessity of such a hypothesis is not obvious today.
For the last years Gurzadjan (1965, 1966) has been developing a theory
of UV Ceti type flares; all nebular features of flares are regarded as
secondary effects while the primary one is supposed to be a fast electron
ejection and their Compton interaction with the photospheric radiation.
According to this hypothesis the electron energy must exceed 10^5 to 10^7
times the optical energy of the flare and does not excite any observable
consequences on the star; this is the main difficulty in Gurzadjan's theory.
It is my pleasure to thank Dr. W. E. Kunkel, who courteously sent me his
Dissertation. Prof. Haro for making available a preprint of his review
on flare stars and Dr. P. F. Chugainov, Chairman of Working Group on
Flare Stars, for the information on premilinary results of cooperative
observations. All these data were very useful while preparing this
report.
REFERENCES
Ambarzumjan, V. A., 1954, Sobbsch. Bjurak. Obs. 13.
Andrews, A. D., 1966, Publ. astr. Soc. Pacific 78, 324; 542.
"Non stable stars". Ed, by. Arakeljan, M. A., Erevan 1957.
Chugainov, P. F., 1966, Astr. J. 43, 1168.
Chugainov, P. F., 1968, Izv. Krym. astrofiz. Obs. 38, 200, 40.
Efimov, YU. S. 1968, Krym. astrofiz. Obs. 41.
Gershberg, R. E., 1964, Izv. Krym. astrofiz. Obs. 32, 133.
Gershberg, R. E., 1967, Izv. Krym. astrofiz. Obs. 36, 216.
Gershberg, R. E., and Chugainov, P. F., 1966, Astr. Zu. 43. 1168.
Gershberg, R. E., and Chugainov, P. F., 1967, Astr. Zu. 44, 260.
Gershberg, R. E., and Chugainov, P. F., 1968, Izv. Krym, astrofiz. Obs. 40.
Gliese, W., 1958, Z. Astrophys. 45, 293.
Gorbatzkij, V. G., 1964, Astr. Zu. 41, 53.
Gurzadjan, G. A., 1965, Astrofizika 1, 319, C. R. Ac. Sci. USSR.
Gurzadjan, G. A., 1966a, Astrofizika 2, 217.
Gurzadjan, G. A., 1966b, C. R. Ac. Sci. USSR, 166, 53.
Haro, G., 1968, Flare stars. "Clusters and binaries", Ed. by B. Middlehurst,
Chicago.
Non-stable stars. Symposium No. 3. IAU. Ed by Herbig, G. H. Cambridge, 1957.
Herbig, G. H., 1956, Publ. astr. Soc. Pacific 68, 531.
Joy, A. H. and Humason, M. L., 1949, Publ. astr. Soc. Pacific 61, 133.
Joy, A. H., 1960, "Stellar Atmospheres". Ed. by Greenstein, J. L. Chicago, p. 666.
Kolesnik, L G., 1966, Dissertation, Kiev.
Kunkel, W. E., 1967, An optical study of stellar flares. Austin, Texas.
Lippincott, S. L., 1953, J. astr. Soc. Can. 47, 24.
Lovell, B., Whipple, F. L., and Solomon, L. H., 1963, Nature 198, 228.
Lovell, B., Whipple, F. L., and Solomon, L. H., 1964, Nature 201, 1013.
Lovell, B., 1964. Scient. Am. 211, No. 2, 13.
Oskanjan, V., 1964, Publ. Obs. astr. Beograd No. 10.
Petit, M., 1961, J. Observateurs 44, 11.
Poveda, A., 1964, Nature 202, 1319.
Slee, O. B., Solomon, L. H., and Patston, G. E., 1963, Nature, 199, 991.
Wachmann, A. A., 1939, Beob. Zirk. 21, 25.
COMMENT
Lortet-Zuckerman: I did not understand whether the nebular model may
account for the high observed ratio of radio to optical energy.
The ratio radio to optical energy is two or three orders greater
for flare stars than for the sun.