Non-Periodic Phenomena in Variable Stars
IAU Colloquium, Budapest, 1968
MULTI-COLOUR PHOTOMETRY OF ORION FLARE STARS
A. D. ANDREWS
Armagh Observatory, Northern Ireland
(read by J. D. FERNIE)
ABSTRACT
The first results of a photometric study of the Orion flare stars is
presented using material from the Boyden Observatory. A 60-inch
photoelectric sequence, in U, B, V and R, and a photographic reduction
technique developed for ADH Baker-Schmidt plates by C. J. Butler, are
utilized to construct colour-magnitude and colour-colour diagrams for
flare stars to V = 16m. The scatter of the flare stars about the main
sequence, pointed out by Haro, is confirmed in the B-V/V diagram.
However, a fairly well-defined band in the V-R/V diagram is evident,
extending from V-R = 1.0m, V = 12.5m to V-R = 1.7m, V = 16.0m. The
classical flare stars appear to fall within the same region of the
B-V/V-R diagram but to the red of the majority of Orion flare stars.
INTRODUCTION
The wealth of material on flare stars in stellar aggregates of differing
age, systematically accumulated since the early fifties mainly by Haro,
has inspired many fresh inquiries into the early evolution of stars. The
list of 176 flare stars in the vicinity of the Orion Nebula published by
Haro (1968) summarizes the discoveries of Haro and Chavira at
Tonantzintla, Rosino at Asiago, and their collaborators up until 1965.
These flare stars, in common with many T Tauri stars, are strongly
concentrated towards the centre of the Orion Nebula, and are, almost
beyond doubt, T-association members of Orion T2 (Kholopov, 1959). From
the evidence of extensive photographic work, Haro has stated that the
Orion flare stars appear to lie both above and below, as well as on the
main sequence. In view of the lack of spectra any but the brightest
stars, obtained by Herbig (1962), and the paucity of reliable magnitude
determinations, it is worthwhile to attempt, as far as possible
traditional UBV photometry even in this difficult, nebulous region to
examine this peculiar feature of the Orion flare stars in the H-R
diagram. Mendoza (1968) has already made multicolour photometry for
seven of these stars and has emphasized large infrared colour-excesses
in these and other related, T Tauri-like stars. The primary questions
asked today concerning flare stars are: a) What is the true extent of
their scatter about the lower main sequence? b) What is the observed
leftward limit, following Poveda (1964), of the flare stars in the H-R
diagram? c) Is there evidence for broad-band colour changes in flare
stars such as found in the RW Aurigae stars (Broglia, Lenouvel 1960,
Mosidze 1967) and d) What is the relation between flare stars of the
Orion type, for example, and the classical UV Ceti variables?
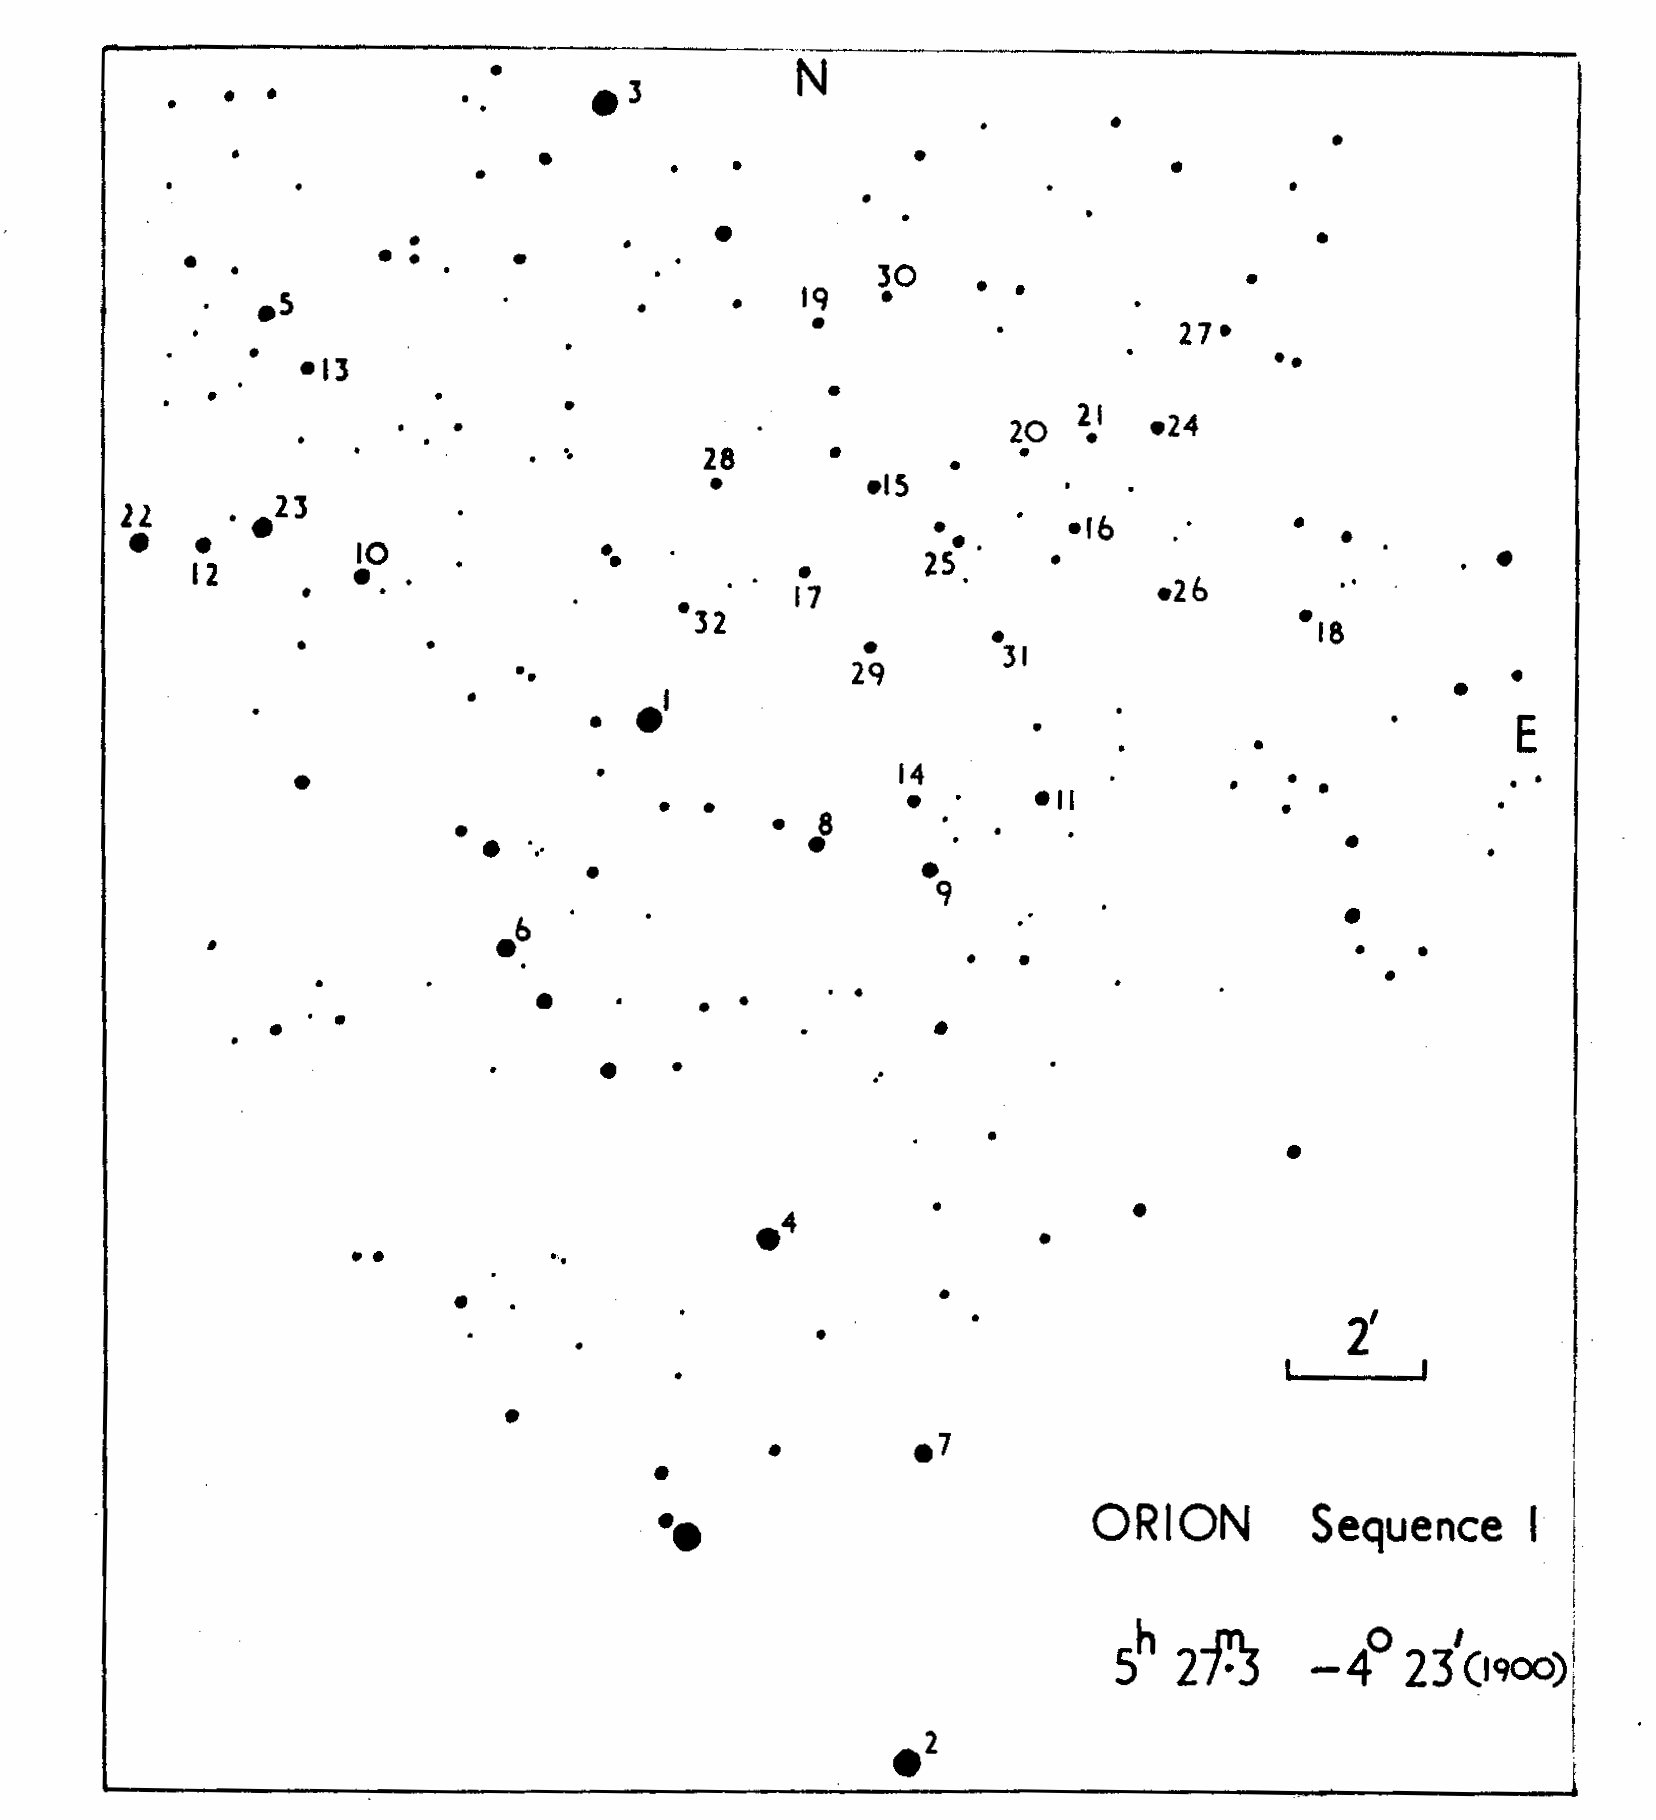 Fig. 1. Sequence stars (Centre R. A. 5h 27.3m, Dec. -4 deg 23 sec, 1900)
My original intention was to extend Mendoza's photoelectric work in Orion
to flare stars with V = 16m in four bands, U, B, V and R, using the 60-inch
reflector of the Boyden Observatory. This initial work was abandoned as
being far too time-consuming for a substantial number of stars to be measured
with sufficient accuracy. Instead, photographic photometry, based on
a new photoelectric sequence, was attempted for those stars only slightly
affected by nebulosity. Correction for small variations in nebulous fog has
been successfully applied using an empirical technique developed for ADH
Baker-Schmidt plates by C. J. Butler at Dunsink Observatory (private
communication). In this report is presented the first part of the
reduced material only, with a brief discussion of the photographic
accuracy, and the applications and limitations of broad-band photometry
applied to flare stars.
Table 1a
Photoelectric Sequence
No. P V V-R B-V U-B n V' (V-R)' (B-V)' (U-B)'
1 866 8.769m 0.887m 1.219m 1.263 6 primary standard
2 908 8.806 0.038 -0.034 -0.199 6 primary standard
3 857 8.25 1.38 1.78 1.94 2 8.21m 1.44m 1.78m 2.16m
4 878 10.12 0.50 0.51 -0.02 1 10.10 0.49 0.57 -0.14
5 784 10.88 0.61 0.48 0.16 2 10.77 0.52 0.52 0.22
6 824 10.91 0.58 0.64 0.09 1 10.92 0.56 0.69 -0.02
7 917 11.36 0.54 0.59 0.01 1 11.29 0.47 0.73 -0.09
8 895 11.71 1.18 1.42 1.14 4 11.73 1.17 1.43 1.09
9 930 11.88 0.92 1.06 0.70 4 11.84 0.87 1.10 0.66
10 804 12.05 0.58 0.56 0.08 1 11.96 0.56 0.65 0.07
11 952 12.30 0.79 0.95 0.62 3 12.40 0.85 0.93 0.56
12 767 12.57 0.64 0.67 0.11 1 12.69 0.61 0.57 0.03
13 793 12.86 0.66 2 12.77 0.72 0.68 0.11
14 924 13.94 0.80 0.90 0.16 2 13.99 1.02 0.83 0.26
15 14.29 1.30 1.48 1.07 1 14.50 1.48 1.51 1.34
16 14.67 0.84 0.86 0.10 1 14.85 0.99 0.71 0.01
17 15.50 1.19 1.31 1.11 1 15.53 1.21 1.18 0.79
18 15.50 1.14 0.79 0.49 1 15.53 0.90 0.95 0.23
19 15.66 0.87 1 15.71 0.86 0.85 0.08
20 16.03 0.54 1.23 1 16.18 0.67 1.14 0.17
21 16.11 0.89 0.53 0.39 1 15.79 0.74 1.25 0.24
Table 1b
Photographic Sequence
No. P V' (V-R)' (B-V)' (U-B)'
22 748 10.19m 1.52m 1.78m 1.69m
23 775 10.22 0.20 0.20 0.10
24 979 14.41 0.98 0.82 0.13
25 936 14.56 1.21 1.05 0.33
26 980 14.75 1.05 0.80 0.15
27 15.75 1.13 1.22 0.54
28 15.77 1.00 1.11 0.31
29 15.90 0.38 1.44 0.38
30 16.01 0.92 1.12 0.43
31 16.05 0.76 1.09 0.20
32 16.12 0.69 1.15 0.32
The Boyden 60-inch reflector, freshly aluminized, was equipped with an
E.M.I. 9558 QA photomultiplier, magnetically-shielded and cooled to 0 deg C,
with sensitivity ranging from the ultraviolet to the near-infrared. The
following filter combinations were used which allow reproduction of the
standard system of Johnson et al. (1966), and remove the red leak:
U 1 mm UG 2 + 2.5 mm 80% saturated CuSO_4 soln. at 15 deg C
B 1 mm BG 12 + 2 mm GG 13 + 1 mm BG 18
V 2 mm GG 14 + 2 mm BG 18.
R 2 mm RG 5
The effective wavelength of the red filter-tube combination at about
7150 A is 150 A longward of Johnson's value, cutting off the H-alpha line.
The magnitude sequence extends to 17.9m, 17.2m, 16.1m and 15.5m in
U, B, V and R, respectively. Colour transformations were studied for dwarf and
giant stars to a redward limit of 1.8m, 1.6m and 1.5m, in U-B, B-V and V-R,
respectively. The effects of reddening and peculiar spectra have not yet been
examined. Nightly-determined zero-points and extinction coefficients (with
second-order colour dependence in V and B-V only) were used together with
colour equations derived during the same observing period. For the faint
R-scale extension, a 4-magnitude perforated aperture-screen was employed
at the 60-inch to first establish V-R colours for primary standards at about
V = 9m, using the Arizona Tonantzintla Catalogue stars (Johnson, 1966).
The sequence is given in Table 1a. The columns give 1) Reference number as per
Finding Chart (Fig. 1), 2) Parenago's (1954) designation, 3) to 6) Photoelectric
magnitudes and colours, 7) Number of observations, 8) Photographically-smoothed
magnitudes and colours (not used in, the present work). A photographic
interpolation to a number of other stars in the field of the sequence is added
in Table 1b. The probable errors for the primary standards in V, U-B, B-V and
V-R are +-0.014m, +-0.035m, +-0.007m and +-0.018m, respectively, and for
the faint end of the sequence, about five times these values.
A large number of scattered photoelectric standards were also set up in
the Orion region for the study of photographic colour-corrections, field-errors
etc. The agreement with the work of Johnson (1957), Sharpless (1952, 1954, 1962)
and Lee (1968), for a number of common stars, was within the errors of
measurement. A few additional stars taken from their work were consequently used
in the photographic reductions but given one-third weight to reduce possible
systematic effects across our plates.
PHOTOGRAPHIC MATERIAL
Over a period of two months, 76 plates were taken at the ADH 32/36-inch
Baker-Schmidt telescope, with the following plate-filter combinations as
frequently as possible on the same night:
U 103a-O + 2 mm UG 2.
B IIa-O + 1 mm BG 12 + 2 mm GG 18
V 103-aD + 2 mm GG 11
IIa-D
R 103a-U + RG 1.
The present discussion is limited to three sets of UBVR plates and another
single V plate, with the centre, R.A. 5h30.0m, Dec. -5.0, Equinox 1900.
Several different exposure times, ranging from 7 to 59 minutes, were taken on
each emulsion in order to study the effects of nebulous fog. Fuller details are
given later in Table 2.
PLATE MEASUREMENT AND REDUCTION
A maximum number of 303 stars, depending on the emulsion and
exposure time, has been measured on the above plates using the Sartorius
iris-photometer of Armagh Observatory. This number comprises 113 flare
stars, 43 other Orion variables, 99 photoelectric standards and 48 control
stars of unknown magnitude. For each star a mean measure of the neighbouring
fog-density (W) on an arbitrary scales was made, after completion of the
iris measurement (diam.) for the whole plate, by wedge photometry of the densest
plates. Differences due to sky fog from plate to plate of the same emulsion
were shown to be negligible compared with the nebulous-fog. An X and Y
measure for each star was also made with an arbitrary centre of co-ordinates.
Basically, Butler's ADH plate reduction technique involves a least-square
solution for the coefficients in normal equations of the form:
p.e. mag + F(diam.) + G(X, Y) + K(Col) + L(Den) + const = 0
where the functions, F, G, K and L, are carried to as high an order as required
for a satisfactory solution. See Remarks under Table 2. In fact, the solution
is built up step by step, with attention to stars with exceptional residuals,
delta m (p.g. - p.e.), with the solution for position, colour-and density-dependence
limited to stars with magnitude brighter than 15.5m, and with a system of
weighting to ensure that the final calibration curve is dominated by stars of
the p.e. sequence. The reduction for a set of UBVR plates is illustrated in
Fig. 2 showing the accuracy attainable with the densest of our plates. Table 2
summarizes the colour and density coefficients used in calculating photographic
magnitudes, and gives r.m.s. errors in the fitting of the final calibration
curve. All least-square solutions were performed on the I.B.M. 1620 computer
of Dunsink Observatory.
From a comparison of the derived magnitudes for non-standard stars from each
series of plates a general empirical limit for an acceptable background-density
variation was set. This was found to correspond to a maximum magnitude-correction
of 0.5m (for density alone). By contrast, final magnitudes of these stars
agreed, then, to better than +-0.1m from one series to another. The fog-image
interaction is, thereby, not directly studied. Practically the
full field of an ADH plate (16 X 16 sq. cms.) within an area of 6 sq. degs.,
could be utilized to yield magnitudes and colours with probable errors less than
+-0.1m to V = 16m, indicating that field errors were well corrected. The value
of these results to this order of accuracy is evident in the colour-magnitude
diagrams for the Orion flare stars.
Fig. 1. Sequence stars (Centre R. A. 5h 27.3m, Dec. -4 deg 23 sec, 1900)
My original intention was to extend Mendoza's photoelectric work in Orion
to flare stars with V = 16m in four bands, U, B, V and R, using the 60-inch
reflector of the Boyden Observatory. This initial work was abandoned as
being far too time-consuming for a substantial number of stars to be measured
with sufficient accuracy. Instead, photographic photometry, based on
a new photoelectric sequence, was attempted for those stars only slightly
affected by nebulosity. Correction for small variations in nebulous fog has
been successfully applied using an empirical technique developed for ADH
Baker-Schmidt plates by C. J. Butler at Dunsink Observatory (private
communication). In this report is presented the first part of the
reduced material only, with a brief discussion of the photographic
accuracy, and the applications and limitations of broad-band photometry
applied to flare stars.
Table 1a
Photoelectric Sequence
No. P V V-R B-V U-B n V' (V-R)' (B-V)' (U-B)'
1 866 8.769m 0.887m 1.219m 1.263 6 primary standard
2 908 8.806 0.038 -0.034 -0.199 6 primary standard
3 857 8.25 1.38 1.78 1.94 2 8.21m 1.44m 1.78m 2.16m
4 878 10.12 0.50 0.51 -0.02 1 10.10 0.49 0.57 -0.14
5 784 10.88 0.61 0.48 0.16 2 10.77 0.52 0.52 0.22
6 824 10.91 0.58 0.64 0.09 1 10.92 0.56 0.69 -0.02
7 917 11.36 0.54 0.59 0.01 1 11.29 0.47 0.73 -0.09
8 895 11.71 1.18 1.42 1.14 4 11.73 1.17 1.43 1.09
9 930 11.88 0.92 1.06 0.70 4 11.84 0.87 1.10 0.66
10 804 12.05 0.58 0.56 0.08 1 11.96 0.56 0.65 0.07
11 952 12.30 0.79 0.95 0.62 3 12.40 0.85 0.93 0.56
12 767 12.57 0.64 0.67 0.11 1 12.69 0.61 0.57 0.03
13 793 12.86 0.66 2 12.77 0.72 0.68 0.11
14 924 13.94 0.80 0.90 0.16 2 13.99 1.02 0.83 0.26
15 14.29 1.30 1.48 1.07 1 14.50 1.48 1.51 1.34
16 14.67 0.84 0.86 0.10 1 14.85 0.99 0.71 0.01
17 15.50 1.19 1.31 1.11 1 15.53 1.21 1.18 0.79
18 15.50 1.14 0.79 0.49 1 15.53 0.90 0.95 0.23
19 15.66 0.87 1 15.71 0.86 0.85 0.08
20 16.03 0.54 1.23 1 16.18 0.67 1.14 0.17
21 16.11 0.89 0.53 0.39 1 15.79 0.74 1.25 0.24
Table 1b
Photographic Sequence
No. P V' (V-R)' (B-V)' (U-B)'
22 748 10.19m 1.52m 1.78m 1.69m
23 775 10.22 0.20 0.20 0.10
24 979 14.41 0.98 0.82 0.13
25 936 14.56 1.21 1.05 0.33
26 980 14.75 1.05 0.80 0.15
27 15.75 1.13 1.22 0.54
28 15.77 1.00 1.11 0.31
29 15.90 0.38 1.44 0.38
30 16.01 0.92 1.12 0.43
31 16.05 0.76 1.09 0.20
32 16.12 0.69 1.15 0.32
The Boyden 60-inch reflector, freshly aluminized, was equipped with an
E.M.I. 9558 QA photomultiplier, magnetically-shielded and cooled to 0 deg C,
with sensitivity ranging from the ultraviolet to the near-infrared. The
following filter combinations were used which allow reproduction of the
standard system of Johnson et al. (1966), and remove the red leak:
U 1 mm UG 2 + 2.5 mm 80% saturated CuSO_4 soln. at 15 deg C
B 1 mm BG 12 + 2 mm GG 13 + 1 mm BG 18
V 2 mm GG 14 + 2 mm BG 18.
R 2 mm RG 5
The effective wavelength of the red filter-tube combination at about
7150 A is 150 A longward of Johnson's value, cutting off the H-alpha line.
The magnitude sequence extends to 17.9m, 17.2m, 16.1m and 15.5m in
U, B, V and R, respectively. Colour transformations were studied for dwarf and
giant stars to a redward limit of 1.8m, 1.6m and 1.5m, in U-B, B-V and V-R,
respectively. The effects of reddening and peculiar spectra have not yet been
examined. Nightly-determined zero-points and extinction coefficients (with
second-order colour dependence in V and B-V only) were used together with
colour equations derived during the same observing period. For the faint
R-scale extension, a 4-magnitude perforated aperture-screen was employed
at the 60-inch to first establish V-R colours for primary standards at about
V = 9m, using the Arizona Tonantzintla Catalogue stars (Johnson, 1966).
The sequence is given in Table 1a. The columns give 1) Reference number as per
Finding Chart (Fig. 1), 2) Parenago's (1954) designation, 3) to 6) Photoelectric
magnitudes and colours, 7) Number of observations, 8) Photographically-smoothed
magnitudes and colours (not used in, the present work). A photographic
interpolation to a number of other stars in the field of the sequence is added
in Table 1b. The probable errors for the primary standards in V, U-B, B-V and
V-R are +-0.014m, +-0.035m, +-0.007m and +-0.018m, respectively, and for
the faint end of the sequence, about five times these values.
A large number of scattered photoelectric standards were also set up in
the Orion region for the study of photographic colour-corrections, field-errors
etc. The agreement with the work of Johnson (1957), Sharpless (1952, 1954, 1962)
and Lee (1968), for a number of common stars, was within the errors of
measurement. A few additional stars taken from their work were consequently used
in the photographic reductions but given one-third weight to reduce possible
systematic effects across our plates.
PHOTOGRAPHIC MATERIAL
Over a period of two months, 76 plates were taken at the ADH 32/36-inch
Baker-Schmidt telescope, with the following plate-filter combinations as
frequently as possible on the same night:
U 103a-O + 2 mm UG 2.
B IIa-O + 1 mm BG 12 + 2 mm GG 18
V 103-aD + 2 mm GG 11
IIa-D
R 103a-U + RG 1.
The present discussion is limited to three sets of UBVR plates and another
single V plate, with the centre, R.A. 5h30.0m, Dec. -5.0, Equinox 1900.
Several different exposure times, ranging from 7 to 59 minutes, were taken on
each emulsion in order to study the effects of nebulous fog. Fuller details are
given later in Table 2.
PLATE MEASUREMENT AND REDUCTION
A maximum number of 303 stars, depending on the emulsion and
exposure time, has been measured on the above plates using the Sartorius
iris-photometer of Armagh Observatory. This number comprises 113 flare
stars, 43 other Orion variables, 99 photoelectric standards and 48 control
stars of unknown magnitude. For each star a mean measure of the neighbouring
fog-density (W) on an arbitrary scales was made, after completion of the
iris measurement (diam.) for the whole plate, by wedge photometry of the densest
plates. Differences due to sky fog from plate to plate of the same emulsion
were shown to be negligible compared with the nebulous-fog. An X and Y
measure for each star was also made with an arbitrary centre of co-ordinates.
Basically, Butler's ADH plate reduction technique involves a least-square
solution for the coefficients in normal equations of the form:
p.e. mag + F(diam.) + G(X, Y) + K(Col) + L(Den) + const = 0
where the functions, F, G, K and L, are carried to as high an order as required
for a satisfactory solution. See Remarks under Table 2. In fact, the solution
is built up step by step, with attention to stars with exceptional residuals,
delta m (p.g. - p.e.), with the solution for position, colour-and density-dependence
limited to stars with magnitude brighter than 15.5m, and with a system of
weighting to ensure that the final calibration curve is dominated by stars of
the p.e. sequence. The reduction for a set of UBVR plates is illustrated in
Fig. 2 showing the accuracy attainable with the densest of our plates. Table 2
summarizes the colour and density coefficients used in calculating photographic
magnitudes, and gives r.m.s. errors in the fitting of the final calibration
curve. All least-square solutions were performed on the I.B.M. 1620 computer
of Dunsink Observatory.
From a comparison of the derived magnitudes for non-standard stars from each
series of plates a general empirical limit for an acceptable background-density
variation was set. This was found to correspond to a maximum magnitude-correction
of 0.5m (for density alone). By contrast, final magnitudes of these stars
agreed, then, to better than +-0.1m from one series to another. The fog-image
interaction is, thereby, not directly studied. Practically the
full field of an ADH plate (16 X 16 sq. cms.) within an area of 6 sq. degs.,
could be utilized to yield magnitudes and colours with probable errors less than
+-0.1m to V = 16m, indicating that field errors were well corrected. The value
of these results to this order of accuracy is evident in the colour-magnitude
diagrams for the Orion flare stars.
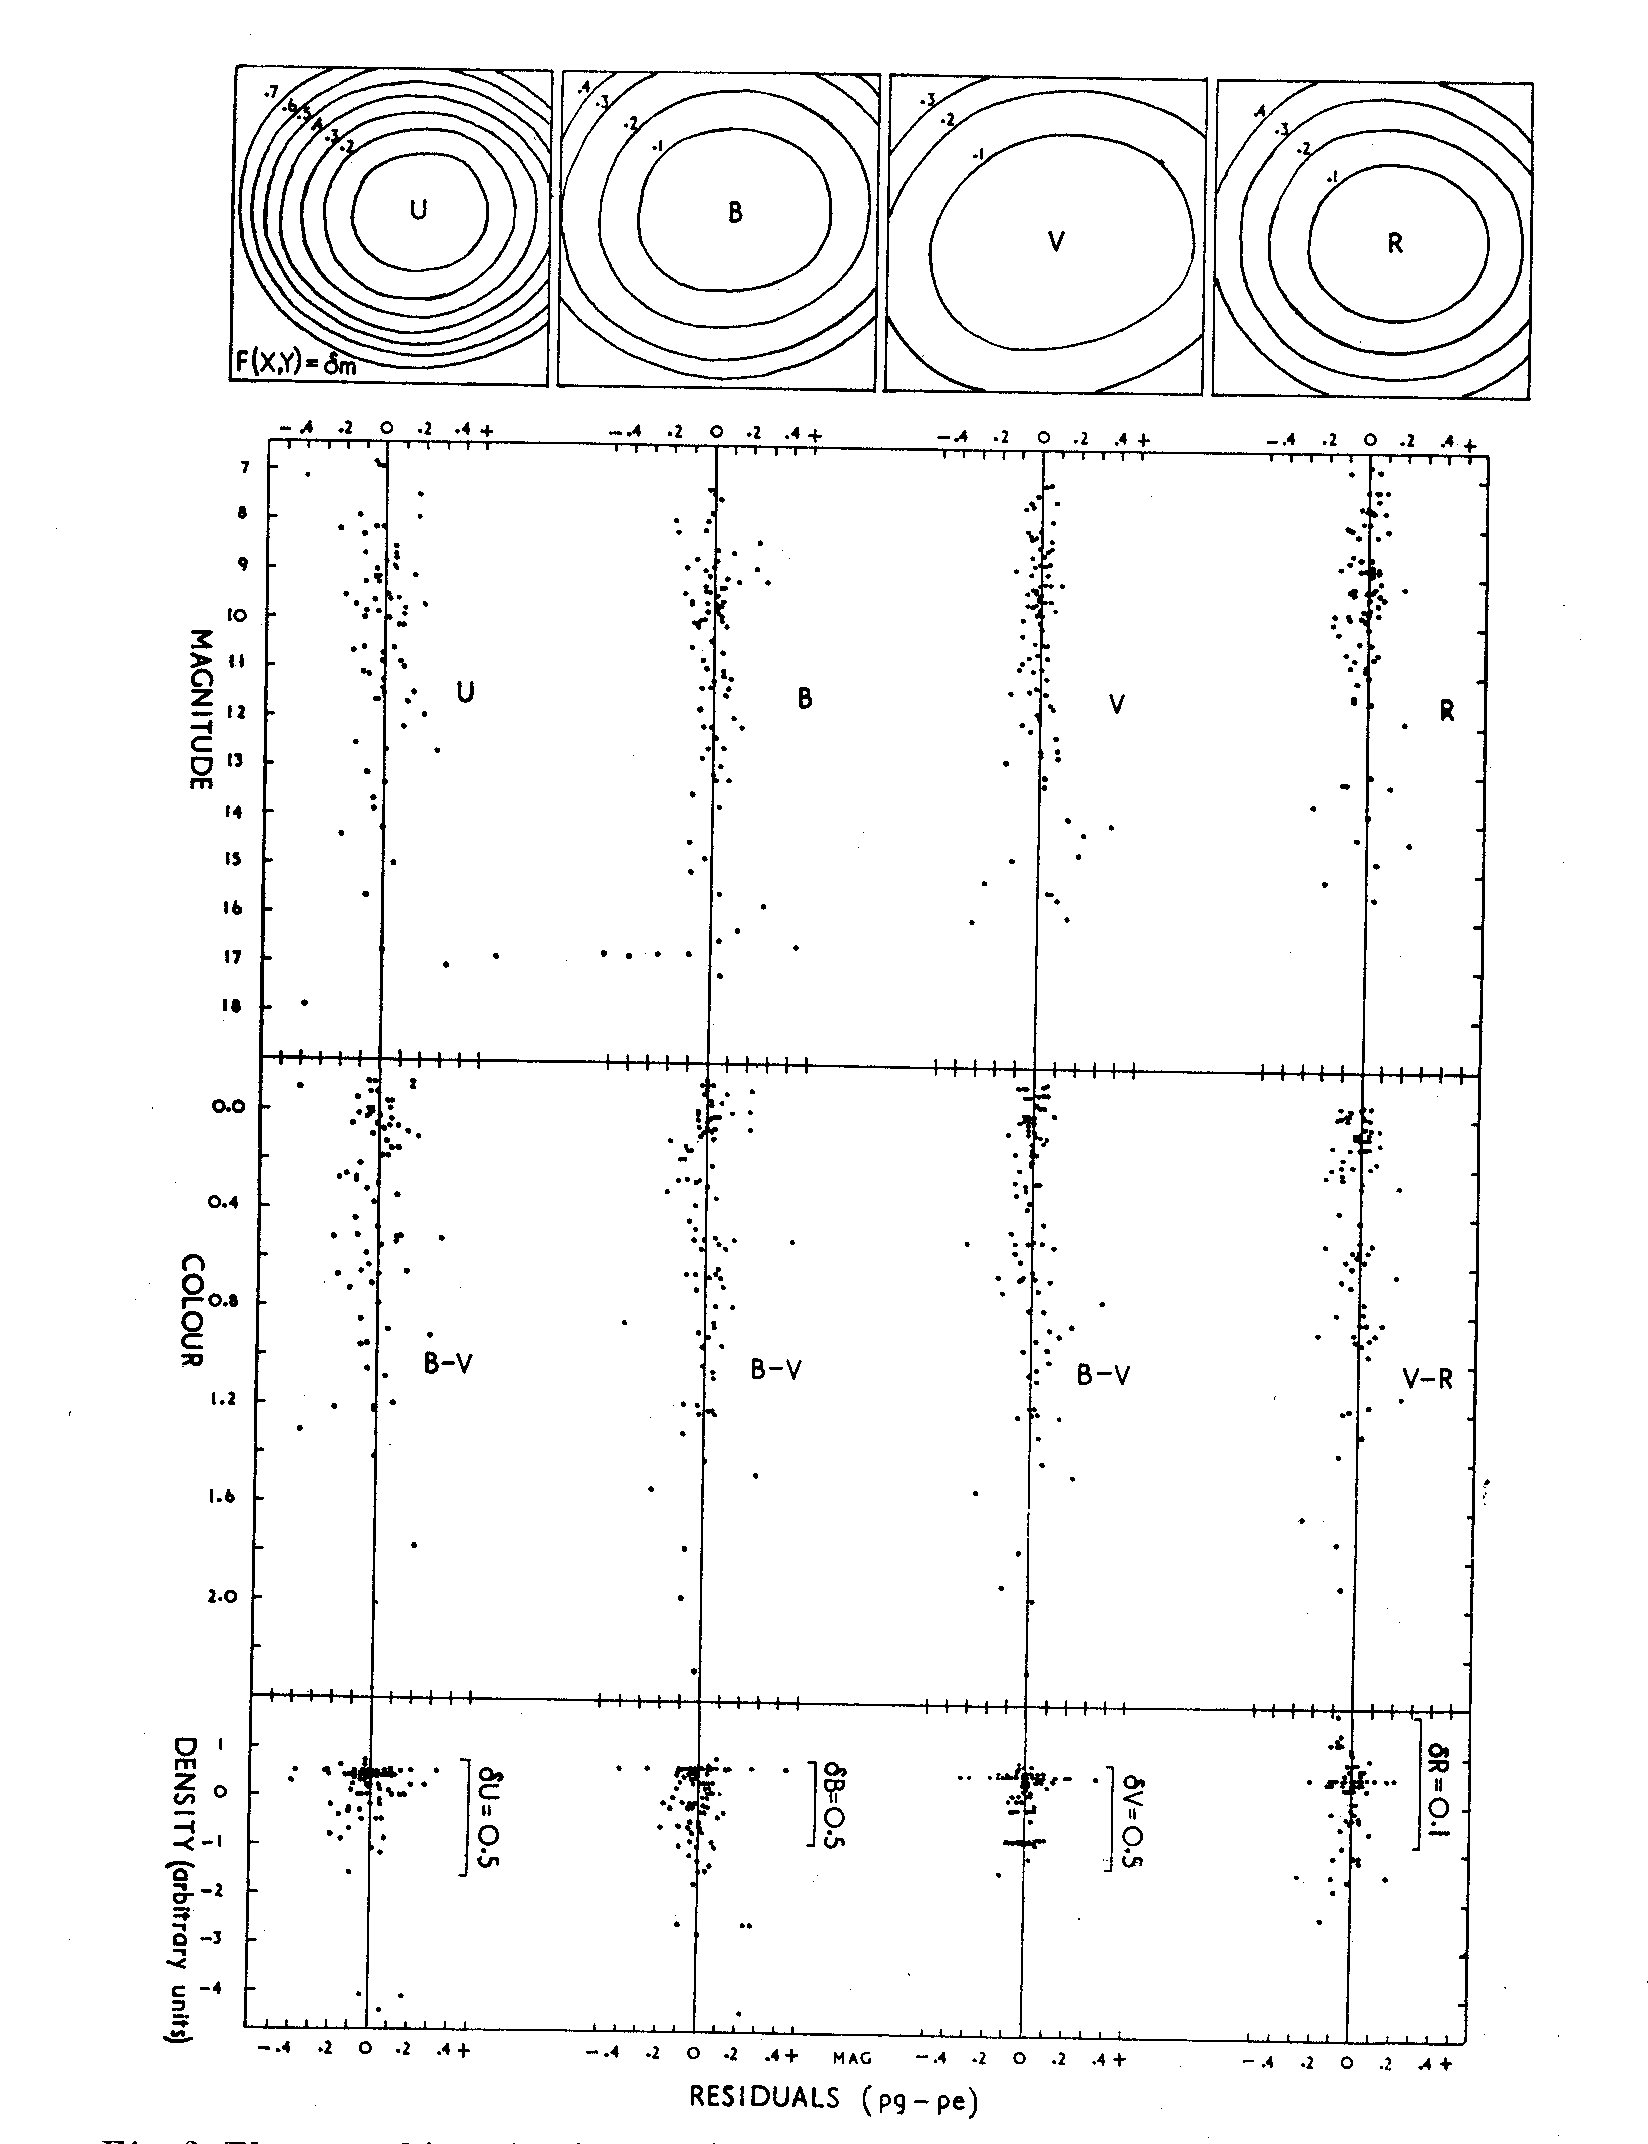 Fig. 2. Photographic reductions of ADH Baker-Schmidt plates (Nos. 8282, 8279, 8278
and 8280) showing field-correction contours in tenths of a magnitude over an area of
2.9 X 2.9 sq. degs., and photographic minus photoelectric magnitude residuals as a
function of magnitude, colour and background density. See Table 2.
Table 2
Summary of Photographic Data: Colour and Density Coefficients
and r. m. s. Errors of Calibration Curves
ADH Plate No. 8314 8345 8282 8313 8343 8279 8311
J.D. -2439400 52.072d 68.957d 43.067d 52.058d 68.897d 42.946d 52.028d
Exp. (filter) 15m(U) 40m(U) 59m(U) 7m(B) 20m(B) 31m(B) 7m(V)
k = Col. coeff. -0.013 -0.047 -0.037 -0.157 -0.116 -0.149 0.109
l = Den. coeff. -0.055 -0.157 -0.211 -0.019 -0.209 -0.291 -0.083
r. m. s. error +-0.075m +-0.094m +-0.163m +-0.112m +-0.064m +-0.082m +-0.070m
ADH Plate No. 8278 8341 8364 8312 8346 8280
J.D. -2439400 42.916d 68.863d 96.792d 52.043d 68.997d 42.997d
Exp. (filter) 15m(V) 21m(V) 30m(V)* 15m(R) 40m(R) 59m(R)
k = Col. coeff. -0.169 0.166 0.166 -0.071 -0.038 -0.033
l = Den. coeff. -0.232 -0.288 -0.304 -0.004 -0.046 -0.037
r. m. s. error +-0.081m +-0.096m +-0.085m +-0.086m +-0.090m +-0.084m
Remarks to Table 2
Photographic magnitudes (U, B and V) are derived from the following equation:
p.g.mag.= a^5+b^4+c^3+d^2+e+fX^2+gY^2+hXY+iX+jY+k(B-V)+l(W)+const.
A similar equation is used for R except that the colour, V-R, is
substituted. Since the nebulous background is most serious in the
ultraviolet, affecting both the photoelectric and photographic measures,
a U-B colour dependence was not used. After correction on the U plates
for B-V dependence, however, no further dependence on U-B was evident.
In Table 2, the colour coefficient, k, may be defined as the magnitude
correction at B-V (or V-R) = 1.0m, and the relative magnitude corrections
for density may be derived by applying the coefficient, l, to the
density scale in Fig. 2. It may be seen that the density coefficients
for a given emulsion are fairly smooth (almost linear) functions of
the exposure times. N. B. The asterisk indicates use of 103a-D instead
of the usual IIa-D emulsion employed. Also, we note that the colour
coefficients are consistent within photographic accuracies. The form of
the field corrections, G(X, Y), are, however, considerably different
from plate to plate and from emulsion to emulsion (not tabulated). This
may be due to differences in image quality, focus, plate-tilt, etc. From
the r. m. s. errors for the fitting of the final calibration curves over
the whole plate (2.9 X 2.9 sq. degs.), the plate reductions appear most
satisfactory.
COLOUR-MAGNITUDE AND COLOUR-COLOUR DIAGRAMS
In B, V and R, 68 flare stars satisfy the following conditions, a) within 85'
of the plate centre, b) background-density corrections less than 0.5m and
c) all magnitudes within the limits of the photoelectric sequence. In U, the
number is smaller, only 37. These selected flare stars have been plotted
in colour-magnitude colour-colour diagrams (Figs. 3, 4, 5 and 6), showing at
the same time the scatter in the values for the 15 plates. The zero-age
main-sequence and standard colour relations for normal, unreddened main-sequence
stars are indicated (Johnson 1963, Mendoza 1967). Also, the position
of several bright Orion stars, members of the Orion Nebula Association, is
shown in the colour-magnitude diagrams. No correction for reddening has
been attempted. Several classical flare stars (YZ CMi, AD Leo, V 1216 Sgr,
DH Car and EV Lac) have been added to the colour-colour diagrams when
the appropriate colours were available (Andrews 1968; Kunkel 1967; Tapia
1968).
Fig. 2. Photographic reductions of ADH Baker-Schmidt plates (Nos. 8282, 8279, 8278
and 8280) showing field-correction contours in tenths of a magnitude over an area of
2.9 X 2.9 sq. degs., and photographic minus photoelectric magnitude residuals as a
function of magnitude, colour and background density. See Table 2.
Table 2
Summary of Photographic Data: Colour and Density Coefficients
and r. m. s. Errors of Calibration Curves
ADH Plate No. 8314 8345 8282 8313 8343 8279 8311
J.D. -2439400 52.072d 68.957d 43.067d 52.058d 68.897d 42.946d 52.028d
Exp. (filter) 15m(U) 40m(U) 59m(U) 7m(B) 20m(B) 31m(B) 7m(V)
k = Col. coeff. -0.013 -0.047 -0.037 -0.157 -0.116 -0.149 0.109
l = Den. coeff. -0.055 -0.157 -0.211 -0.019 -0.209 -0.291 -0.083
r. m. s. error +-0.075m +-0.094m +-0.163m +-0.112m +-0.064m +-0.082m +-0.070m
ADH Plate No. 8278 8341 8364 8312 8346 8280
J.D. -2439400 42.916d 68.863d 96.792d 52.043d 68.997d 42.997d
Exp. (filter) 15m(V) 21m(V) 30m(V)* 15m(R) 40m(R) 59m(R)
k = Col. coeff. -0.169 0.166 0.166 -0.071 -0.038 -0.033
l = Den. coeff. -0.232 -0.288 -0.304 -0.004 -0.046 -0.037
r. m. s. error +-0.081m +-0.096m +-0.085m +-0.086m +-0.090m +-0.084m
Remarks to Table 2
Photographic magnitudes (U, B and V) are derived from the following equation:
p.g.mag.= a^5+b^4+c^3+d^2+e+fX^2+gY^2+hXY+iX+jY+k(B-V)+l(W)+const.
A similar equation is used for R except that the colour, V-R, is
substituted. Since the nebulous background is most serious in the
ultraviolet, affecting both the photoelectric and photographic measures,
a U-B colour dependence was not used. After correction on the U plates
for B-V dependence, however, no further dependence on U-B was evident.
In Table 2, the colour coefficient, k, may be defined as the magnitude
correction at B-V (or V-R) = 1.0m, and the relative magnitude corrections
for density may be derived by applying the coefficient, l, to the
density scale in Fig. 2. It may be seen that the density coefficients
for a given emulsion are fairly smooth (almost linear) functions of
the exposure times. N. B. The asterisk indicates use of 103a-D instead
of the usual IIa-D emulsion employed. Also, we note that the colour
coefficients are consistent within photographic accuracies. The form of
the field corrections, G(X, Y), are, however, considerably different
from plate to plate and from emulsion to emulsion (not tabulated). This
may be due to differences in image quality, focus, plate-tilt, etc. From
the r. m. s. errors for the fitting of the final calibration curves over
the whole plate (2.9 X 2.9 sq. degs.), the plate reductions appear most
satisfactory.
COLOUR-MAGNITUDE AND COLOUR-COLOUR DIAGRAMS
In B, V and R, 68 flare stars satisfy the following conditions, a) within 85'
of the plate centre, b) background-density corrections less than 0.5m and
c) all magnitudes within the limits of the photoelectric sequence. In U, the
number is smaller, only 37. These selected flare stars have been plotted
in colour-magnitude colour-colour diagrams (Figs. 3, 4, 5 and 6), showing at
the same time the scatter in the values for the 15 plates. The zero-age
main-sequence and standard colour relations for normal, unreddened main-sequence
stars are indicated (Johnson 1963, Mendoza 1967). Also, the position
of several bright Orion stars, members of the Orion Nebula Association, is
shown in the colour-magnitude diagrams. No correction for reddening has
been attempted. Several classical flare stars (YZ CMi, AD Leo, V 1216 Sgr,
DH Car and EV Lac) have been added to the colour-colour diagrams when
the appropriate colours were available (Andrews 1968; Kunkel 1967; Tapia
1968).
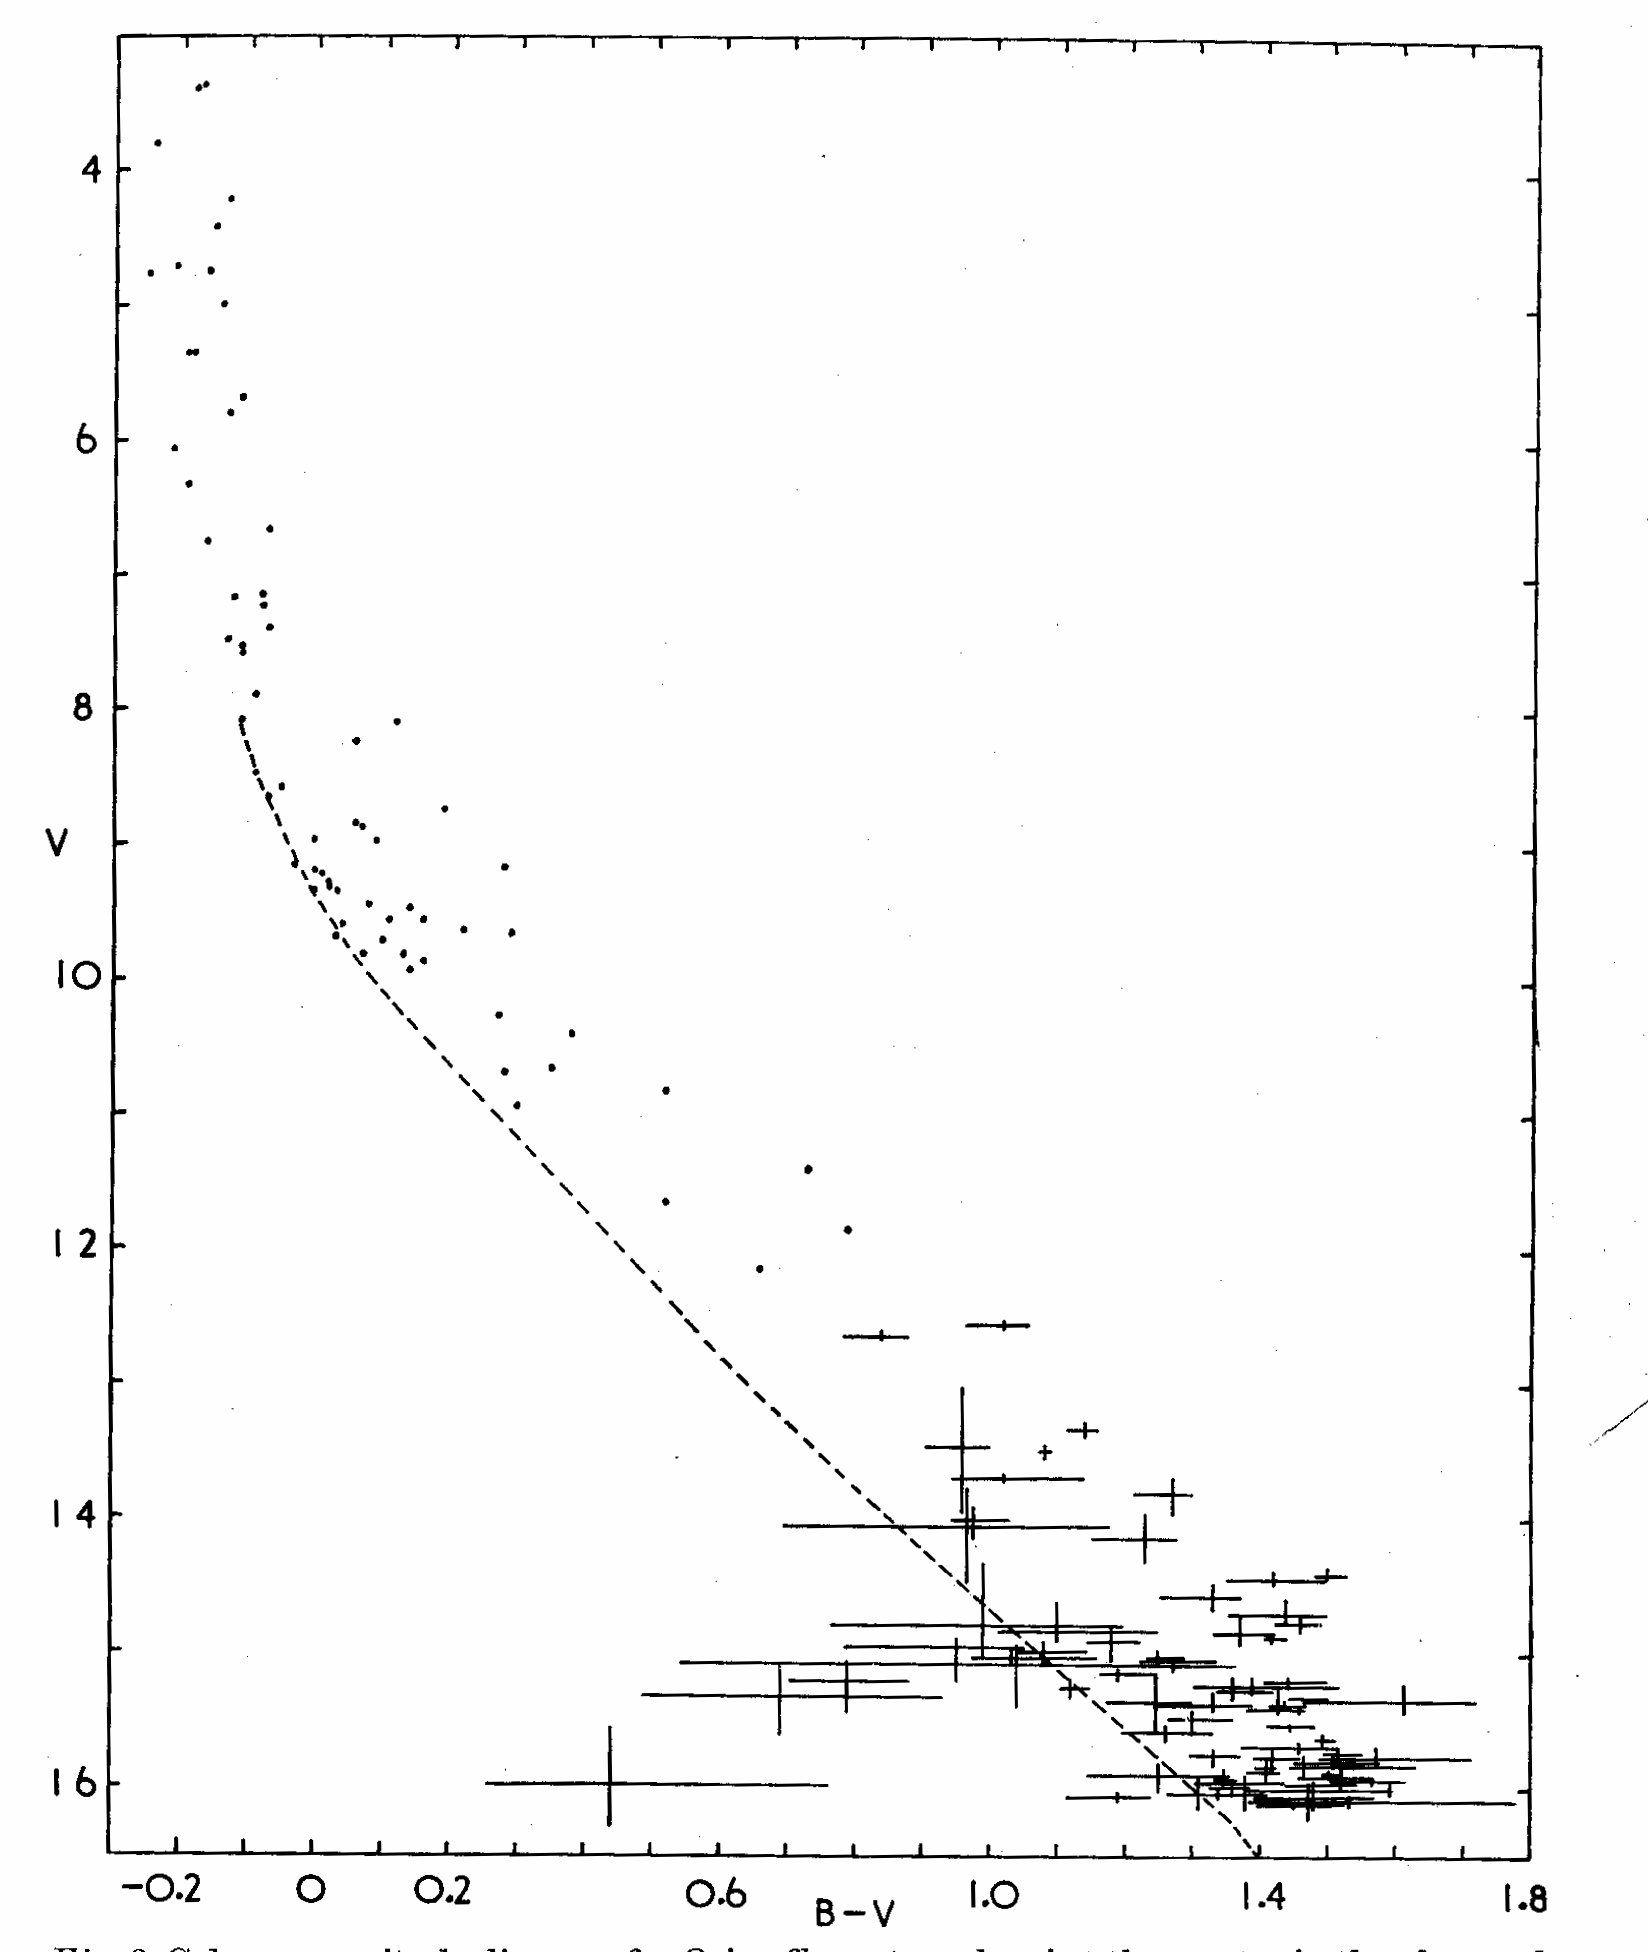 Fig. 3. Colour-magnitude diagram for Orion flare stars showing the
scatter in the observed values. The dots indicate bright members of
Orion association and the dashed line in the zero-age main sequence
using Mendoza's (1967) distance modulus of 7.9m
Fig. 3. Colour-magnitude diagram for Orion flare stars showing the
scatter in the observed values. The dots indicate bright members of
Orion association and the dashed line in the zero-age main sequence
using Mendoza's (1967) distance modulus of 7.9m
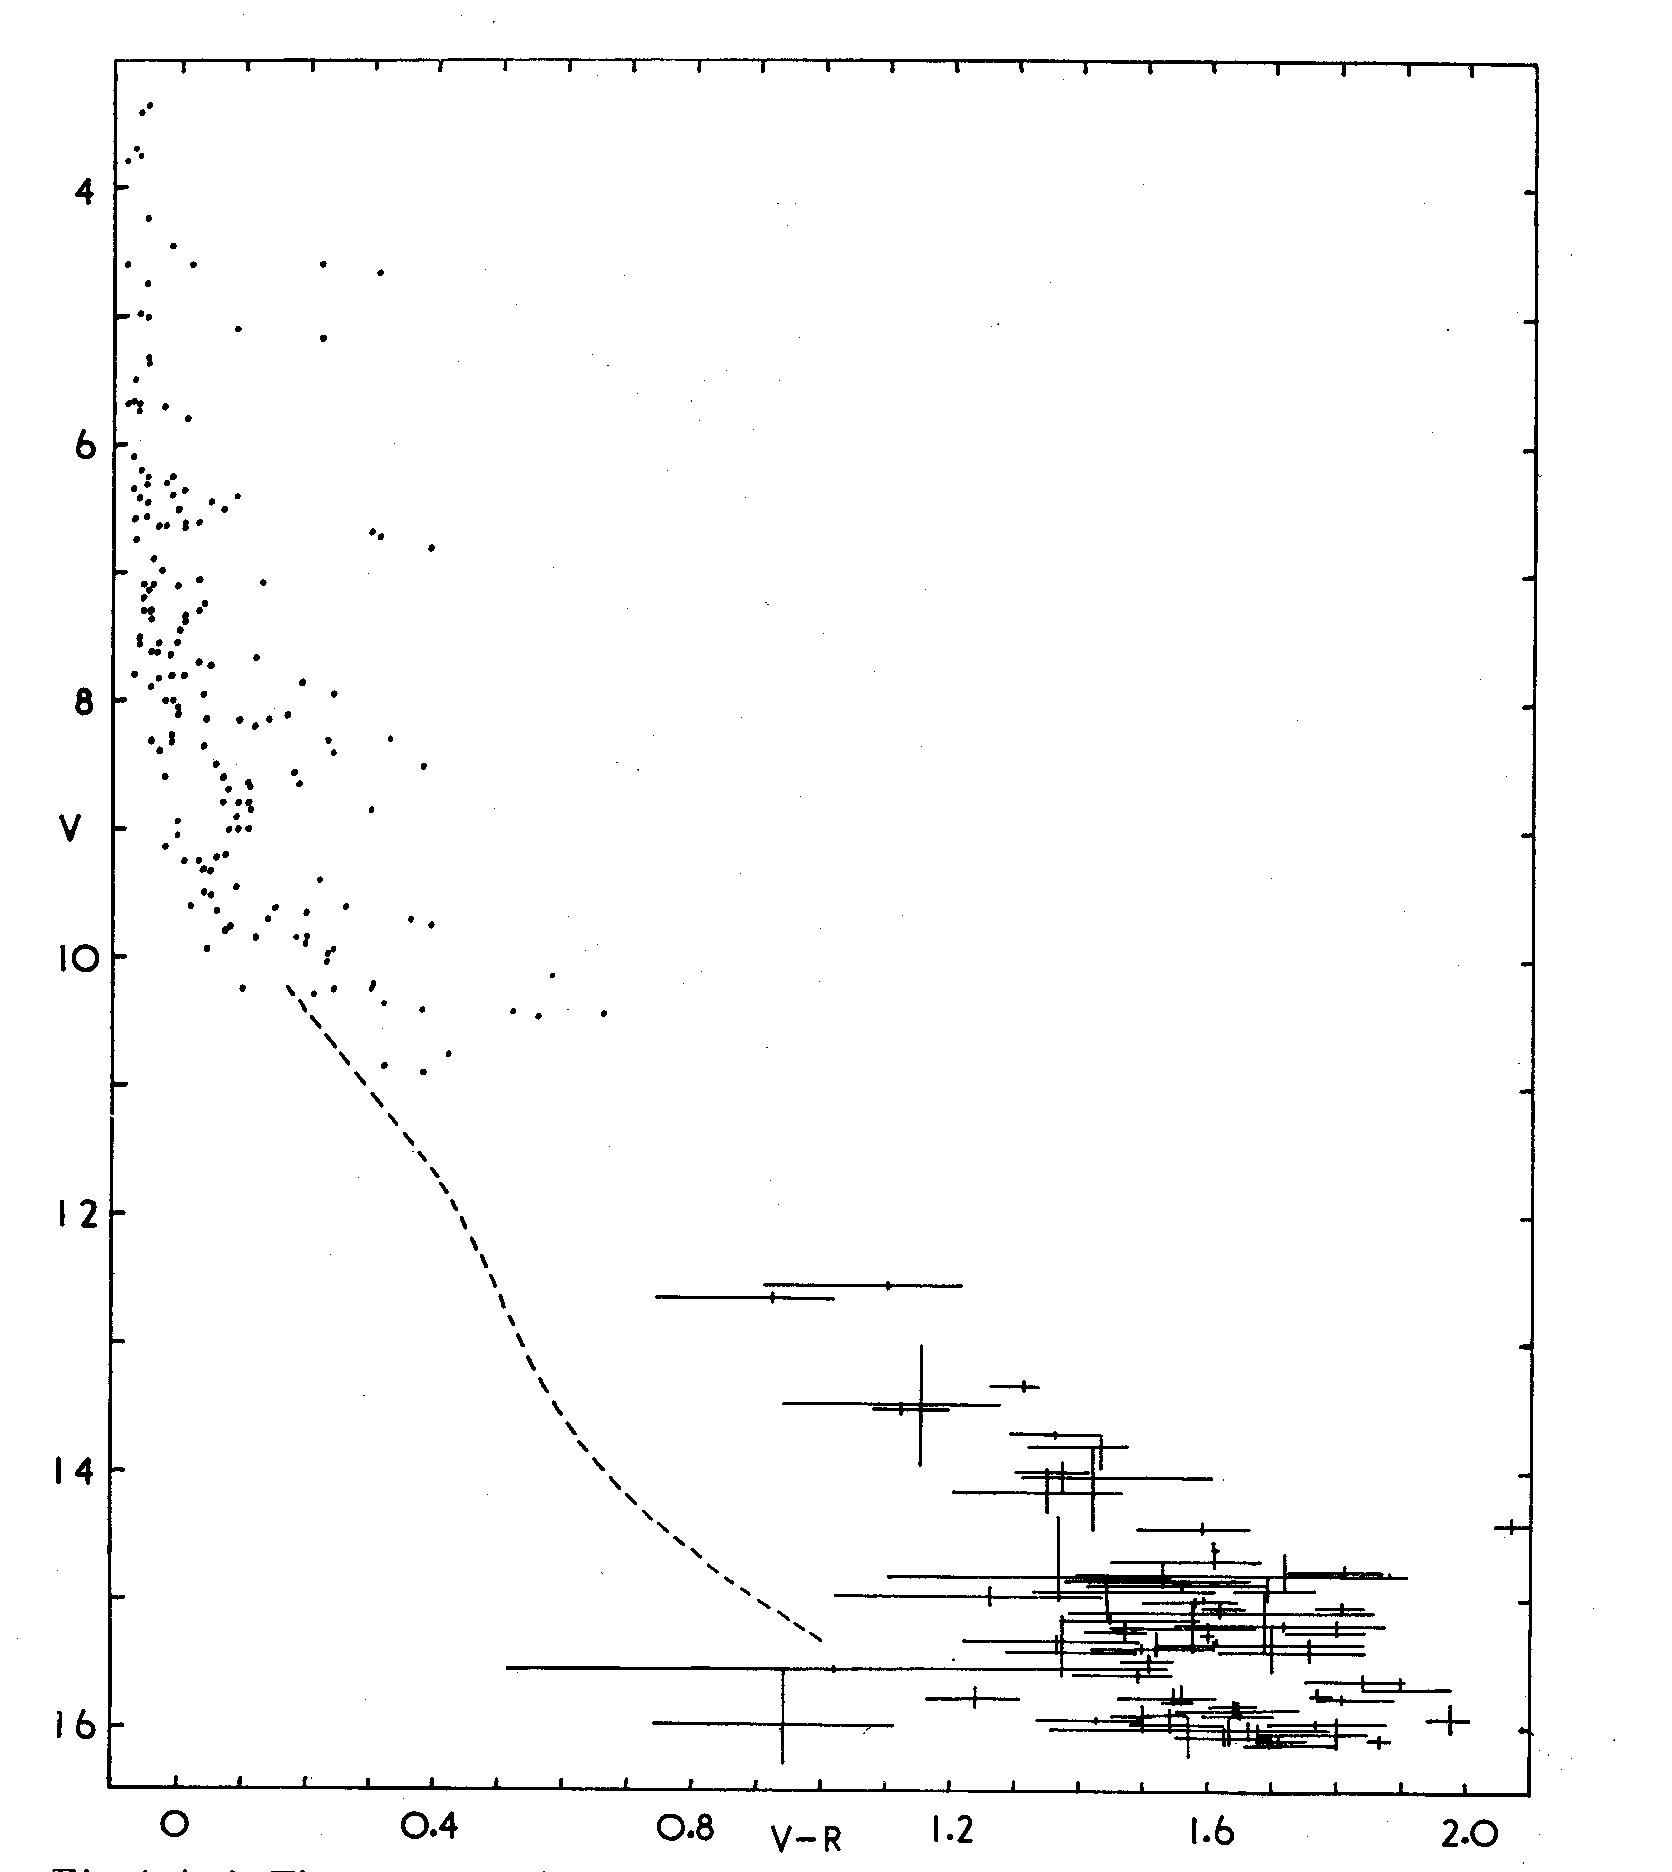 Fig. 4. As in Fig. 3. except using the V-R colour. The zero-age main-sequence
is derived using Mendoza's (1967) relation between B-V and V-R for the Hyades
cluster stars. The bright stars are taken from the work of Lee (1968).
Fig. 4. As in Fig. 3. except using the V-R colour. The zero-age main-sequence
is derived using Mendoza's (1967) relation between B-V and V-R for the Hyades
cluster stars. The bright stars are taken from the work of Lee (1968).
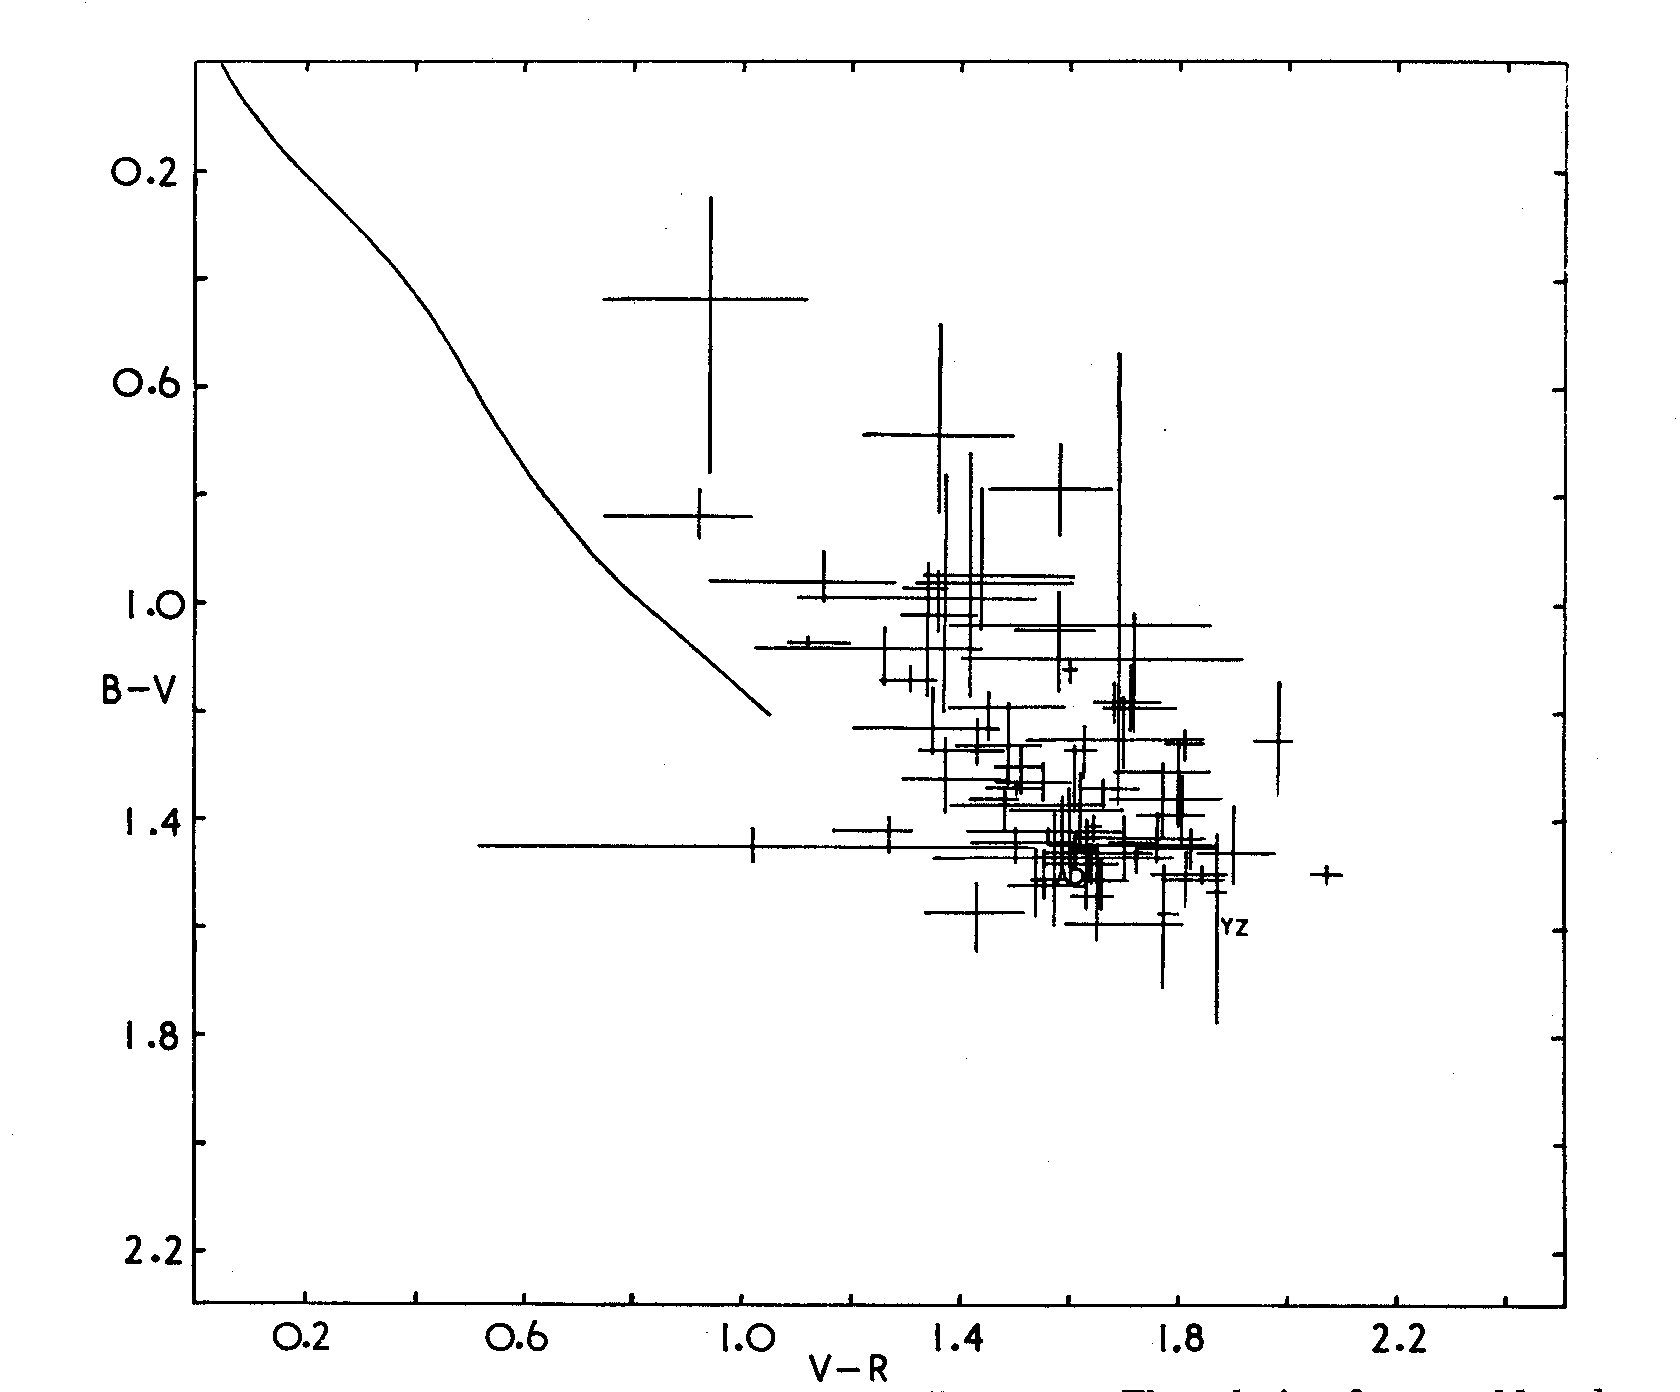 Fig. 5. The B-V/V-R diagram for the Orion flare stars. The relation for
unreddened (Hyades) stars is indicated. Also, the position of the classical
flare stars, AD Leo and YZ CMi, is shown.
Fig. 5. The B-V/V-R diagram for the Orion flare stars. The relation for
unreddened (Hyades) stars is indicated. Also, the position of the classical
flare stars, AD Leo and YZ CMi, is shown.
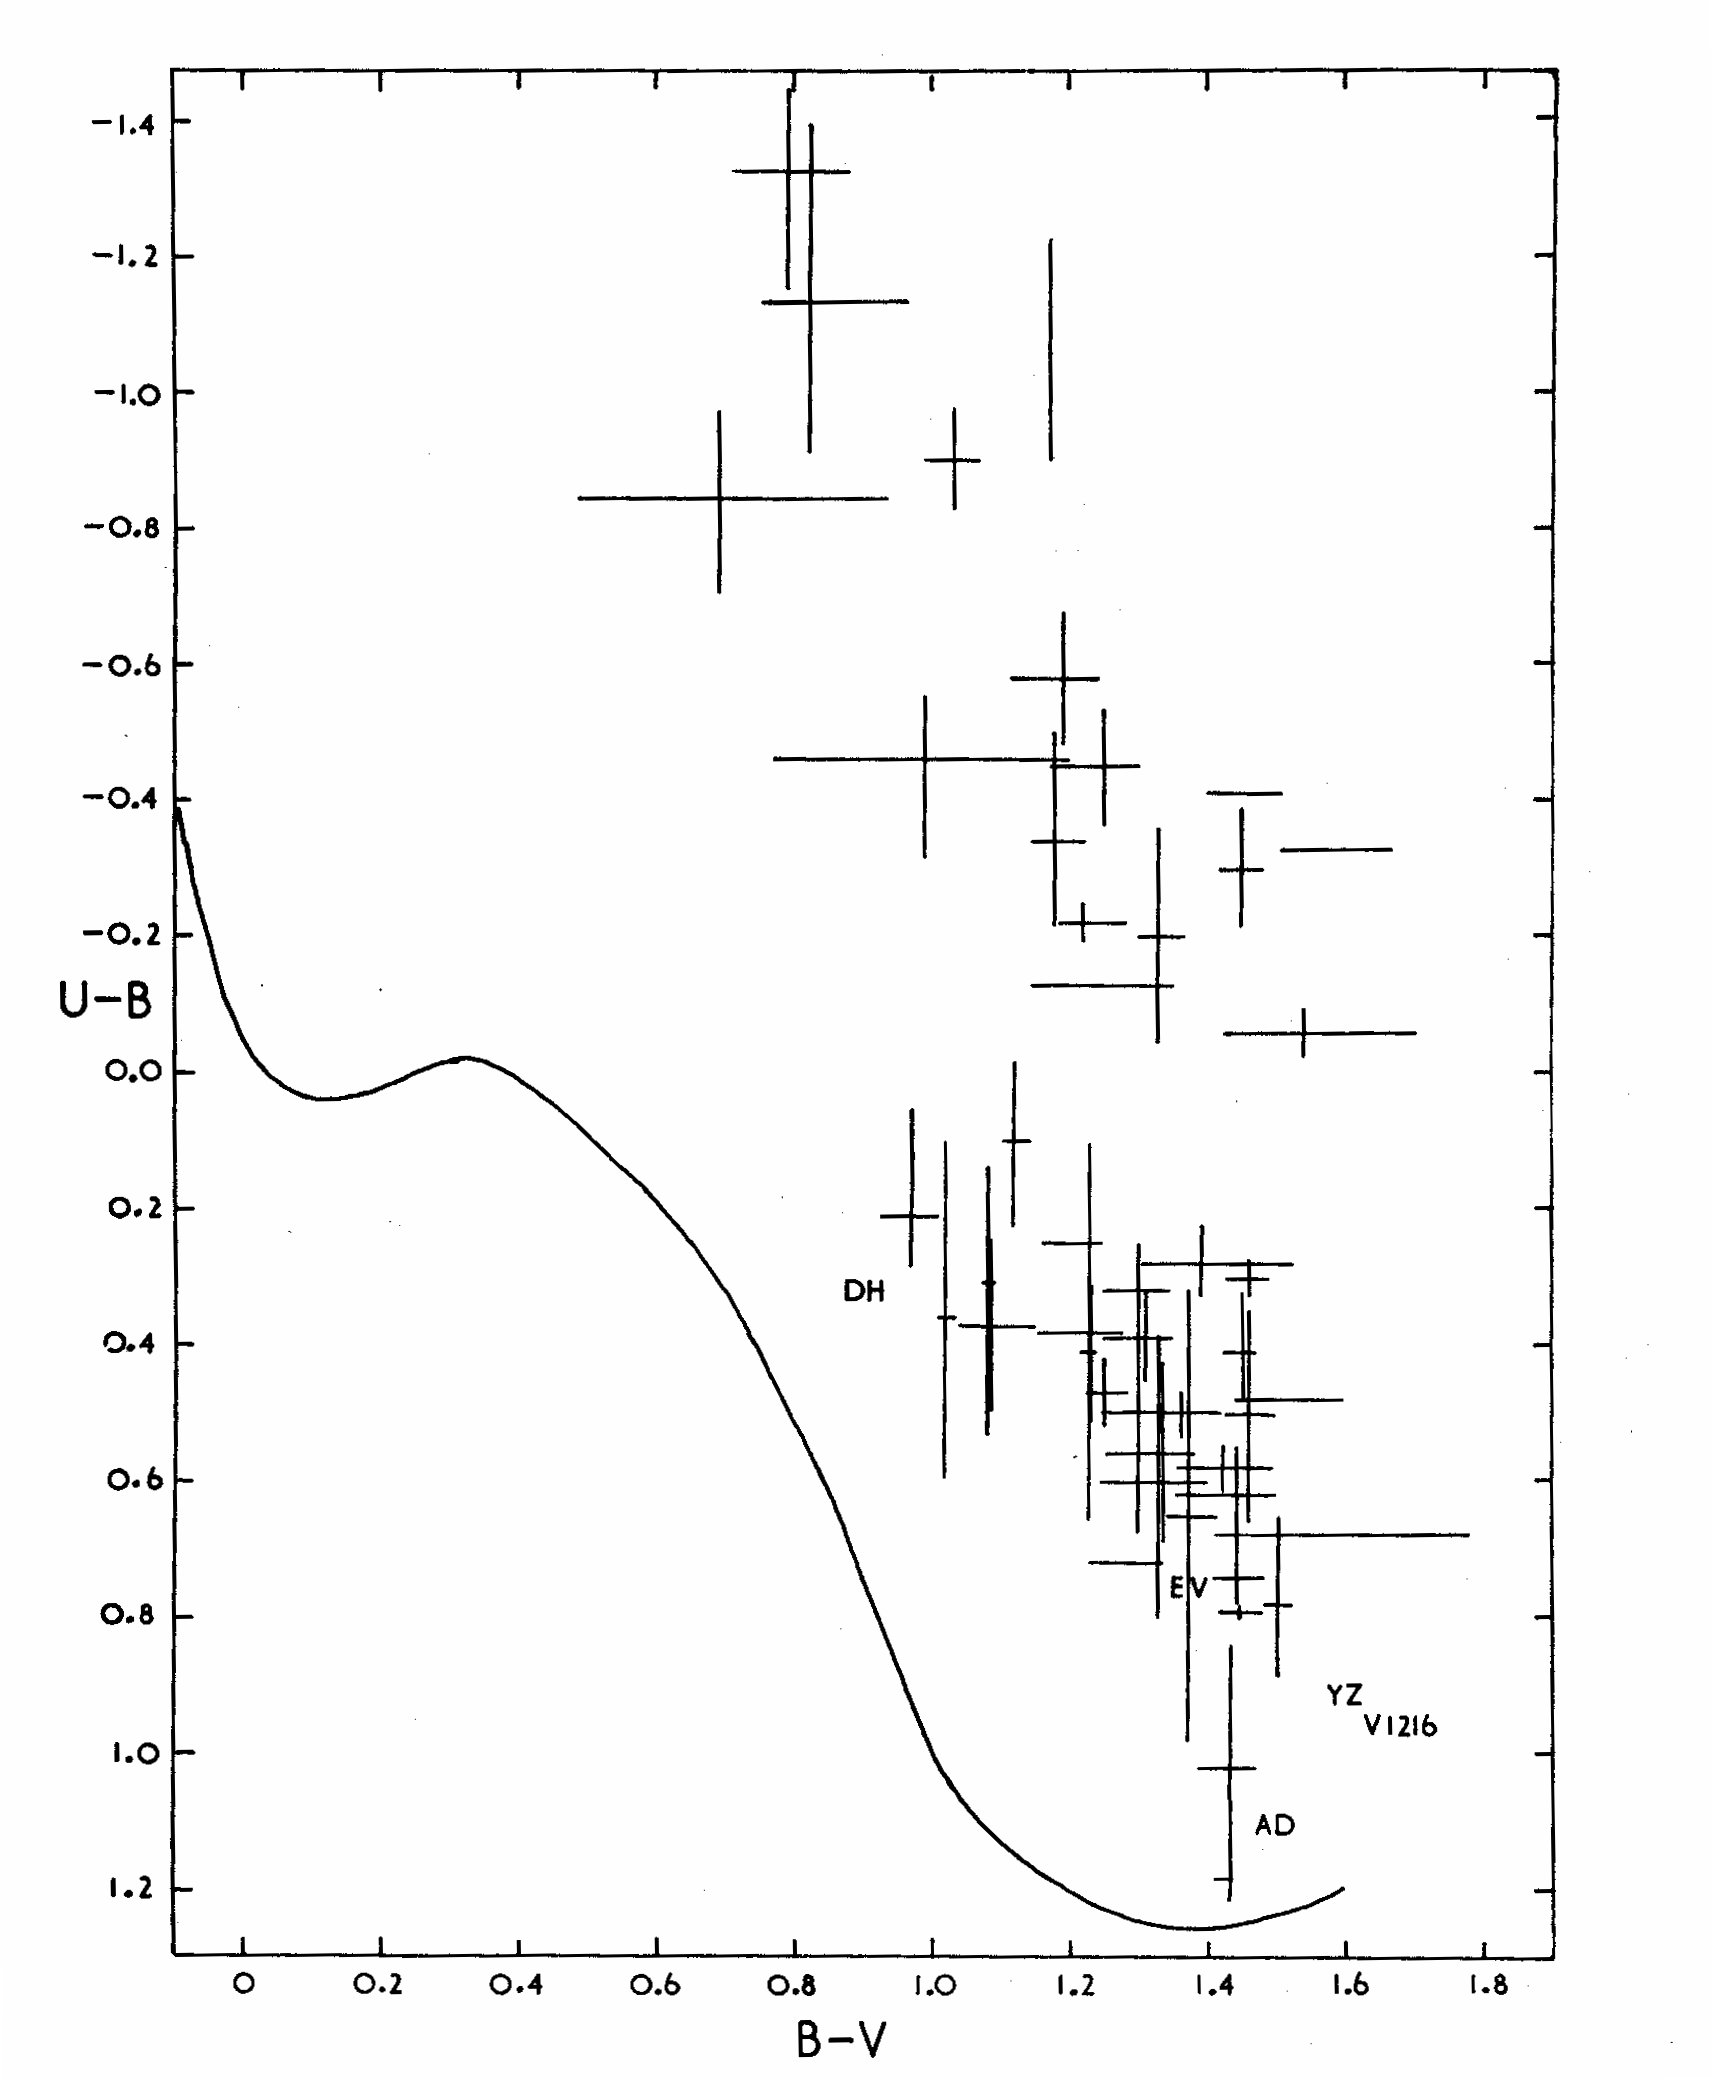 Fig. 6. The U-B/B-V diagram for the Orion flare stars. The standard colour
relation for normal, unreddened main-sequence stars is indicated. The classical
flare stars, AD Leo, YZ CMi, V 1216 Sgr, EV Lac and DH Car, are shown.
CONCLUSIONS
I) Although, as pointed out by Haro, there is considerable scatter of
the Orion flare stars about the main-sequence (See Fig. 3), this scatter is much
less-pronounced in the V-R/V diagram (Fig. 4). In fact, to V = 16m, a band
about 1 to 2 magnitudes above the main sequence is indicated using the red
colour index.
II) There is a fairly clear leftward limit of the Orion flare stars in the
V-R/V diagram at about V-R = 1.0m, defined by the brighter flare stars
of spectral type K0 to K1.
III) Half the selected flare stars showed no magnitude or colour variations
during the 2-month observing period, certainly not greater than the
probable errors of measurement. Colour variations amounting to 0.3m and
more are evident in some stars for which the plate corrections are adequate
(in the sense stated above).
IV) The classical flare stars appear to fall in the B-V/V-R diagram
within but to the red of the Orion flare-star region. In the U-B/B-V
diagram, all but DH Car fall somewhat below the reddest Orion stars. There is,
however, some doubt attached to the enormous ultraviolet colour-excesses
in some Orion flare stars, and it is impossible to decide what is a typical
U-B colour for these stars.
REMARKS CONCERNING BROAD-BAND PHOTOMETRY OF FLARE STARS
Owing to the inexact knowledge of the form of the transformations from
the instrumental to standard UBVR system for peculiar red stars, many with
emission-line spectra, comparison with other work is difficult. Also, the
physical interpretation of the results and especially their application
to problems of stellar evolution, is at present impossible. The results may,
however, be useful for the classification of flare stars amongst themselves,
and as compared with other Orion variables, notably the non-flaring
T-association stars.
ACKNOWLEDGEMENTS
I am greatly indebted to Prof. G. Haro for supplying me with finding
charts for a large number of his flare stars prior to publication. I wish to
express particular gratitude to Dr. E. M. Lindsay for his encouragement
at each stage of this work, to Prof. P. A. Wayman for the use of the Dunsink
photometer and computer, to Mr. G. J. Butler for the use of his 60-inch
colour-equations and amplifier calibrations and for his kind assistance in the
computer programming, and to Mr. M. J. Bester for a number of ADH plates
taken by him.
REFERENCES
Andrews, A. D., 1968, I.B.V.S. Nos. 265 and 273; also unpublished V-R for AD Leo.(IBVS N°.265) (IBVS N°.273)
Broglia, P. and Lenouvel, F., 1960, Mém. Soc. astr. ital. 30. 199.
Haro, G., 1968. Stars and Stellar Systems Vol. 7, 141 Univ. Chicago.
Herbig, G. H., 1962, Astrophys. J. 135, 736, Adv. Astr. Astrophys. 1, 47.
Johnson, H. L., 1957, Astrophys. J. 126, 134.
Johnson, H. L., 1963, Stars and Stellar Systems. Vol. 3. 204. Univ. Chicago.
Johnson, H. L. et al., 1966, Commun. lunar planet Lab. 4. 99.
Kholopov, P. N., 1959, Soviet Astron. A. J. 3. 291. translation.
Kunkel, W. E., 1967, Dissertation. Univ. Texas.
Lee, T. A., 1968, Astrophys. J. 152, 913.
Mendoza, E. E., 1967, Bol. Obs. Tonantzintla y Tacubaya, 4. 149.
Mendoza, E. E., 1968, Astrophys. J. 151, 977.
Mosidze, L. N. 1967, Perem. Zvezdy 16, 149.
Parenago, P., 1954, Trudy Gos. astr. Inst. Sternberga, 25.
Poveda, A., 1964, Nature 202, 1319.
Sharpless, S., 1952, Astrophys. J. 116, 251.
Sharpless, S., 1954, Astrophys. J. 119, 200.
Sharpless, S., 1962, Astrophys. J. 136, 767.
Tapia, S., 1968, I.B.V.S. No. 286. (IBVS N°.286)
Fig. 6. The U-B/B-V diagram for the Orion flare stars. The standard colour
relation for normal, unreddened main-sequence stars is indicated. The classical
flare stars, AD Leo, YZ CMi, V 1216 Sgr, EV Lac and DH Car, are shown.
CONCLUSIONS
I) Although, as pointed out by Haro, there is considerable scatter of
the Orion flare stars about the main-sequence (See Fig. 3), this scatter is much
less-pronounced in the V-R/V diagram (Fig. 4). In fact, to V = 16m, a band
about 1 to 2 magnitudes above the main sequence is indicated using the red
colour index.
II) There is a fairly clear leftward limit of the Orion flare stars in the
V-R/V diagram at about V-R = 1.0m, defined by the brighter flare stars
of spectral type K0 to K1.
III) Half the selected flare stars showed no magnitude or colour variations
during the 2-month observing period, certainly not greater than the
probable errors of measurement. Colour variations amounting to 0.3m and
more are evident in some stars for which the plate corrections are adequate
(in the sense stated above).
IV) The classical flare stars appear to fall in the B-V/V-R diagram
within but to the red of the Orion flare-star region. In the U-B/B-V
diagram, all but DH Car fall somewhat below the reddest Orion stars. There is,
however, some doubt attached to the enormous ultraviolet colour-excesses
in some Orion flare stars, and it is impossible to decide what is a typical
U-B colour for these stars.
REMARKS CONCERNING BROAD-BAND PHOTOMETRY OF FLARE STARS
Owing to the inexact knowledge of the form of the transformations from
the instrumental to standard UBVR system for peculiar red stars, many with
emission-line spectra, comparison with other work is difficult. Also, the
physical interpretation of the results and especially their application
to problems of stellar evolution, is at present impossible. The results may,
however, be useful for the classification of flare stars amongst themselves,
and as compared with other Orion variables, notably the non-flaring
T-association stars.
ACKNOWLEDGEMENTS
I am greatly indebted to Prof. G. Haro for supplying me with finding
charts for a large number of his flare stars prior to publication. I wish to
express particular gratitude to Dr. E. M. Lindsay for his encouragement
at each stage of this work, to Prof. P. A. Wayman for the use of the Dunsink
photometer and computer, to Mr. G. J. Butler for the use of his 60-inch
colour-equations and amplifier calibrations and for his kind assistance in the
computer programming, and to Mr. M. J. Bester for a number of ADH plates
taken by him.
REFERENCES
Andrews, A. D., 1968, I.B.V.S. Nos. 265 and 273; also unpublished V-R for AD Leo.(IBVS N°.265) (IBVS N°.273)
Broglia, P. and Lenouvel, F., 1960, Mém. Soc. astr. ital. 30. 199.
Haro, G., 1968. Stars and Stellar Systems Vol. 7, 141 Univ. Chicago.
Herbig, G. H., 1962, Astrophys. J. 135, 736, Adv. Astr. Astrophys. 1, 47.
Johnson, H. L., 1957, Astrophys. J. 126, 134.
Johnson, H. L., 1963, Stars and Stellar Systems. Vol. 3. 204. Univ. Chicago.
Johnson, H. L. et al., 1966, Commun. lunar planet Lab. 4. 99.
Kholopov, P. N., 1959, Soviet Astron. A. J. 3. 291. translation.
Kunkel, W. E., 1967, Dissertation. Univ. Texas.
Lee, T. A., 1968, Astrophys. J. 152, 913.
Mendoza, E. E., 1967, Bol. Obs. Tonantzintla y Tacubaya, 4. 149.
Mendoza, E. E., 1968, Astrophys. J. 151, 977.
Mosidze, L. N. 1967, Perem. Zvezdy 16, 149.
Parenago, P., 1954, Trudy Gos. astr. Inst. Sternberga, 25.
Poveda, A., 1964, Nature 202, 1319.
Sharpless, S., 1952, Astrophys. J. 116, 251.
Sharpless, S., 1954, Astrophys. J. 119, 200.
Sharpless, S., 1962, Astrophys. J. 136, 767.
Tapia, S., 1968, I.B.V.S. No. 286. (IBVS N°.286)