Non-Periodic Phenomena in Variable Stars
IAU Colloquium, Budapest, 1968
PRELIMINARY RESULTS OF A SURVEY OF NEBULAR VARIABLES
AND FLARE STARS
L. ROSINO
Astrophysical Observatory of Asiago, Italy
ABSTRACT
Preliminary results of the survey of nebular variables and flare stars carried
out at Asiago with the 92/67 cm Schmidt telescope are reported.
An extended survey of nebular variables in stellar aggregates of different
age and distance has been carried out in the last years at the Astrophysical
Observatory of Asiago, partly with the 122 em parabolic telescope and partly
with the new Schmidt of 92/67 cm, F : 3.3, covering a field of 25 square
degrees. Kodak blue and infrared material has been mostly used. Although
only a part of the material have been reduced, it is possible to give preliminary
results at least for some of the fields which are under control.
1. Orion aggregate. Two fields have been extensively observed: a) The
Trapezium area including the nebulae NGC 1976, 1977, 1982 and 1999.
b) The Horsehead nebula including also NGC 2024 near zeta Orionis. Results
of previous surveys in the Trapezium area have already been published by
the writer (1946, 1956, 1962). After 1962, forty-two new variable stars have
been found. Twenty-two are concentrated near the Trapezium; 25 are visible
only in infrared (m_pg > 18.5). Their positions and identification charts will
be published in a forthcoming paper. The total number of known variables
in the field (flare stars not included) is now 456. The density is particularly
high near the Trapezium, where 70% of the stars are found to be variable,
and along a strip going from NGC 1977 to NGC 1999 and continuing towards
the Horsehead Nebula. As observed elsewhere (Rosino, 1962) in heavily
obscured regions the variables are mostly found in the fringes of dark
nebulosities.
The Asiago observations after 1962 have shown another interesting
property of the nebular variables, particularly of those having a strong
ultraviolet excess: they present at times rapid fluctuations of brightness with
amplitudes of one magnitude or more, which, however, are not flares.
A photoelectric survey of such stars (YZ, YY, HS, XX, SY Ori) should be of the
greatest interest.
The mean amplitude of nebular variables in Orion is 1.60m, with a fairly
large dispersion. The frequency distribution of the apparent magnitudes has
a maximum near 17 pg, corresponding to an absolute magnitude of about +9.
It is likely, however, as indicated by the infrared survey, that the number
of variables may be still higher for fainter luminosities, below 18.
Thirty new variables have been found in the region of the Horsehead
nebula. These variables and those already known have the same characteristics
of the variables observed in the Trapezium region. Some of them show at times
a sort of periodicity which disappears after a few months. The possibility
that among the nebular variables there may also be eclipsing binaries should
not be disregarded. However, the erratic variation would tend to mask the
eclipses, unless an harmonic analysis of the light curves over a long period of
time could be made.
Table I
Flare stars in Orion recently discovered at Asiago
1900
No. P m Date Dur. Notes
R. A. D.
1 5h 22m 00s -6deg 04.5' 15.2-17.4 11 Dec, 1966 40m -
2 5 22 54 -4 25.6 15.8-18.5 8 Dec, 1967 30 -
3 5 24 34 -6 37.6 14.5-(18 2 Dec, 1967 - -
4 5 25 00 -7 09.0 16.6-17.8 30 Jan, 1968 - -
5 5 25 09 -4 27.7 15.3-17.5 23 Jan, 1966 >20 Haro 38
6 981 5 27 47 -5 03.9 16.0-16.8 30 Jan, 1968 10 -
7 5 28 13 -5 23.8 16.2-17.5 4 Jan, 1968 20 -
8 1333 5 29 08 -5 40.5 16.2-(17.1 30 Jan, 1968 15 II Ori
9 5 29 09 -4 11.7 15.8-(18.5 18 Jan, 1966 10? -
10 5 29 27 -6 22.0 16.2-(18.5 12 Jan, 1967 37 -
11 5 29 35 -6 03.3 16.4-17.2 4 Jan, 1968 20?
12 5 29 38 -0 31.0 15.0-17.5 7 Dec, 1967 >30 -
13 5 29 42 -6 12.3 15.0-(18.5 1 Feb, 1968 >30 -
14 5 29 55 -1 50.0 15.6-17.1 27 Feb, 1968 30 -
15 1625 5 29 55 -5 50.0 15.5-16.8 19 Jan, 1964 >60 -
16 5 30 29 -6 51.2 15.5-17.2 23 Jan, 1966 25 -
17 2039 5 30 32 -6 05.4 15.0-16.5 25 Feb, 1963 - NS Ori
18 2112 5 30 40 -5 33.2 15.0-(16.8 1 Feb, 1964 35 -
19 5 30 40 -7 06.1 15.8-17.3 30 Jan, 1968 30? -
20 5 30 54 -5 33.8 15.2-(17 19 Jan, 1966 - -
21 2210 5 30 52 -5 44.9 15.1-16.8 30 Jan, 1968 25? V 378 Ori
22 2235 5 30 55 -5 39.3 15.8-16.8 27 Dec, 1967 10 -
23 2245 5 30 56 -5 19.0 16.4-(17 12 Dec, 1966 10 V 379 Ori
24 2246 5 30 56 -5 20.4 16.0-16.9 30 Jan, 1968 >20 OT Ori
25 5 30 56 -6 21.8 15.8-18 1 Feb, 1968 >20 -
26 5 31 05 -4 22.3 16.4-(17 19 Jan, 1966 - -
27 2295 5 31 06 -5 27.3 16.6-(17.2 21 Jan, 1968 - V 365 Ori
28 5 31 12 -6 29.2 15.4-16.8 8 Dec, 1967 - -
29 5 31 32 -5 34.4 16.0-17.5 27 Feb, 1965 40 -
30 5 31 40 -6 43.6 16.6-(17.2 15 Jan, 1966 15 -
31 5 31 41 -6 46.0 15.5-16.9 19 Jan, 1963 10 -
32 5 31 51 -6 37.6 16.2-17.2 6 Jan, 1968 10 -
33 5 32 10 -2 55.3 15.0-(18 9 Dec, 1966 - -
34 5 32 18 -6 49.3 16.2-(17.2 19 Jan, 1966 - -
35 5 32 52 -0 49.5 15.5-17.2 31 Jan, 1968 20 -
36 5 33 40 -3 50.0 15.9-16.7 27 Jan, 1968 20 -
37 5 34 29 -2 53.2 16.2-18.2 24 Jan, 1966 - -
38 5 36 31 -1 45.0 15.9-(17.2 27 Jan, 1968 20 -
39 5 40 02 -1 11.9 14.8-16.7 8 Feb, 1959 - -
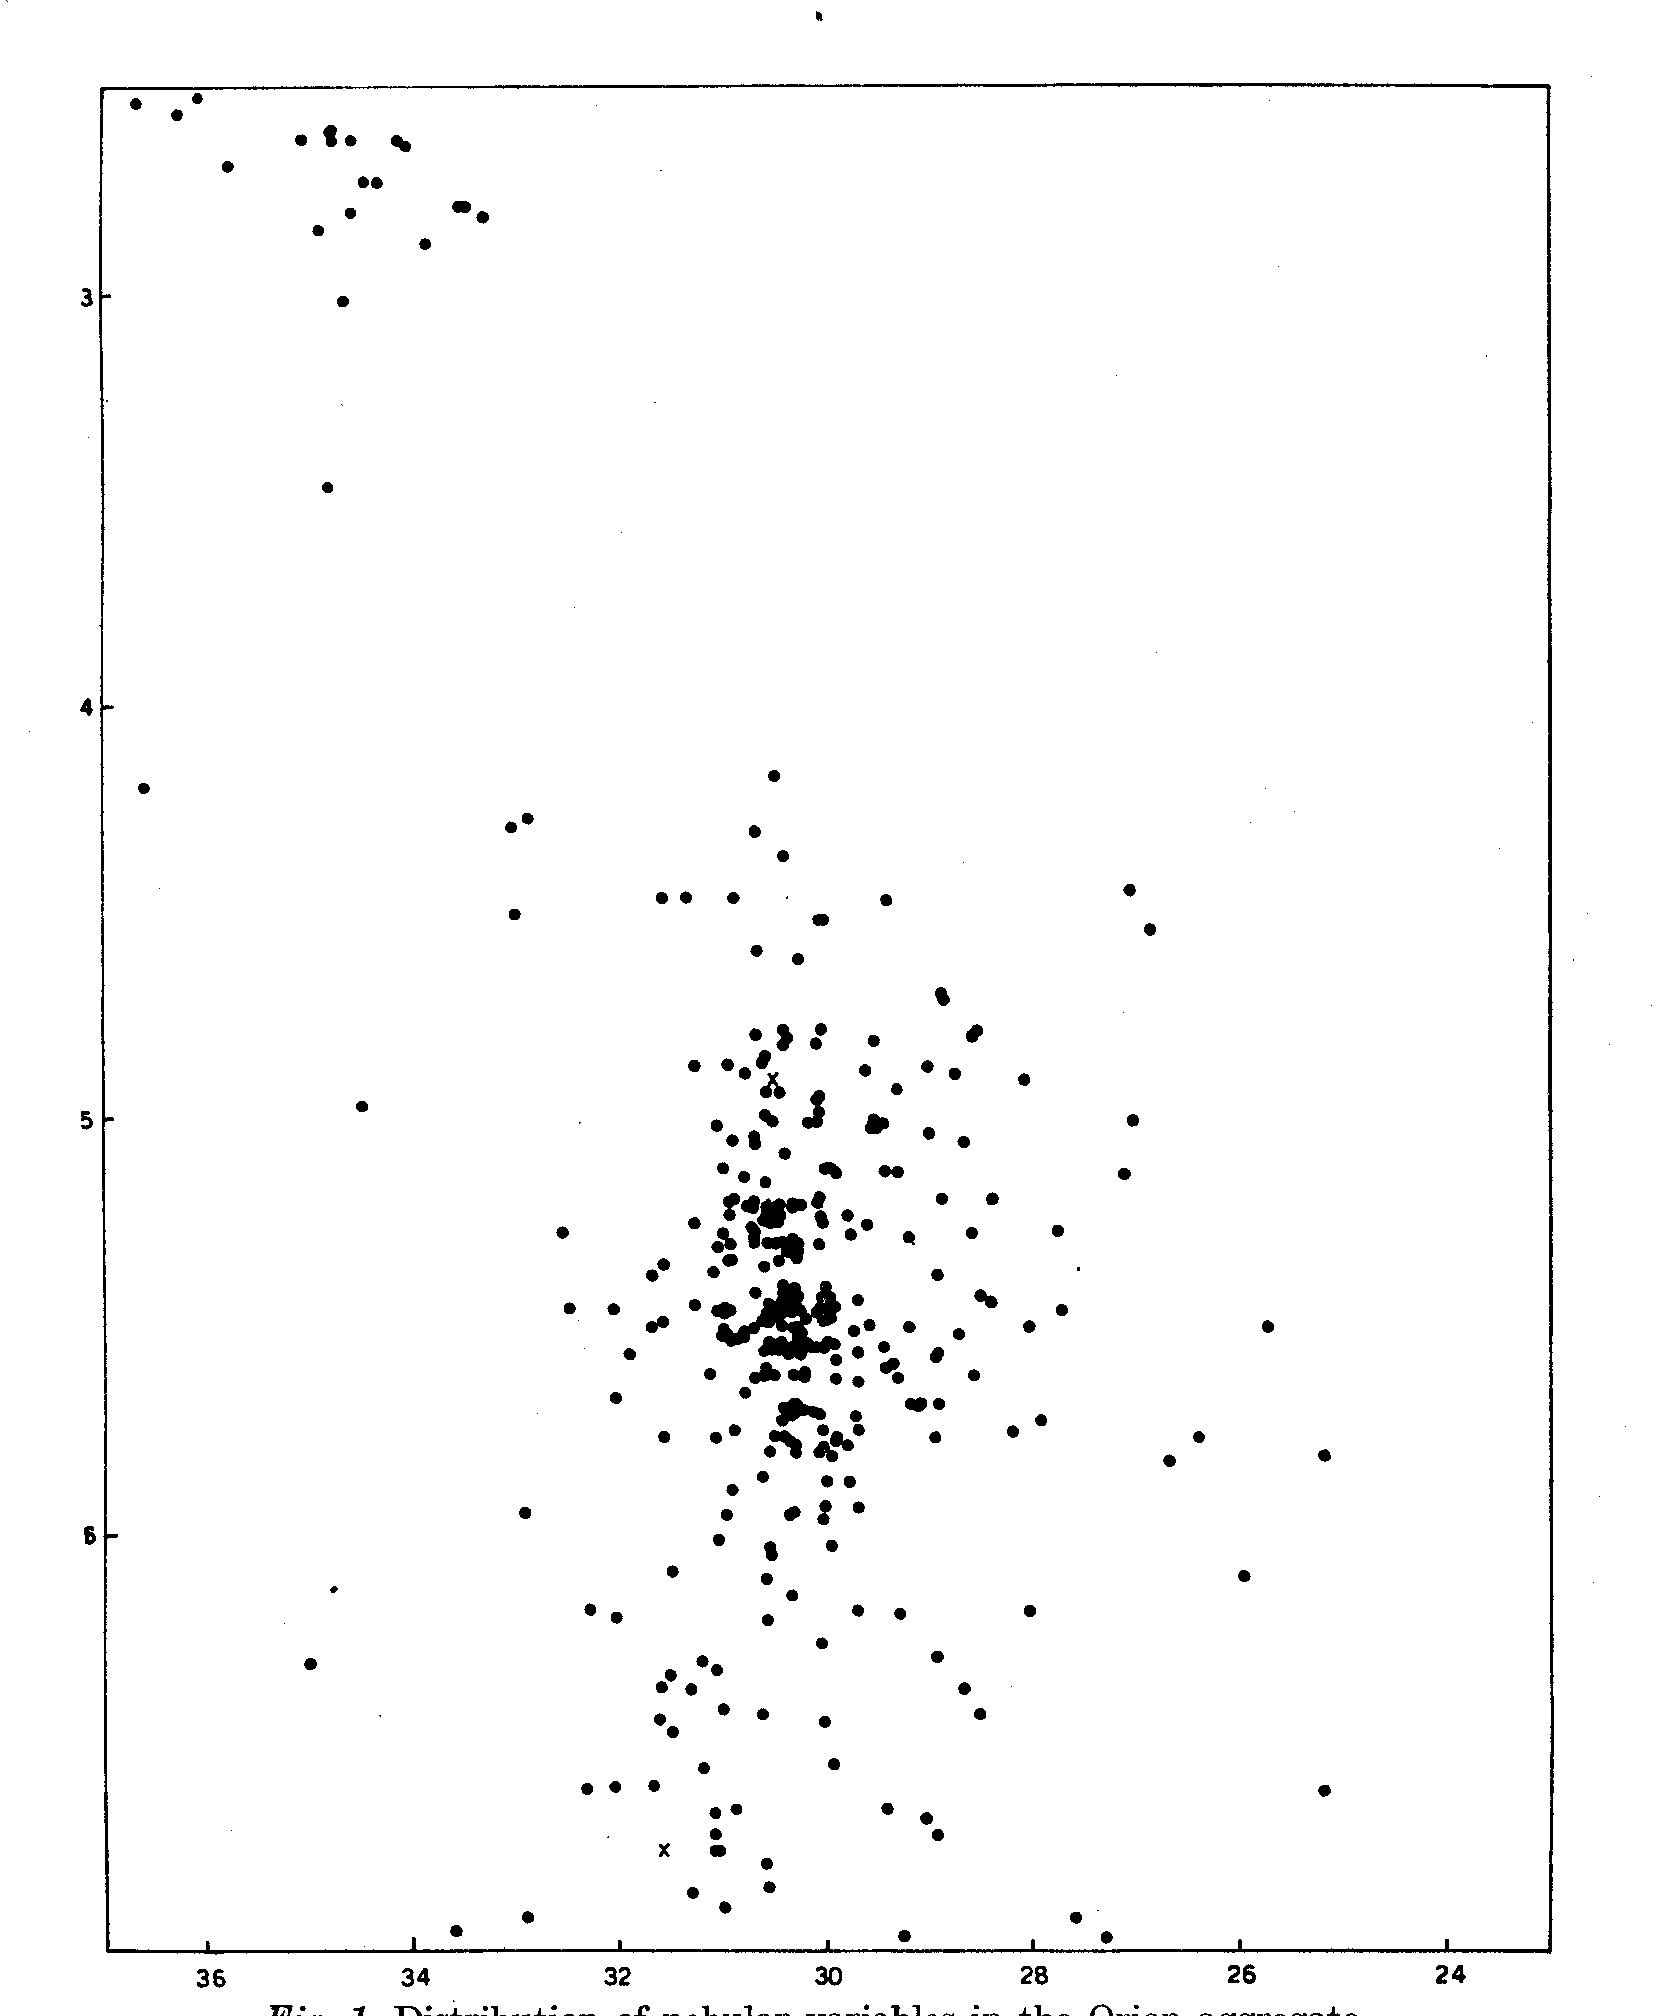 Fig. 1. Distribution of nebular variables in the Orion aggregate.
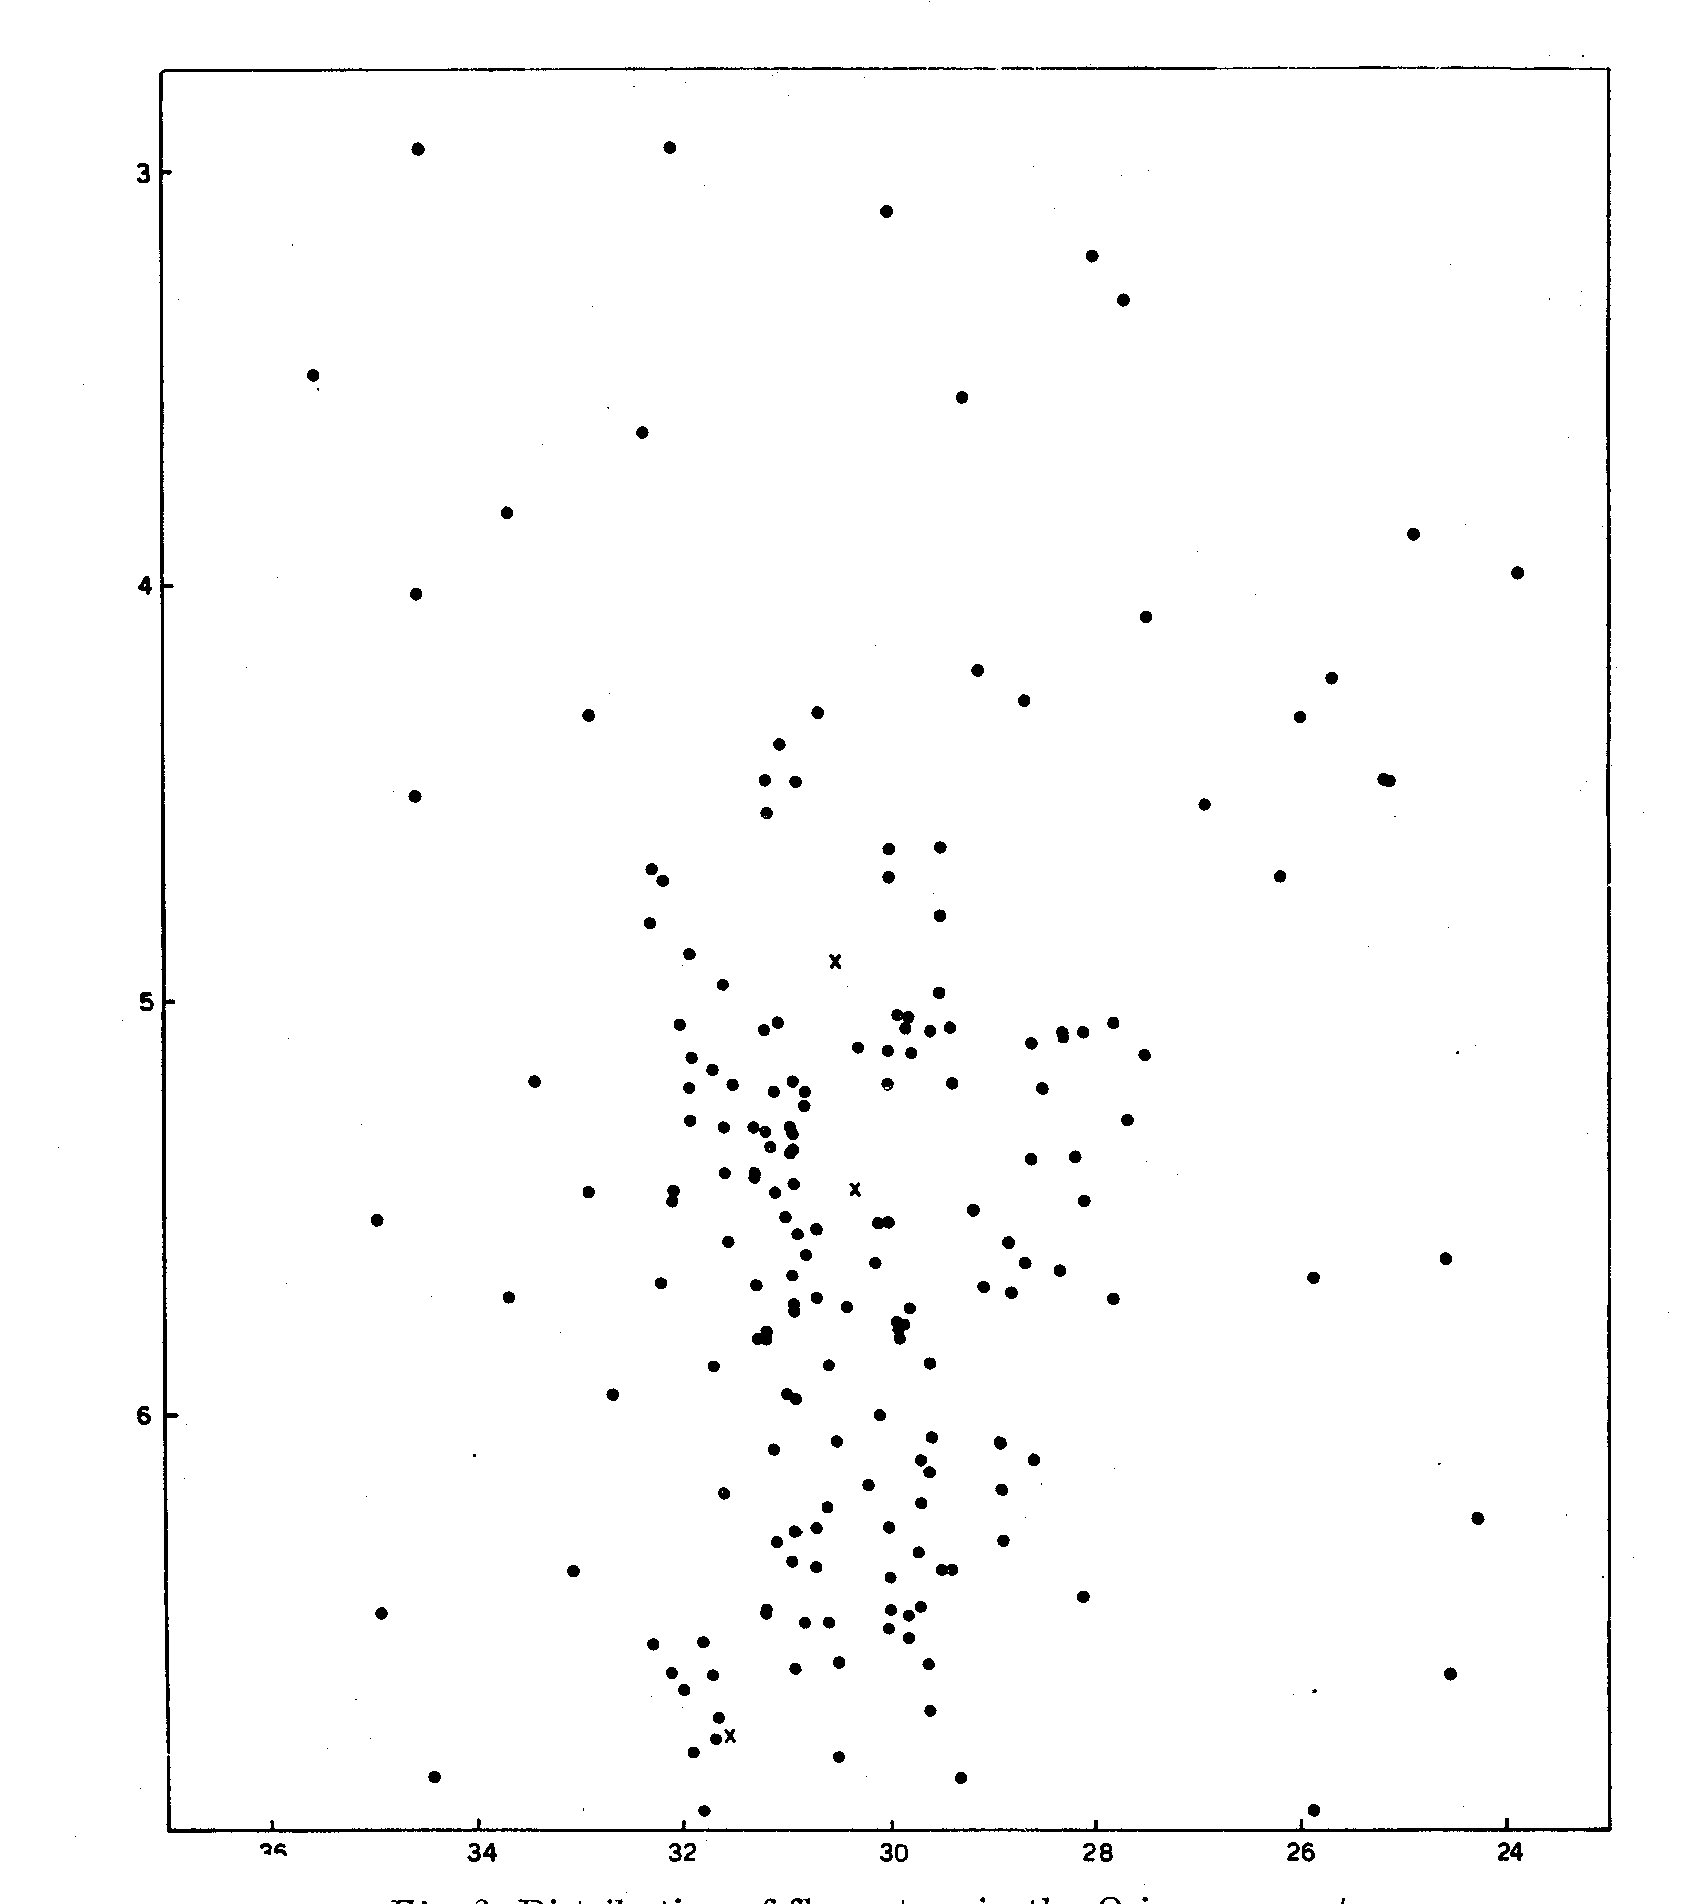 Fig. 2. Distribution of flare stars in the Orion aggregate.
2. Flare stars. After the new 67 cm Schmidt telescope has entered in operation
at Asiago, a great deal of time has been dedicated to the search of flares in
the Orion aggregate and other fields. The highest frequency of flares (1 flare
every 100 minutes of effective observation) has been found in the 25 square
degrees area centered in the Trapezium, while in the area around zeta Orionis
the frequency has been of one flare every 4 hours.
In total, the flares discovered at Asiago in the Orion aggregate (Trapezium
plus zeta Orionis) from 1962 to March 1968 have been 39; they are reported in
Table I. Details on the flares, light curves and identification charts will be
published in a forthcoming paper. In their normal condition of minimum
the flare stars discovered at Asiago are all fainter than 16.5 pg. Their mean
photographic magnitude is 17.2. By a comparison with the flare stars found
in the same region by Haro and Chavira (1965) the mean P-V color index for a
flare star in the aggregate is of the order of +1.5, with a V mean absolute
magnitude ~ 7.6, so that the representative point is slightly to the right of
the zero age main sequence. However, it is apparent from the Asiago
observations that some of the flare stars lie on the main sequence and even
to the left of the main sequence, although the large majority is on the right.
Figs. 1 and 2 illustrate the distribution of nebular and flare stars in the
Orion aggregate. Although they are obviously correlated, the dependence is
not so strong as it was believed. The effects of selection in the discovery of
flares, due to the presence of bright nebulosity, should, however, be carefully
considered.
Flares are mostly observed in stars which show no variations outside
the flares. Very seldom, they are also found in typical nebular variables
and in this case the amplitude of the flare is smaller (1.1m) than normal (2.0m).
The frequency of flares in the same star is in general rather low in the Orion
aggregate. Of 222 flare stars in Orion hitherto published only 23 have been
caught in flare more than once, and only 5 have had three flares or more.
This means that the mean interval between two successive flares in Orion
is higher than 10 days and in fact the occurrence of a flare in a given star
is really a very rare event. As it was pointed out by Haro, the rate of flares
in a star depends from the nature of the aggregate and increases with age. In
the Pleiades and Hyades it is considerably higher than in Orion.
BIBLIOGRAPHY
Haro, G. and Chavira, E. 1965, Vistas in Astronomy, Vol. 8, 89.
Rosino, L., 1946, Pubbl. Bologna Vol. V, No. 1.
Rosino, L., 1956, Mem. Soc. astr. it. 27, 3.
Rosino, L., 1962, Mem. Soc. astr. it. 32, 4.
Fig. 2. Distribution of flare stars in the Orion aggregate.
2. Flare stars. After the new 67 cm Schmidt telescope has entered in operation
at Asiago, a great deal of time has been dedicated to the search of flares in
the Orion aggregate and other fields. The highest frequency of flares (1 flare
every 100 minutes of effective observation) has been found in the 25 square
degrees area centered in the Trapezium, while in the area around zeta Orionis
the frequency has been of one flare every 4 hours.
In total, the flares discovered at Asiago in the Orion aggregate (Trapezium
plus zeta Orionis) from 1962 to March 1968 have been 39; they are reported in
Table I. Details on the flares, light curves and identification charts will be
published in a forthcoming paper. In their normal condition of minimum
the flare stars discovered at Asiago are all fainter than 16.5 pg. Their mean
photographic magnitude is 17.2. By a comparison with the flare stars found
in the same region by Haro and Chavira (1965) the mean P-V color index for a
flare star in the aggregate is of the order of +1.5, with a V mean absolute
magnitude ~ 7.6, so that the representative point is slightly to the right of
the zero age main sequence. However, it is apparent from the Asiago
observations that some of the flare stars lie on the main sequence and even
to the left of the main sequence, although the large majority is on the right.
Figs. 1 and 2 illustrate the distribution of nebular and flare stars in the
Orion aggregate. Although they are obviously correlated, the dependence is
not so strong as it was believed. The effects of selection in the discovery of
flares, due to the presence of bright nebulosity, should, however, be carefully
considered.
Flares are mostly observed in stars which show no variations outside
the flares. Very seldom, they are also found in typical nebular variables
and in this case the amplitude of the flare is smaller (1.1m) than normal (2.0m).
The frequency of flares in the same star is in general rather low in the Orion
aggregate. Of 222 flare stars in Orion hitherto published only 23 have been
caught in flare more than once, and only 5 have had three flares or more.
This means that the mean interval between two successive flares in Orion
is higher than 10 days and in fact the occurrence of a flare in a given star
is really a very rare event. As it was pointed out by Haro, the rate of flares
in a star depends from the nature of the aggregate and increases with age. In
the Pleiades and Hyades it is considerably higher than in Orion.
BIBLIOGRAPHY
Haro, G. and Chavira, E. 1965, Vistas in Astronomy, Vol. 8, 89.
Rosino, L., 1946, Pubbl. Bologna Vol. V, No. 1.
Rosino, L., 1956, Mem. Soc. astr. it. 27, 3.
Rosino, L., 1962, Mem. Soc. astr. it. 32, 4.