Non-Periodic Phenomena in Variable Stars
IAU Colloquium, Budapest, 1968
PHOTOELECTRIC OBSERVATION OF LINE PROFILES WITH HIGH
TIME RESOLUTION IN B AND Be STARS
J. B. HUTCHINGS
Dominion Astrophysical Observatory, Victoria, B. C. Canada
INTRODUCTION
One of the most important problems connected with the observation
of irregular variable stars is that of spectroscopic time resolution. In a star
whose variable properties are not repeated in a predictable manner it is
essential to make continuous observations until the time scale and magnitude of
its variations become apparent. In addition, high time resolution observation
may reveal short time variation in properties of stars previously thought to
be stable. It is known that many early type stars for instance, especially
those having emission lines (and hence extended atmospheres), show changes
in their spectra, but until we can watch such changes taking place we cannot
expect to explain their occurrence.
High dispersion high time resolution spectrophotography is limited to
the few brightest stars or the few largest telescopes in the world. Both of
these limitations are unsatisfactory, but as the photomultiplier is some 10
to 20 times more efficient than the photographic plate it is the obvious choice
for such work. In addition the photomultiplier's linear response to light enables
one to obtain direct intensity profiles immediately, saving hours of daytime
drudgery, and allowing on-the-spot monitoring of the results.
Several systems for photoelectric line scanning are being developed now,
so it is important to discuss the techniques being used in order to achieve
reliable cross-comparison of results and to overcome design and performance
problems. It is also important to bring to the attention of astronomers the
sort of work which can be done with this technique. I propose therefore to
describe the Victoria scanner and the problems in its operation and then show
the results which early runs on it have produced. These results should at
this stage be regarded as an introduction to the astrophysical problems brought
to light by the observation.
THE SCANNER
Basically the scanner is a photomultiplier, Fabry lens, and slit which
are moved in a straight line tangential to the focal plane of the 96" focal
length coude spectrograph of the Victoria 48" telescope, using an accurate
screw and speed stabilised motor. The dispersion in the spectrum is about
2.3 A/mm and with the present resolution scans of up to 50 A are possible
before defocussing is significant.
The motor speed is continuously variable by remote control and is normally
used in the range between 0.5 and 50 A/minute. The speed is constant to within
1 % at any setting. The screw trips a micro-switch every revolution, which
provides a fiducial mark on the tracing every 2.3 A. Thus the wavelength
scale on the tracing is accurate to within .02 A, which is far below the
resolution of the instrument.
The zero point of the wavelength scale is determined by scanning the
comparison spectrum, which is an Fe-A discharge tube. This comparison
exactly replaces the stellar spectrum by means of a swinging quartz prism.
Initially a grating setting is made and the exact position of the scan
identified by making a scan of the comparison spectrum. Once the position and
length of the scan are decided, they can be fixed by means of adjustable limit
switches on the screw.
The cooling mechanism is thermoelectric, with the hot junction cooled
by water circulation. Temperatures accurate to 1 deg C, down to -30 deg C are
remotely controlled. The best compromise between thermal noise and light
response is obtained at about -20 deg C with the EMI tube used in the
blue.
The recorded tracing is the ratio of the output of two channels - the
scanner and a monitor channel. The monitor system measures light reflected
off a diagonal quartz plate in the beam immediately behind the objective
slit. The output from each channel is amplified and impedances matched.
Further optional adjustments allow the scale of the tracing and the time
constant to suit the speed of scan and brightness of the star. A filter is used
in the main beam to isolate the spectral region being scanned for the monitor
response. Using this system, variations in seeing and extinction during the
time of scan are largely overcome. A 25% change in light transmitted through
the slit results in a 2% change in the recorded output. In good conditions the
seeing variation is less than 5% over the time for a scan so that final
accuracy can be well within 1%.
In order to achieve this stability however it is necessary to pass most
of the starlight through the objective slit, which requires a width of about
7 mm. The resolution of the scanner is then some 0.5 A. While this is not
very high it is sufficient to indicate changes which occur is spectral features
of almost all early type stars.
Finally I should mention the disadvantages of the system and possible
ways of overcoming them. The monitoring system used requires a filter which
cuts down light or covers too wide a range in wavelength. It also requires a
wide slit. Unevenness or dirt on the quartz flat can lead to inaccuracy in the
monitoring system, and defocussing and decollimation effects are not monitored.
A stationary monitor channel covering some 10-20 A in the spectrum would
overcome all these drawbacks. It would also allow the limiting magnitude
to be increased by one, or the resolution to be improved for brighter
stars. Efficiency and resolution could also be improved by replacing both
slits with image slicers of the type now used for spectrography in Victoria.
This would require redesign of the Fabry optics, but is a possibility. Lastly,
a recorder which showed both monitor and ratio outputs would assist in
the assessment of the profile accuracy.
At present the scanner can produce profiles in the blue region of early
type spectra of 2% accuracy in a 4th m. star over 20 A in some 5 minutes,
or 3% accuracy in a 6th m. star over 6 A in about the same time.
RESULTS
The figures below show selected profiles of lines in some early type
stars which show irregular and rapid spectral changes.
1. gamma Cas. Figure 1 shows series of profiles of H gamma and H beta taken on
two consecutive nights. Each shows rapid change in the double emission structure
found in this Be star. The star is well known for its longer term changes and
similar short term changes have been obtained previously (Hutchings 1967, 1968).
The separation of the H gamma peaks here falls fairly steadily during the
period of observation, increases sharply at the second last profile and then
starts to fall again. This is shown by the table below.
time 4.03 4.07 4.10 4.13 4.16 4.21 4.24 4.27 4.31
separation (arbitrary units) 3.9 3.7 3.6 3.5 3.6 3.4 3.3 3.9 3.6
Whether this is a regular phenomenon or not must be decided by further
systematic observation.
2. kappa Dra. This is another Be star, with much weaker emission components.
Figure 2 shows a series of scans of the emission components in the bottom of
the H gamma line. Here again there is rapid activity, especially in the shortward
peak, whose sharpness appears to fall off steadily throughout the time of
observation. Further observation is needed to confirm and study this type of
activity, which may be connected with the rapid rotation of the star. This
star also shows emission peaks in other lines, often very weakly, but whose
mean separations are quite different. Again, evidence so far is fragmentary
but it may indicate differential rotation of the stellar envelope with height
or even latitude. The following table gives tentative velocity ranges for
various lines.
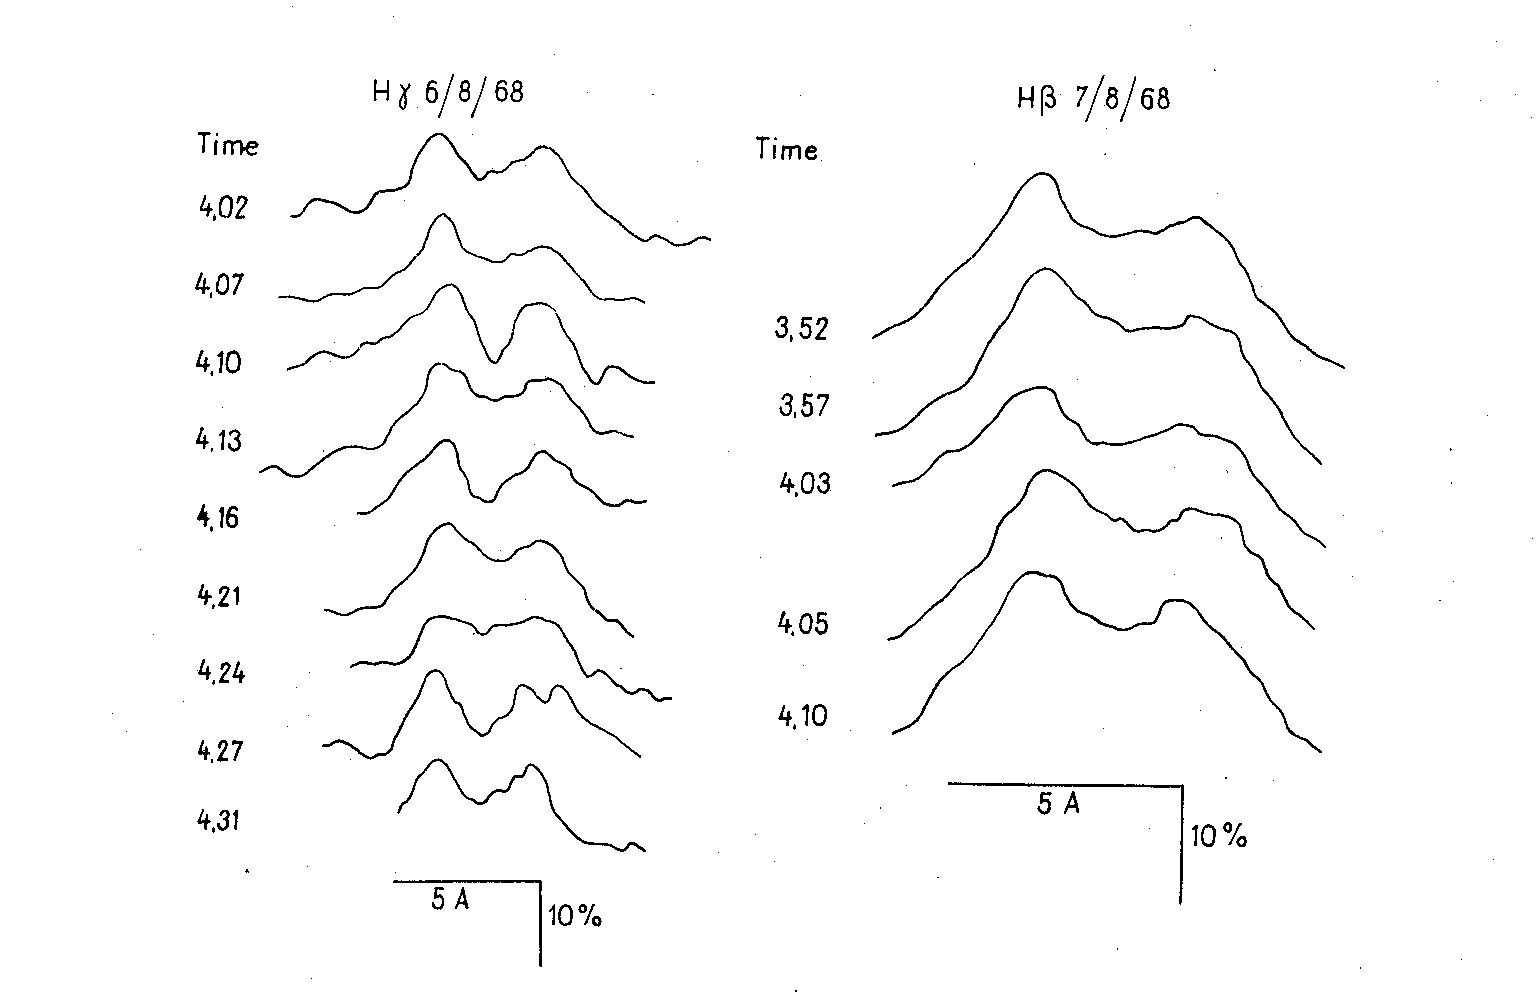 Fig. 1. Line profiles in gamma Cas
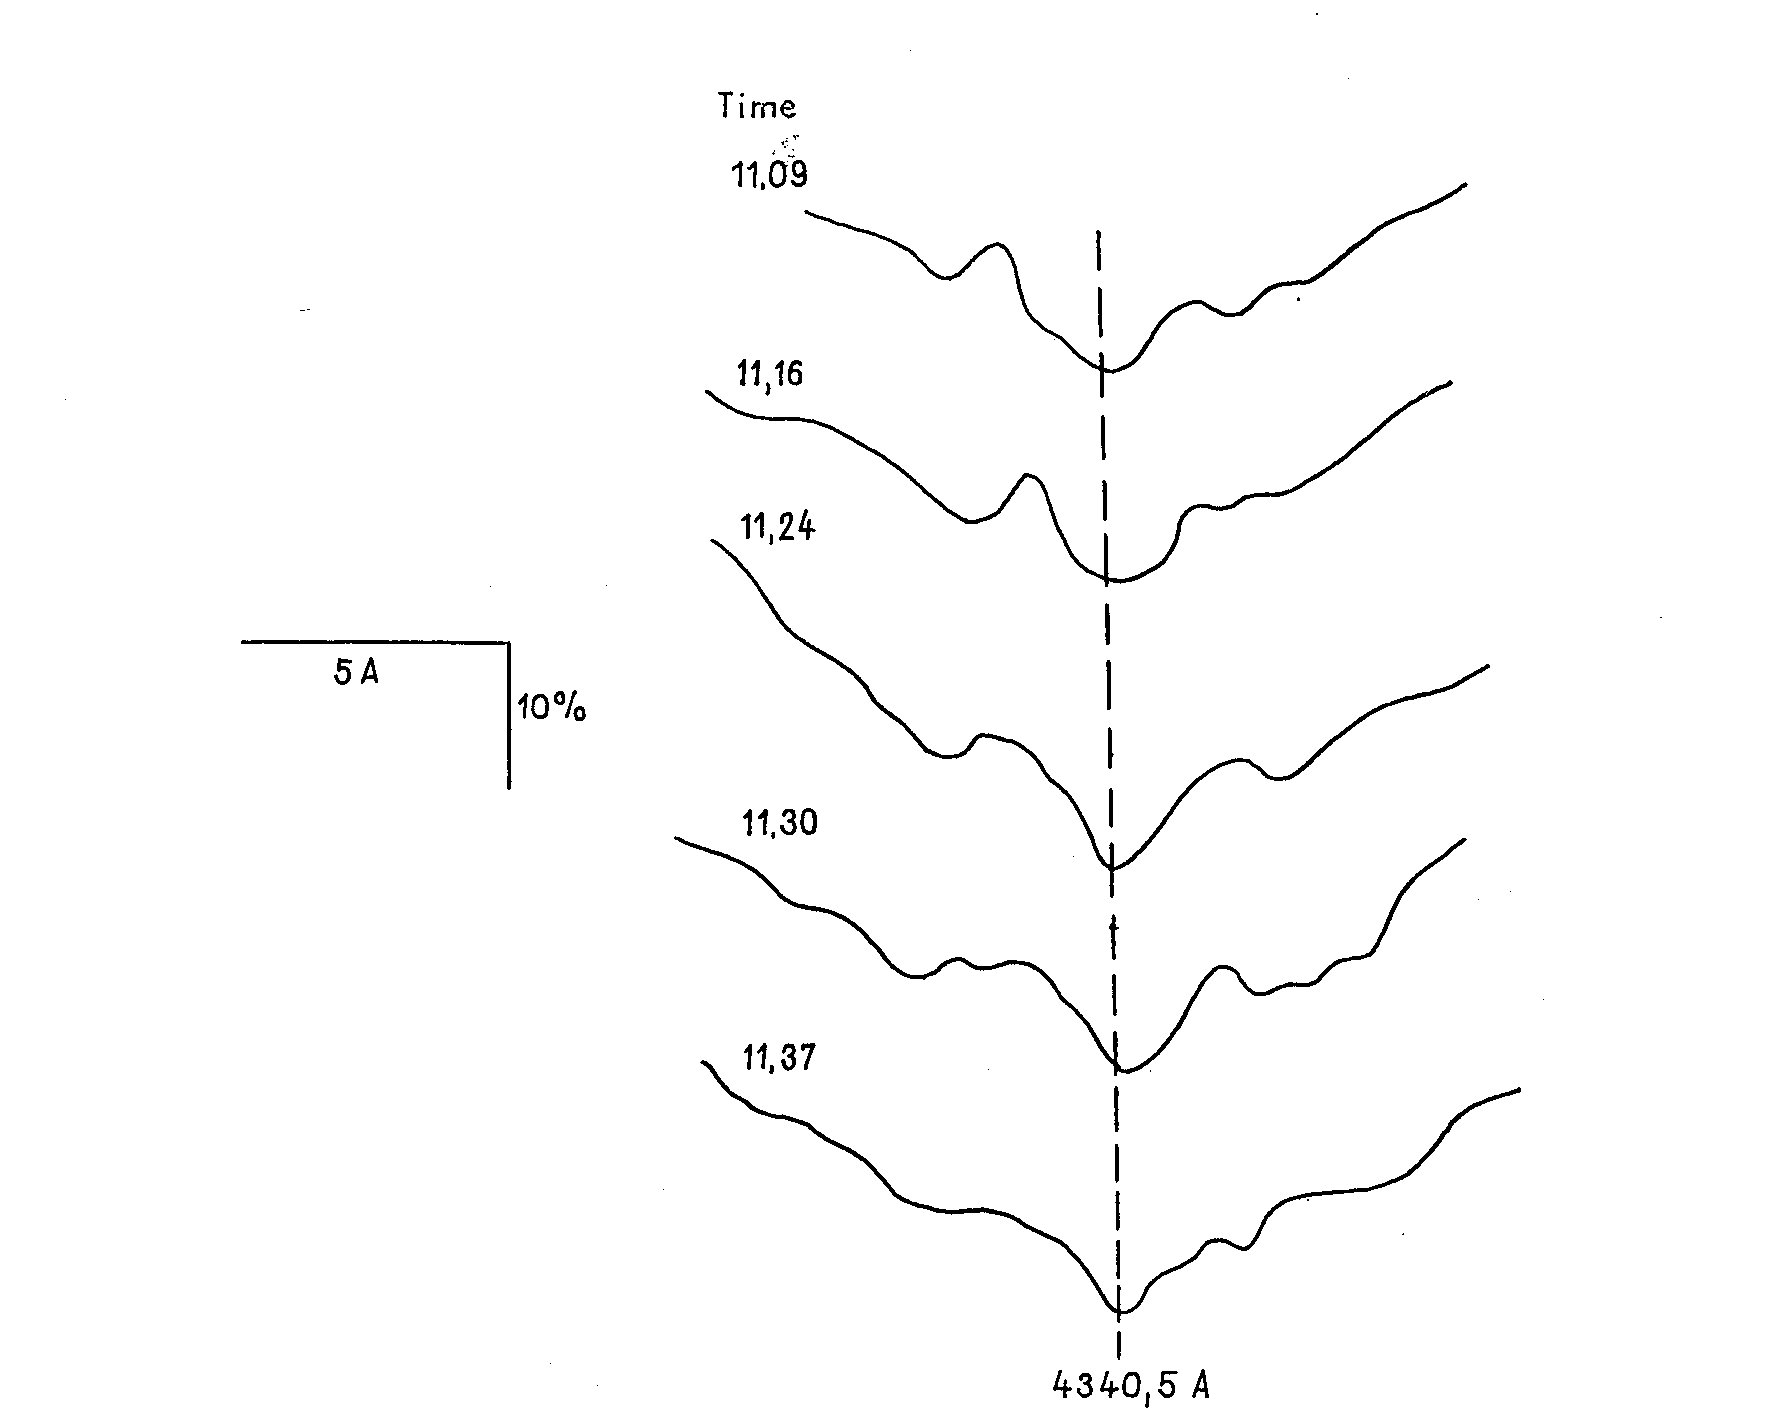 Fig. 2. Scans of H gamma in kappa Draconis 30/5/68
Line 4471 4481 H gamma H beta H alpha
(triple peaked)
Vel. indicated
by peak 490-650 400-520 210-300 160-240 170-650km/s
separation
Other lines without emission (4921, 4713, 4387, 4267, 4143) all have
rotationally broadened profiles indicating v sin i about 350 km/sec.
The star is being investigated further observationally and by computation
of line profiles for various geometrical models.
Fig. 2. Scans of H gamma in kappa Draconis 30/5/68
Line 4471 4481 H gamma H beta H alpha
(triple peaked)
Vel. indicated
by peak 490-650 400-520 210-300 160-240 170-650km/s
separation
Other lines without emission (4921, 4713, 4387, 4267, 4143) all have
rotationally broadened profiles indicating v sin i about 350 km/sec.
The star is being investigated further observationally and by computation
of line profiles for various geometrical models.
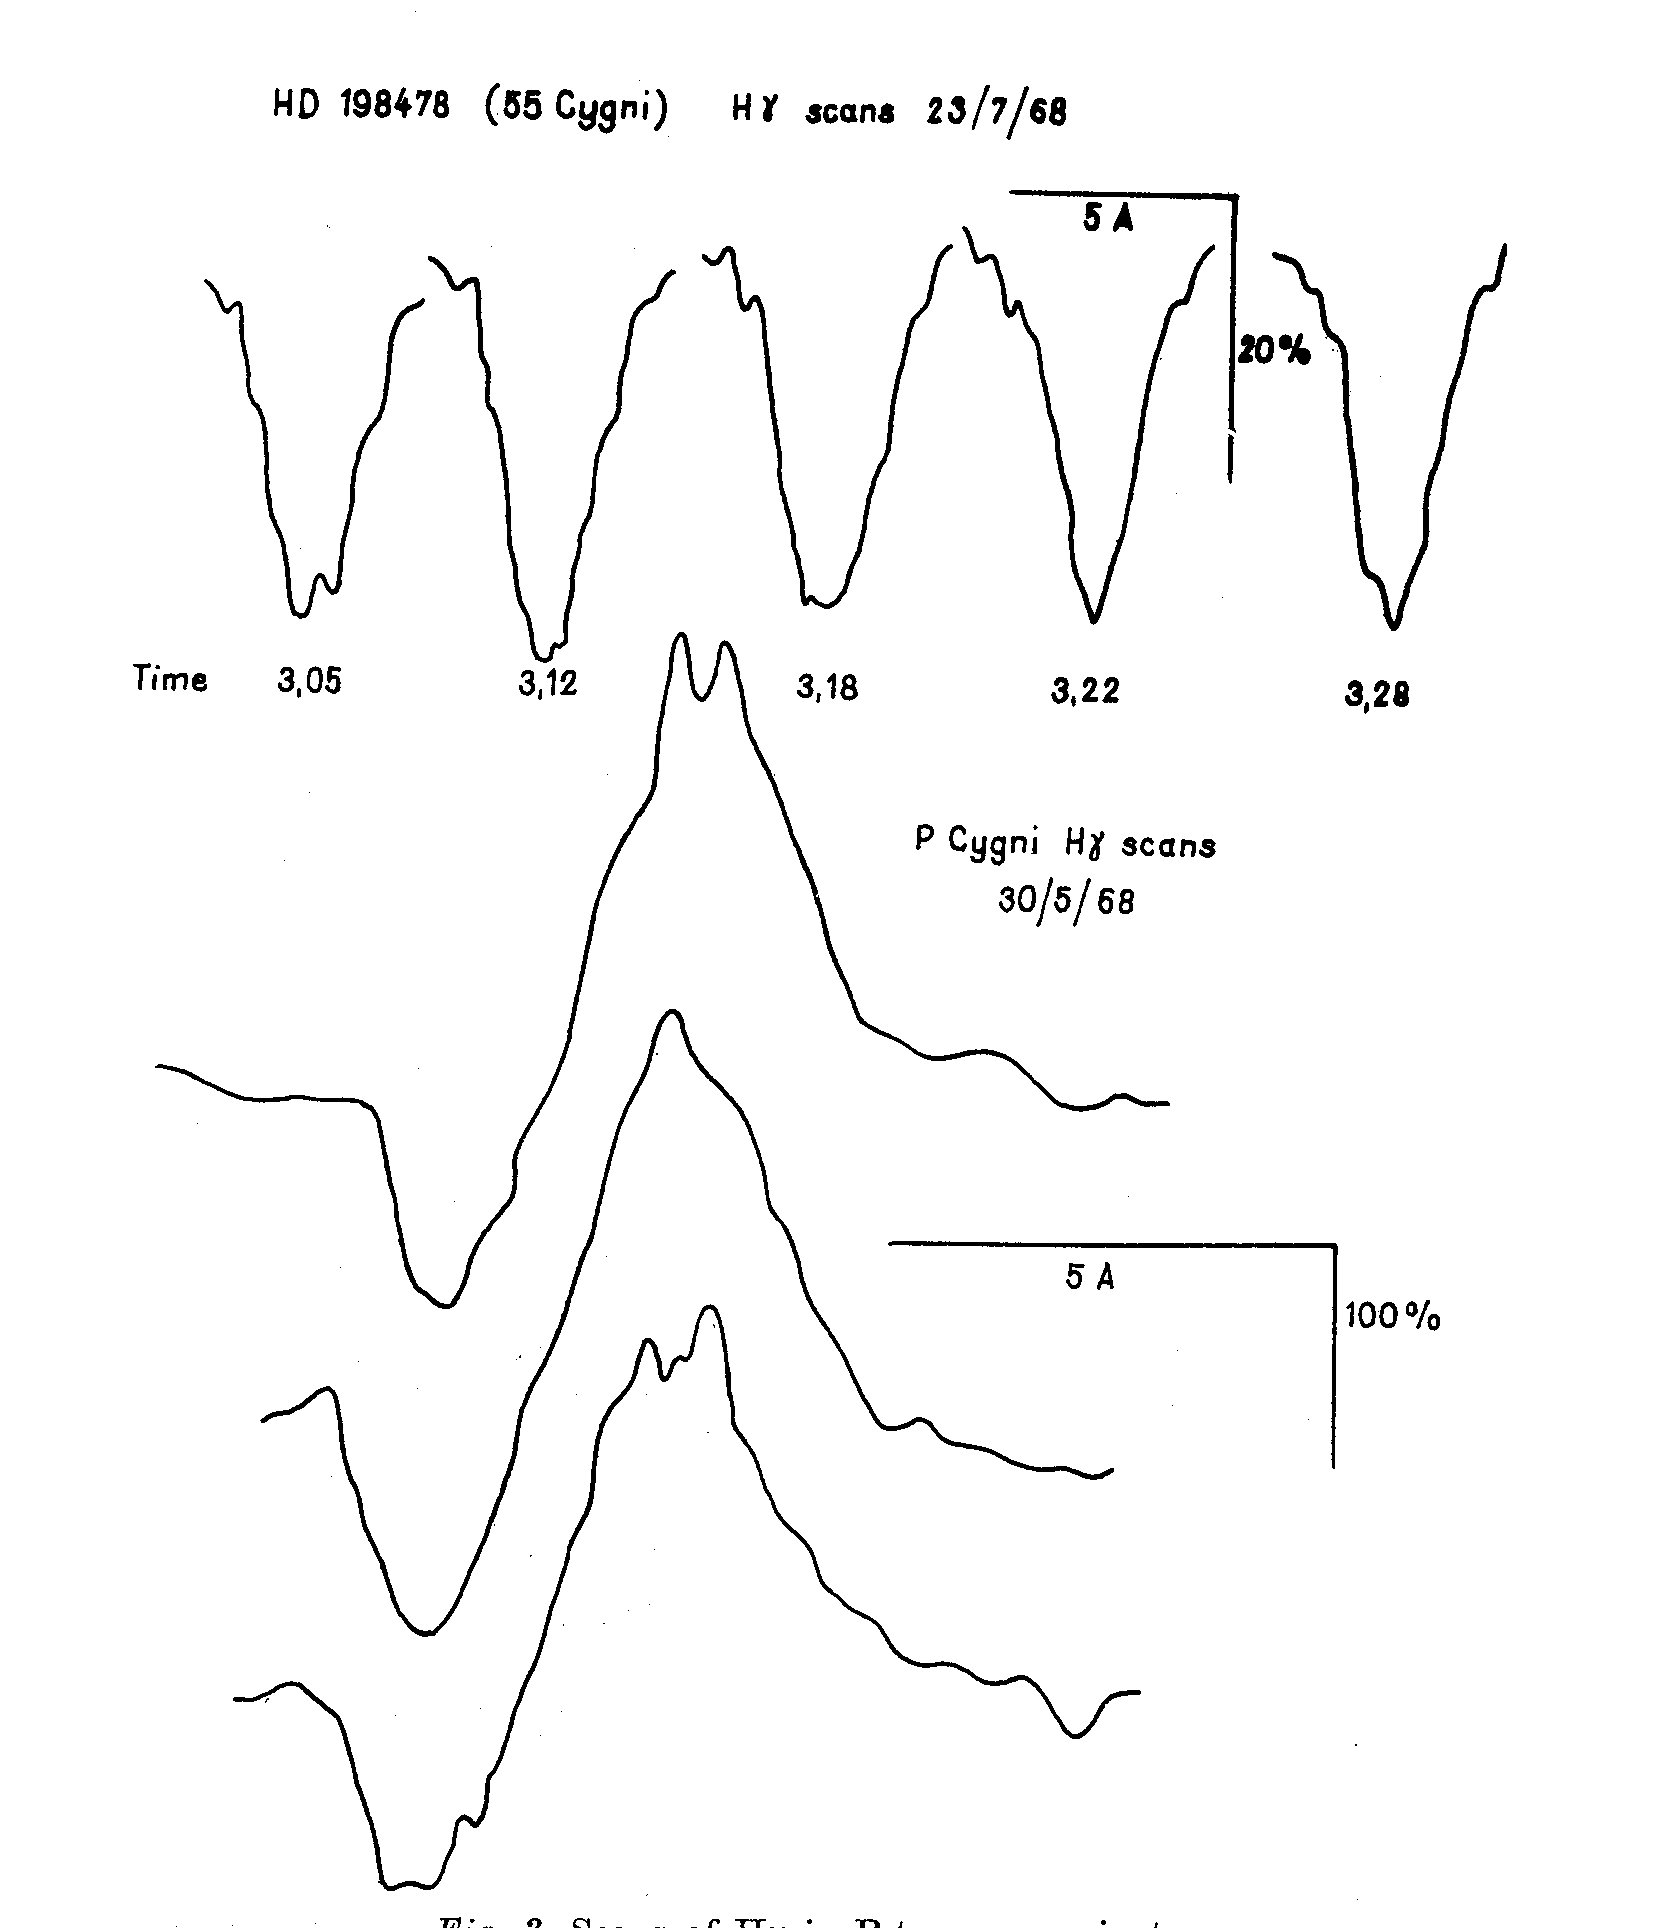 Fig. 3. Scans of H gamma in B-type supergiants
3. B Supergiants. Figure 3 shows profiles of H gamma for the B3 supergiant 55
Cygni, and for P Cygni. The core of the H gamma absorption in 55 Cygni is seen
to be in rapid and irregular activity. As the line core is formed in the outer
layers of the atmosphere and the star is probably undergoing mass loss
(Hutchings 1968a), this type of observation may be a valuable method of extracting
information about the atmospheres of such stars. This sort of activity is seen
in other supergiants (Hutchings 1967). Scans of the B 1.5 supergiant HD 190603
have shown rapid changes in strength in the O II line at 4351 A, which may
indicate temperature fluctuations in the atmosphere.
The scans of P Cygni, which is losing mass fairly rapidly show evidence
of irregular changes in the shape of the emission peak. These may provide
a further clue as to the dynamic state of the outer layer of this peculiar star.
CONCLUSION
In conclusion I should mention other objects for observation by this
technique. There are the chromospheric absorption lines in Ca H and K of
the eclipsing systems 31 and 32 Cygni; the rapidly changing profiles in bright
novae, and the line profiles at various stages in the cycles of beta Cephei stars.
It is also hoped to use the apparatus for obtaining accurate profiles of rapidly
rotating stars, for comparison with theoretical ones.
I must acknowledge the help of the D.A.O. workshop staff, Mr D. Andrews,
Mr W. Symthe, and Dr G. A. H. Walker, without whose guidance this work
could not have been done.
REFERENCES
Hutchings, J. B., 1967, Observatory 87, 289.
Hutchings, J. B., 1968, Mon. Not. R. astr. Sec. (in press).
Hutchings, J. B., 1968a, Trieste Colloquium on Mass Loss (in press).
DISCUSSION
Slettebak: Do you find changes in the line profiles of Be stars of the type
you discussed every time you observe these stars, or did your illustrations
show selected moments of large change?
Hutchings: I have found variations in the stars which I have mentioned
during most observing runs. However those shown today were selected
as showing the most marked variations. Photographic observations of
these stars have shown smaller variations but this is partly due to
smearing out of the changes by the length of exposure necessary.
Slettebak: I have observed gamma Cas on one other night and found less
variation. Spectrograms taken in Victoria also show less activity but
the length of exposure quite probably smears out the changes shown here.
De Groot: The variations that you mentioned in the emission line profile
of H gamma are also indicated in our material; but there they are
more difficult to detect because our profiles are from photographic
observations. The emission peaks sometimes are quite black and difficult to
reduce, but there are indications for the same variations.
Fig. 3. Scans of H gamma in B-type supergiants
3. B Supergiants. Figure 3 shows profiles of H gamma for the B3 supergiant 55
Cygni, and for P Cygni. The core of the H gamma absorption in 55 Cygni is seen
to be in rapid and irregular activity. As the line core is formed in the outer
layers of the atmosphere and the star is probably undergoing mass loss
(Hutchings 1968a), this type of observation may be a valuable method of extracting
information about the atmospheres of such stars. This sort of activity is seen
in other supergiants (Hutchings 1967). Scans of the B 1.5 supergiant HD 190603
have shown rapid changes in strength in the O II line at 4351 A, which may
indicate temperature fluctuations in the atmosphere.
The scans of P Cygni, which is losing mass fairly rapidly show evidence
of irregular changes in the shape of the emission peak. These may provide
a further clue as to the dynamic state of the outer layer of this peculiar star.
CONCLUSION
In conclusion I should mention other objects for observation by this
technique. There are the chromospheric absorption lines in Ca H and K of
the eclipsing systems 31 and 32 Cygni; the rapidly changing profiles in bright
novae, and the line profiles at various stages in the cycles of beta Cephei stars.
It is also hoped to use the apparatus for obtaining accurate profiles of rapidly
rotating stars, for comparison with theoretical ones.
I must acknowledge the help of the D.A.O. workshop staff, Mr D. Andrews,
Mr W. Symthe, and Dr G. A. H. Walker, without whose guidance this work
could not have been done.
REFERENCES
Hutchings, J. B., 1967, Observatory 87, 289.
Hutchings, J. B., 1968, Mon. Not. R. astr. Sec. (in press).
Hutchings, J. B., 1968a, Trieste Colloquium on Mass Loss (in press).
DISCUSSION
Slettebak: Do you find changes in the line profiles of Be stars of the type
you discussed every time you observe these stars, or did your illustrations
show selected moments of large change?
Hutchings: I have found variations in the stars which I have mentioned
during most observing runs. However those shown today were selected
as showing the most marked variations. Photographic observations of
these stars have shown smaller variations but this is partly due to
smearing out of the changes by the length of exposure necessary.
Slettebak: I have observed gamma Cas on one other night and found less
variation. Spectrograms taken in Victoria also show less activity but
the length of exposure quite probably smears out the changes shown here.
De Groot: The variations that you mentioned in the emission line profile
of H gamma are also indicated in our material; but there they are
more difficult to detect because our profiles are from photographic
observations. The emission peaks sometimes are quite black and difficult to
reduce, but there are indications for the same variations.