Non-Periodic Phenomena in Variable Stars
IAU Colloquium, Budapest, 1968
SPECTROSCOPIC OBSERVATIONS OF THE RECURRENT NOVA
T PYXIDIS DURING THE 1967 MAXIMUM
G. CHINCARINI, L. ROSINO
Astrophysical Observatory Asiago, University of Padova
ABSTRACT
Spectroscopic observations of the recurrent nova T Pyx have been made at
Asiago in the first months of 1967, during the slow decline of the star from
maximum. The early spectra show wide emission lines of H, HeI, CII, NII, NIII,
OIII, FeII, etc. with violet-shifted absorption components. The mean expansion
velocity derived from the dark lines is about 1800 km/s. Spectra taken in March
and April indicate an increasing degree of ionization, as shown by the
strengthening of the emission bands of HeII, NII, NIII, OIII. The absorption
lines weaken or disappear. Although the forbidden lines of [OIII] and
[FeX] 6374 are already present, the star has not yet reached its highest
degree of ionization, as observed by Joy in 1944, when the observations were
interrupted.
INTRODUCTION
A fifth outburst of the recurrent nova T Pyxidis (alpha = 9h 2m 36s;
delta = -32deg 9.5'; 1950.0) was announced on Dec. 7, 1966 by A. Jones, New
Zealand, who observed that the star had brightened to magnitude 12.9. The
variable reached magnitude 9.0 on Dec. 10 and then slowly increased in luminosity
reaching the maximum on January 9. The light-curve (Fig. 1) derived by M.
Mayall (1967) plotting AAVSO observations, is remarkably similar in shape
to the light-curves obtained combining the observations made during the four
previous maxima in 1890, 1902, 1920 and 1944. The similarity of the light
curves in successive outbursts was also noticed for the recurrent novae RS Oph,
T CrB and WZ Sge. At maximum, in 1967, T Pyx reached visual magnitude 6.9.
At minimum the star has magnitude 14.0, so the amplitude is about 7m.
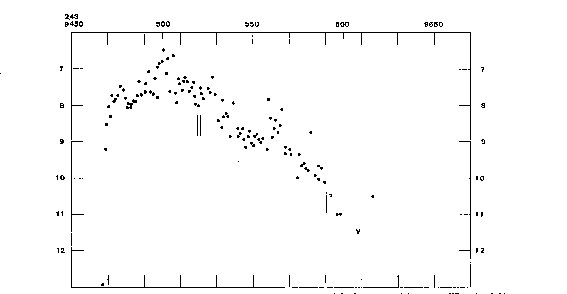 Fig. 1. Light curve of T Pyx in 1966-67 (Mayall, JRAS Canada 61, 350). Vertical
lines sign the epochs of the spectroscopic observations.
While other recurrent novae (T CrB, RS Oph) have an extremely fast variation
during the outburst, T Pyx can be classified as a relatively slow nova, with
a flat maximum and slow decline of brightness. In 1966-67 it took the nova
about 30d from the epoch of maximum to decline by one magnitude, 50d by two
magnitudes and 80d by three magnitudes. The corresponding figures for RS Oph
are: 4d for a decline of two magnitudes; 9d for three magnitudes. RS Oph is
therefore about ten times faster than T Pyxidis.
Although the relatively slow decline of T Pyxidis offers the possibility
of securing good spectra for months after its outburst, the information on the
spectral evolution of the nova is rather fragmentary. A few spectra of the nova
were obtained by Adams and Joy (1920) during the maximum of 1920. They show an
emission spectrum with wide lines of H, OII, NII, FeII, etc. accompanied on
the violet side by absorption components indicating a radial velocity
of -1700 km/s. Joy in 1945 observed the nova about four and a half months after
maximum and found a high excitation emission spectrum with bright lines of H,
HeI and HeII, forbidden lines of NII, OI, OII, OIII, NeIII, NIV, SII, FeV,
FeVI and coronal lines of FeX and FeXIV. The expansion velocity, estimated by
the halfwidth of the emission bands was near 1700 km/s as in 1920. At minimum,
the spectrum was studied by Humason (1938), Babcock and Elvey (1943) who found,
over a continuum of variable intensity, emission lines of moderate strength due
to H, HeII 4686 and OIII, as in other
normal novae. No companion has been hitherto found.
OBSERVATIONAL MATERIAL
The spectroscopic observations of T Pyx began at Asiago on Jan 31, 22
days after maximum, the visual magnitude of the nova being about 7.5,
and were interrupted seventy days later, on April 11, when the object at
magnitude 10.2 was no longer observable at the latitude of Asiago for its
low altitude on the horizon. The spectroscopic material is listed in Table I.
The epochs of the spectroscopic observations are marked in the mean light
curve reproduced in Fig. 1.
Two spectrographs were employed: spectrograph AI (cassegrain) which gives
a dispersion of 75 A/mm at H_gamma and 330 A/mm at lambda 7000 A; spectrograph
BI (newtonian) which gives 130 and 630 A/mm at the same wavelengths. The slit
was mostly orientated in the direction of the atmospheric spectrum, the effect
of which was not negligeable in view of the low altitude of the object.
The wave lengths of emission and absorption features on the spectra were
determined using the Hilger measuring machine (Rosino) or directly
on the microphotograms (Chincarini). The results of the two independent
determinations were always found in good agreement.
The final results of measurements and identifications are reported in
Table II, which gives, in the successive columns: I, the mean observed wave
length; II, the weight, determined by the number of the spectra used in the
mean wave length (Cam. AI, weight 2; Cam. BI, weight 1); III, mean visually
estimated intensity (H_beta = 30; trace = 0, on 103a-F for the blue-visual, IN
for the infrared). IV, V, VI, wave length, ion and multiplet of the suggested
identification; VII, difference O-C between the observed and laboratory wave
length. Further comments are given in the foot notes.
Table I
Observational material
Plate No. Date UT Phase EXP. Emul. Camera
7357 1967 Jan. 31 1h 45m 22d 90m 103a-F AI
7361 1967 Feb. 2 22 35 24 30 103a-F AI
7362 1967 Feb. 2 23 40 24 80 IIa-O bkd AI
7363 1967 Feb. 3 0 40 24 20 IN sens. AI
7364 1967 Feb. 3 1 30 24 60 IN sens. AI
1198 1967 Feb. 6 22 59 28 25 103a-F BI
1199 1967 Feb. 6 23 48 28 40 IN sens. BI
7381 1967 Feb. 24 23 10 46 70 103a-F AI
1222 1967 Mar. 15 21 30 65 40 103a-F BI
1223 1967 Mar. 15 22 00 65 15 103a-F BI
1224 1967 Mar. 16 22 00 66 45 IN sens. BI
1227 1967 Apr. 11 19 50 92 40 103a-O BI
Note: Objective prism spectra (dispersion 450 and 630 A/mm at H_gamma)
have also been obtained with the two Schmidts of Asiago on
Feb. 2, 3, 6, 8, 9 and March 15. The quality is poor because
of bad seeing, due to low altitude. They have been used only for
the continuum.
DISCUSSION
The spectra of T Pyx obtained at Asiago from Jan. 31 to Feb. 6 are typical of
novae in the early decline. The continuum, as shown by objective prism spectra,
is relatively strong and, in spite of the intense atmospheric extinction, is
well extended in the ultraviolet, like that of a B-A type star. Wide emission
lines due to H (from H_alpha to H_11), HeI (4471, 5015, 5084, 5876, 6678), HeII
(4686), CII, NII, NIII, OI, SiII, FeII appear over the continuum and are
accompanied on the blue side by a system of displaced absorption components.
The measured half-width of the emission features is approximately 12-15 A.
Some of the emissions, particularly on the spectral region between H_beta and
H_gamma are blended together.
The absorption system associated with the Balmer emissions is particularly
sharp and strong and can be recorded up to H_12. Lines of others atoms have
absorption components much weaker and rather diffuse.
Measurements of the central wave lengths of the hydrogen absorption components
yield expansion velocities of 1535 +- 85 km/s on Jan. 31, 1760 +- 30 km/s
on Feb. 2 and 1820 +- 30 km/s on Feb. 6. The other absorption lines give values
slightly higher. The mean radial velocity over the period
Jan. 31 - Feb. 6 determined from all the measurable absorptions lines, is:
-1810 +- 40 km/s in good agreement with the value given by Adams and Joy in
1920, near the maximum (-1700 km/s).
Table II
Identification of emission lines
lambda Weight Int. Ident. Atom Mult. Notes
obs
3771 2 2 3770.6 H_11 2
3798 2 2 3797.9 H_10 2
3887 3 2-3 3889.1 H_8 2
3969 4 4 3970.1 H_epsilon 1
3995 1 3 3995.0 NII 13
4057 1 3-4 4068.6 [SII] 1F 1
4102 9 8-11 /4097.3 NIII 1 2
| 4101.7 H_delta 1
\4103.4 NIII 1
4191 1 1-2 /4195.7 NIII 6 1
\4200.4
4240 1 0-1 /4237.0 NII 47, 48
\4241.8
4271 1 0 /4267.0 CII 6 3
\4267.3
4318-25 1 2-3 /4317.19 OII 2 4
\4325.8 CII 28
4341 11 14 4340.5 H_gamma 1 5
4369 3 3-20 4363.2 [OIII] 2F
4415 3 3 /4411.4 CII 39
\4415.17 OII 5
4446 1 4 4447.0 NII 15 6
4470 3 4-5 4471.5 HeI 14
4514-24 4 2-20 4520 NIII 3 7
4537-51 2 2 /4541.6 HeII 2 8
| 4535.47 NIII 3
\4549.56 FeII 38.37
4595 7 2-3 /4583.9 FeII 38 8
| 4591.0 OII 15
\4596.2
4647 10 3-45 /4634.41 NIII 2 9
\4647.51 CIII 1
4686 5 3-10 4685.7 HeII 1 10
4702 7 5 /4699 OII 40
| 4703 HeI 12
\4713
4798 5 2-3 /4788 NII 20 11
\4803
4861 11 30 4861.3 H 1
4880 4 1-2 /4881.84 NIII 9
\4891 OII 28
4925 8 1-2 /4921.9 HeI 48
\4924.6 OII 28
4959 1 0-1 4958.9 [OIII] 1F 12
5007 8 2-25 5006.8 [OIII] 1F 13
5015 6 3-4 5015.7 HeI 4
5048 4 1-2 /5045.1 NII 4
\5047.7 HeI 47
5175 8 3-4 5171-79 NII 70.66 14
5312 2 1-2 5314.5 NIII 15
5584 2 2 5577.4 [OI] 3F 15
5682 8 5-17 /5679.6 NII 3 16
\5677.0 [FeVI]? 1F
5756 4 4-25 5754.6 [NII] 3F 17
5816 2 2-3 /5801.5 CIV 1 18
\5812.1
5878 9 5-9 5875.6 HeI 11 19
5942 6 4-5 5941.7 NII 28 20
6002 1 2-3 5991.4 FeII 46 21
6022 1 2 6021.2 FeII? 24 21
6083 1 1-2 /6074.1 HeII 8
\6084.1 FeII 46
6160 3 3-4 6156-58 OI 10
6167.8 NII 36.60
6207 1 3 - - - 22
6310 1 1-2 6300 [OI] 1F 23
6287-6312 SII 26
6349 2 3-4 /6340.7 NII 46 21
| 6347.1 SiII 2
\6357.0 NII 46
6375 4 3-4 6372.9 [FeX] 1F 24
6481 6 3-10 /6467 NIII 14 25
\6482 NII 8
6563 6 50 6562.8 H_alpha 1
6675 4 - 6678.1 HeI 46
6720 1 - 6716-30 [SII] 2F
7077 1 - 7065.2 HeI 10
7223 1 2 7231-36 CII 3
7324 2 2-3 7319-30 [OII] 2F 26
7494 2 10 7476-80 OI 55 27
7772 4 20 7772-75 OI 1
8034 1 2 - - - 28
8239 4 20 /8216 NI 2 29
| 8232-35 OI 34
\8237 HeII 6
8445 4 30? 8446 OI 4 30
8657 4 30? /8629 NI 8.1 31
\8680
Notes:
1. The identification is doubtful.
2. Broad diffuse band.
3. Probably in blend with multiplets 67, 68 of OII
4. The identification is somewhat doubtful. Many other components of OII
and CII are probably in the blend.
5. These two lines are partially in blend. In the first spectra H_gamma
is prominent, but in April lambda 4363 is definitely stronger than H_gamma.
The estimated intensities are very rough.
6. Partially in blend.
7. Diffuse blend of mult. 3 of NIII. Its strength increases in March and April.
8. Diffuse blend. The contribution of FeII is doubtful.
9. Wide band of complex structure partially in blend with 4686 HeII.
The chief contributor is mult. 2 of NIII. The displaced wave length of
the band suggests CIII as a possible contributor. The intensity of
the band increases enormously in March and April.
10. The line strengthens in March and April. Partially in blend with 4647 and 4702.
11. Blend of NII mult. 20.
12. Weakly represented in March.
13. In blend with 5015 HeI and probably also with 5003-11 NII. By March its
intensity considerably increases and in April it becomes the chief
contributor of the blend.
14. Broad blend of NII lines. [FeVI] 5176 may be a possible contributor in
the late stages.
15. Partly atmospheric.
16. Blend of the complete mult. 3 of NII. The emission band which represents
the blend increases considerably in intensity by March. The presence of
[Fe VI] 5677 may explain the strengthening of the band.
17. The auroral line [NII] 5755 is present from the beginning and gradually
increases in strength. By March the line is nearly comparable in intensity
to H_beta.
18. The representation with CIV is somewhat doubtful. No better identifications
have been found.
19. Gradually increasing in strength.
20. Blend of the mult. 28.
21. The identification is somewhat doubtful.
22. Unidentified.
23. The presence of SII is somewhat doubtful.
24. Comparisons with spectra of RS Oph show that the identification is correct.
The line is present from February, slowly increasing in strength.
Possibly in blend with 6364 [OI].
25. In blend; however, in some spectra the maxima appear separated.
The intensity of NIII increases in March.
26. The line emerges on the spectra taken in March. Increasing intensity.
27. The identification is somewhat doubtful.
28. The wave length is uncertain. Unidentified.
29. The mail contributors of this strong band are probably NI and OI.
30. The estimate of the intensity is very uncertain.
31. Broad blend of multiplets 1, 8 of NI.
The infrared spectrum has been obtained on hypersensitized IN emulsion.
It consists of fairly strong emission lines of HeI, OI and NI, which were also
observed by Joy in 1944 and are common in normal novae.
In conclusion, the spectra obtained during the period Jan. 31-Feb. 6
indicate a state of moderate excitation in the expanding envelope around the
nova. Forbidden lines are represented by [NII] 5755 and possibly by [OIII]
5006. NIII 4640 and a faint HeII 4686, are blended in a wide band of low
intensity.
The situation radically changes in March and April 1967. In the spectra taken
on March 15-16 and April 11, the continuum has become weak, the absorption
lines have disappeared, or faded to a diffuse trace which cannot be measured.
A general increase in the degree of ionization is indicated by the appearance
of new lines and by the strengthening of permitted and forbidden lines of ions
with a higher ionization potential. The star has entered the nebular stage.
The NII and NIII permitted emission lines have had a flash-like increase
of intensity. On April 11, the NIII blend at 4640 represents the strongest
emission feature in the blue-violet spectrum of the nova. [NII] 5755 is also an
outstanding feature, while [OIII] is represented by lambda 5006 rapidly growing
in strength (with 4959) and by the auroral line 4363, which in April appears
much stronger than H_gamma, although in blend with it. HeII 4686, partially in
blend with 4640, has also strengthened as have the other HeII lines. The
infrared spectrum, on the contrary, has not substantially changed, except
for the appearance of OII 7324 in emission.
An interesting point is the presence of coronal line 6374 of [FeX] which
at first appeared somewhat doubtful. However, its identification with a sharp
emission line at about 6374, well visible in the spectra of March and also,
although fainter, in the spectra of February, seems to be well authenticated
by the measures and by comparisons with spectra of RS Oph taken with the same
instrument. It should be remembered that in RS Oph [FeX] 6374 made an early
appearance and became later one of the most prominent lines of its spectrum.
Fig. 1. Light curve of T Pyx in 1966-67 (Mayall, JRAS Canada 61, 350). Vertical
lines sign the epochs of the spectroscopic observations.
While other recurrent novae (T CrB, RS Oph) have an extremely fast variation
during the outburst, T Pyx can be classified as a relatively slow nova, with
a flat maximum and slow decline of brightness. In 1966-67 it took the nova
about 30d from the epoch of maximum to decline by one magnitude, 50d by two
magnitudes and 80d by three magnitudes. The corresponding figures for RS Oph
are: 4d for a decline of two magnitudes; 9d for three magnitudes. RS Oph is
therefore about ten times faster than T Pyxidis.
Although the relatively slow decline of T Pyxidis offers the possibility
of securing good spectra for months after its outburst, the information on the
spectral evolution of the nova is rather fragmentary. A few spectra of the nova
were obtained by Adams and Joy (1920) during the maximum of 1920. They show an
emission spectrum with wide lines of H, OII, NII, FeII, etc. accompanied on
the violet side by absorption components indicating a radial velocity
of -1700 km/s. Joy in 1945 observed the nova about four and a half months after
maximum and found a high excitation emission spectrum with bright lines of H,
HeI and HeII, forbidden lines of NII, OI, OII, OIII, NeIII, NIV, SII, FeV,
FeVI and coronal lines of FeX and FeXIV. The expansion velocity, estimated by
the halfwidth of the emission bands was near 1700 km/s as in 1920. At minimum,
the spectrum was studied by Humason (1938), Babcock and Elvey (1943) who found,
over a continuum of variable intensity, emission lines of moderate strength due
to H, HeII 4686 and OIII, as in other
normal novae. No companion has been hitherto found.
OBSERVATIONAL MATERIAL
The spectroscopic observations of T Pyx began at Asiago on Jan 31, 22
days after maximum, the visual magnitude of the nova being about 7.5,
and were interrupted seventy days later, on April 11, when the object at
magnitude 10.2 was no longer observable at the latitude of Asiago for its
low altitude on the horizon. The spectroscopic material is listed in Table I.
The epochs of the spectroscopic observations are marked in the mean light
curve reproduced in Fig. 1.
Two spectrographs were employed: spectrograph AI (cassegrain) which gives
a dispersion of 75 A/mm at H_gamma and 330 A/mm at lambda 7000 A; spectrograph
BI (newtonian) which gives 130 and 630 A/mm at the same wavelengths. The slit
was mostly orientated in the direction of the atmospheric spectrum, the effect
of which was not negligeable in view of the low altitude of the object.
The wave lengths of emission and absorption features on the spectra were
determined using the Hilger measuring machine (Rosino) or directly
on the microphotograms (Chincarini). The results of the two independent
determinations were always found in good agreement.
The final results of measurements and identifications are reported in
Table II, which gives, in the successive columns: I, the mean observed wave
length; II, the weight, determined by the number of the spectra used in the
mean wave length (Cam. AI, weight 2; Cam. BI, weight 1); III, mean visually
estimated intensity (H_beta = 30; trace = 0, on 103a-F for the blue-visual, IN
for the infrared). IV, V, VI, wave length, ion and multiplet of the suggested
identification; VII, difference O-C between the observed and laboratory wave
length. Further comments are given in the foot notes.
Table I
Observational material
Plate No. Date UT Phase EXP. Emul. Camera
7357 1967 Jan. 31 1h 45m 22d 90m 103a-F AI
7361 1967 Feb. 2 22 35 24 30 103a-F AI
7362 1967 Feb. 2 23 40 24 80 IIa-O bkd AI
7363 1967 Feb. 3 0 40 24 20 IN sens. AI
7364 1967 Feb. 3 1 30 24 60 IN sens. AI
1198 1967 Feb. 6 22 59 28 25 103a-F BI
1199 1967 Feb. 6 23 48 28 40 IN sens. BI
7381 1967 Feb. 24 23 10 46 70 103a-F AI
1222 1967 Mar. 15 21 30 65 40 103a-F BI
1223 1967 Mar. 15 22 00 65 15 103a-F BI
1224 1967 Mar. 16 22 00 66 45 IN sens. BI
1227 1967 Apr. 11 19 50 92 40 103a-O BI
Note: Objective prism spectra (dispersion 450 and 630 A/mm at H_gamma)
have also been obtained with the two Schmidts of Asiago on
Feb. 2, 3, 6, 8, 9 and March 15. The quality is poor because
of bad seeing, due to low altitude. They have been used only for
the continuum.
DISCUSSION
The spectra of T Pyx obtained at Asiago from Jan. 31 to Feb. 6 are typical of
novae in the early decline. The continuum, as shown by objective prism spectra,
is relatively strong and, in spite of the intense atmospheric extinction, is
well extended in the ultraviolet, like that of a B-A type star. Wide emission
lines due to H (from H_alpha to H_11), HeI (4471, 5015, 5084, 5876, 6678), HeII
(4686), CII, NII, NIII, OI, SiII, FeII appear over the continuum and are
accompanied on the blue side by a system of displaced absorption components.
The measured half-width of the emission features is approximately 12-15 A.
Some of the emissions, particularly on the spectral region between H_beta and
H_gamma are blended together.
The absorption system associated with the Balmer emissions is particularly
sharp and strong and can be recorded up to H_12. Lines of others atoms have
absorption components much weaker and rather diffuse.
Measurements of the central wave lengths of the hydrogen absorption components
yield expansion velocities of 1535 +- 85 km/s on Jan. 31, 1760 +- 30 km/s
on Feb. 2 and 1820 +- 30 km/s on Feb. 6. The other absorption lines give values
slightly higher. The mean radial velocity over the period
Jan. 31 - Feb. 6 determined from all the measurable absorptions lines, is:
-1810 +- 40 km/s in good agreement with the value given by Adams and Joy in
1920, near the maximum (-1700 km/s).
Table II
Identification of emission lines
lambda Weight Int. Ident. Atom Mult. Notes
obs
3771 2 2 3770.6 H_11 2
3798 2 2 3797.9 H_10 2
3887 3 2-3 3889.1 H_8 2
3969 4 4 3970.1 H_epsilon 1
3995 1 3 3995.0 NII 13
4057 1 3-4 4068.6 [SII] 1F 1
4102 9 8-11 /4097.3 NIII 1 2
| 4101.7 H_delta 1
\4103.4 NIII 1
4191 1 1-2 /4195.7 NIII 6 1
\4200.4
4240 1 0-1 /4237.0 NII 47, 48
\4241.8
4271 1 0 /4267.0 CII 6 3
\4267.3
4318-25 1 2-3 /4317.19 OII 2 4
\4325.8 CII 28
4341 11 14 4340.5 H_gamma 1 5
4369 3 3-20 4363.2 [OIII] 2F
4415 3 3 /4411.4 CII 39
\4415.17 OII 5
4446 1 4 4447.0 NII 15 6
4470 3 4-5 4471.5 HeI 14
4514-24 4 2-20 4520 NIII 3 7
4537-51 2 2 /4541.6 HeII 2 8
| 4535.47 NIII 3
\4549.56 FeII 38.37
4595 7 2-3 /4583.9 FeII 38 8
| 4591.0 OII 15
\4596.2
4647 10 3-45 /4634.41 NIII 2 9
\4647.51 CIII 1
4686 5 3-10 4685.7 HeII 1 10
4702 7 5 /4699 OII 40
| 4703 HeI 12
\4713
4798 5 2-3 /4788 NII 20 11
\4803
4861 11 30 4861.3 H 1
4880 4 1-2 /4881.84 NIII 9
\4891 OII 28
4925 8 1-2 /4921.9 HeI 48
\4924.6 OII 28
4959 1 0-1 4958.9 [OIII] 1F 12
5007 8 2-25 5006.8 [OIII] 1F 13
5015 6 3-4 5015.7 HeI 4
5048 4 1-2 /5045.1 NII 4
\5047.7 HeI 47
5175 8 3-4 5171-79 NII 70.66 14
5312 2 1-2 5314.5 NIII 15
5584 2 2 5577.4 [OI] 3F 15
5682 8 5-17 /5679.6 NII 3 16
\5677.0 [FeVI]? 1F
5756 4 4-25 5754.6 [NII] 3F 17
5816 2 2-3 /5801.5 CIV 1 18
\5812.1
5878 9 5-9 5875.6 HeI 11 19
5942 6 4-5 5941.7 NII 28 20
6002 1 2-3 5991.4 FeII 46 21
6022 1 2 6021.2 FeII? 24 21
6083 1 1-2 /6074.1 HeII 8
\6084.1 FeII 46
6160 3 3-4 6156-58 OI 10
6167.8 NII 36.60
6207 1 3 - - - 22
6310 1 1-2 6300 [OI] 1F 23
6287-6312 SII 26
6349 2 3-4 /6340.7 NII 46 21
| 6347.1 SiII 2
\6357.0 NII 46
6375 4 3-4 6372.9 [FeX] 1F 24
6481 6 3-10 /6467 NIII 14 25
\6482 NII 8
6563 6 50 6562.8 H_alpha 1
6675 4 - 6678.1 HeI 46
6720 1 - 6716-30 [SII] 2F
7077 1 - 7065.2 HeI 10
7223 1 2 7231-36 CII 3
7324 2 2-3 7319-30 [OII] 2F 26
7494 2 10 7476-80 OI 55 27
7772 4 20 7772-75 OI 1
8034 1 2 - - - 28
8239 4 20 /8216 NI 2 29
| 8232-35 OI 34
\8237 HeII 6
8445 4 30? 8446 OI 4 30
8657 4 30? /8629 NI 8.1 31
\8680
Notes:
1. The identification is doubtful.
2. Broad diffuse band.
3. Probably in blend with multiplets 67, 68 of OII
4. The identification is somewhat doubtful. Many other components of OII
and CII are probably in the blend.
5. These two lines are partially in blend. In the first spectra H_gamma
is prominent, but in April lambda 4363 is definitely stronger than H_gamma.
The estimated intensities are very rough.
6. Partially in blend.
7. Diffuse blend of mult. 3 of NIII. Its strength increases in March and April.
8. Diffuse blend. The contribution of FeII is doubtful.
9. Wide band of complex structure partially in blend with 4686 HeII.
The chief contributor is mult. 2 of NIII. The displaced wave length of
the band suggests CIII as a possible contributor. The intensity of
the band increases enormously in March and April.
10. The line strengthens in March and April. Partially in blend with 4647 and 4702.
11. Blend of NII mult. 20.
12. Weakly represented in March.
13. In blend with 5015 HeI and probably also with 5003-11 NII. By March its
intensity considerably increases and in April it becomes the chief
contributor of the blend.
14. Broad blend of NII lines. [FeVI] 5176 may be a possible contributor in
the late stages.
15. Partly atmospheric.
16. Blend of the complete mult. 3 of NII. The emission band which represents
the blend increases considerably in intensity by March. The presence of
[Fe VI] 5677 may explain the strengthening of the band.
17. The auroral line [NII] 5755 is present from the beginning and gradually
increases in strength. By March the line is nearly comparable in intensity
to H_beta.
18. The representation with CIV is somewhat doubtful. No better identifications
have been found.
19. Gradually increasing in strength.
20. Blend of the mult. 28.
21. The identification is somewhat doubtful.
22. Unidentified.
23. The presence of SII is somewhat doubtful.
24. Comparisons with spectra of RS Oph show that the identification is correct.
The line is present from February, slowly increasing in strength.
Possibly in blend with 6364 [OI].
25. In blend; however, in some spectra the maxima appear separated.
The intensity of NIII increases in March.
26. The line emerges on the spectra taken in March. Increasing intensity.
27. The identification is somewhat doubtful.
28. The wave length is uncertain. Unidentified.
29. The mail contributors of this strong band are probably NI and OI.
30. The estimate of the intensity is very uncertain.
31. Broad blend of multiplets 1, 8 of NI.
The infrared spectrum has been obtained on hypersensitized IN emulsion.
It consists of fairly strong emission lines of HeI, OI and NI, which were also
observed by Joy in 1944 and are common in normal novae.
In conclusion, the spectra obtained during the period Jan. 31-Feb. 6
indicate a state of moderate excitation in the expanding envelope around the
nova. Forbidden lines are represented by [NII] 5755 and possibly by [OIII]
5006. NIII 4640 and a faint HeII 4686, are blended in a wide band of low
intensity.
The situation radically changes in March and April 1967. In the spectra taken
on March 15-16 and April 11, the continuum has become weak, the absorption
lines have disappeared, or faded to a diffuse trace which cannot be measured.
A general increase in the degree of ionization is indicated by the appearance
of new lines and by the strengthening of permitted and forbidden lines of ions
with a higher ionization potential. The star has entered the nebular stage.
The NII and NIII permitted emission lines have had a flash-like increase
of intensity. On April 11, the NIII blend at 4640 represents the strongest
emission feature in the blue-violet spectrum of the nova. [NII] 5755 is also an
outstanding feature, while [OIII] is represented by lambda 5006 rapidly growing
in strength (with 4959) and by the auroral line 4363, which in April appears
much stronger than H_gamma, although in blend with it. HeII 4686, partially in
blend with 4640, has also strengthened as have the other HeII lines. The
infrared spectrum, on the contrary, has not substantially changed, except
for the appearance of OII 7324 in emission.
An interesting point is the presence of coronal line 6374 of [FeX] which
at first appeared somewhat doubtful. However, its identification with a sharp
emission line at about 6374, well visible in the spectra of March and also,
although fainter, in the spectra of February, seems to be well authenticated
by the measures and by comparisons with spectra of RS Oph taken with the same
instrument. It should be remembered that in RS Oph [FeX] 6374 made an early
appearance and became later one of the most prominent lines of its spectrum.
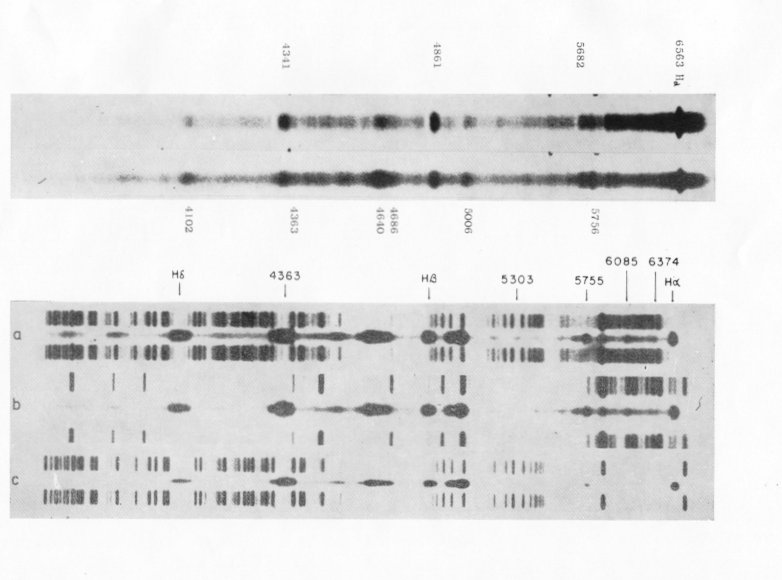 Fig. 2. On the left: T Pyx: 1967 Feb. 6; 1967 March 15
(122 cm telescope, Cam. BI).
On the right: T Pyx: 1945 Apr. 4; Apr. 12; Apr. 17
(from Joy, PASP 57, Plate IX).
Table III gives the variations of the relative intensities for some of the
most representative lines, from Jan. 31 to Apr. 11. A comparison of the spectra
of February and March is shown in Figs. 2 and 3 which reproduce some spectra
and microphotometer tracings.
Table III
Variations in the relative intensity of emission lines in T Pyxidis (1967)
Jan. 31-
Atoms Feb. 24 Mar. 15 Apr. 11
Feb. 2
4102 H delta 9 9 10 11
4341-4363 H gamma + [OIII] 14 13 14 25
4514-4524 NIII - 2 7 20
4640-4686 NIII + HeII 8 16 28 45
4861 H beta 30 30 30 30
5006-5015 [OIII] + HeI 8 16 17 25
5679 NII 5 12 17 -
5755 [NII] 4 7 20 -
5876 HeI 5 7 9 -
Unfortunately, the southern declination of the nova prevented us from
continuing the observations just in the most interesting phase, when the
nebular spectrum was attaining its maximum strength, and forbidden lines of
highly ionized atoms were on the point of appearing. This phase, however,
was covered by Joy (1945) in 1944. In Fig. 2 we have reproduced together with
our spectra and in the same scale, three of Joy's spectra taken one hundred
and thirty days past maximum, which illustrate the successive development of
the spectrum of T Pyxidis. So, all of the stages in the spectral evolution
of this nova, except the latest, are now covered by observations. Continuous
spectroscopic control of T Pyx at minimum from a southern Observatory
should be highly desirable for a better understanding of the phenomena
involved in the periodic outburst of this and other recurrent novae.
In conclusion, although different from RS Oph and T CrB for the slower
photometric and spectroscopic evolution and the apparent absence of a companion,
T Pyx displays some of the same phenomena which have been observed in normal
and recurrent novae, such as the development near maximum of absorption systems
of large radial velocities and, in a more advanced phase of evolution, of broad
emission lines of high excitation. The most astonishing fact is the appearance
of coronal lines (FeX, FeXIV) during the decline of brightness, which seems to
be a common characteristic of all recurrent novae and was observed in T Pyx as
well as in T CrB and RS Oph. The source of such a high degree of ionization is
still unknown, and can be tentatively attributed to collision with material
surrounding the star, or to photoionization, or to ejection of material from
the deep interior of the star at the moment of the outburst.
Fig. 2. On the left: T Pyx: 1967 Feb. 6; 1967 March 15
(122 cm telescope, Cam. BI).
On the right: T Pyx: 1945 Apr. 4; Apr. 12; Apr. 17
(from Joy, PASP 57, Plate IX).
Table III gives the variations of the relative intensities for some of the
most representative lines, from Jan. 31 to Apr. 11. A comparison of the spectra
of February and March is shown in Figs. 2 and 3 which reproduce some spectra
and microphotometer tracings.
Table III
Variations in the relative intensity of emission lines in T Pyxidis (1967)
Jan. 31-
Atoms Feb. 24 Mar. 15 Apr. 11
Feb. 2
4102 H delta 9 9 10 11
4341-4363 H gamma + [OIII] 14 13 14 25
4514-4524 NIII - 2 7 20
4640-4686 NIII + HeII 8 16 28 45
4861 H beta 30 30 30 30
5006-5015 [OIII] + HeI 8 16 17 25
5679 NII 5 12 17 -
5755 [NII] 4 7 20 -
5876 HeI 5 7 9 -
Unfortunately, the southern declination of the nova prevented us from
continuing the observations just in the most interesting phase, when the
nebular spectrum was attaining its maximum strength, and forbidden lines of
highly ionized atoms were on the point of appearing. This phase, however,
was covered by Joy (1945) in 1944. In Fig. 2 we have reproduced together with
our spectra and in the same scale, three of Joy's spectra taken one hundred
and thirty days past maximum, which illustrate the successive development of
the spectrum of T Pyxidis. So, all of the stages in the spectral evolution
of this nova, except the latest, are now covered by observations. Continuous
spectroscopic control of T Pyx at minimum from a southern Observatory
should be highly desirable for a better understanding of the phenomena
involved in the periodic outburst of this and other recurrent novae.
In conclusion, although different from RS Oph and T CrB for the slower
photometric and spectroscopic evolution and the apparent absence of a companion,
T Pyx displays some of the same phenomena which have been observed in normal
and recurrent novae, such as the development near maximum of absorption systems
of large radial velocities and, in a more advanced phase of evolution, of broad
emission lines of high excitation. The most astonishing fact is the appearance
of coronal lines (FeX, FeXIV) during the decline of brightness, which seems to
be a common characteristic of all recurrent novae and was observed in T Pyx as
well as in T CrB and RS Oph. The source of such a high degree of ionization is
still unknown, and can be tentatively attributed to collision with material
surrounding the star, or to photoionization, or to ejection of material from
the deep interior of the star at the moment of the outburst.
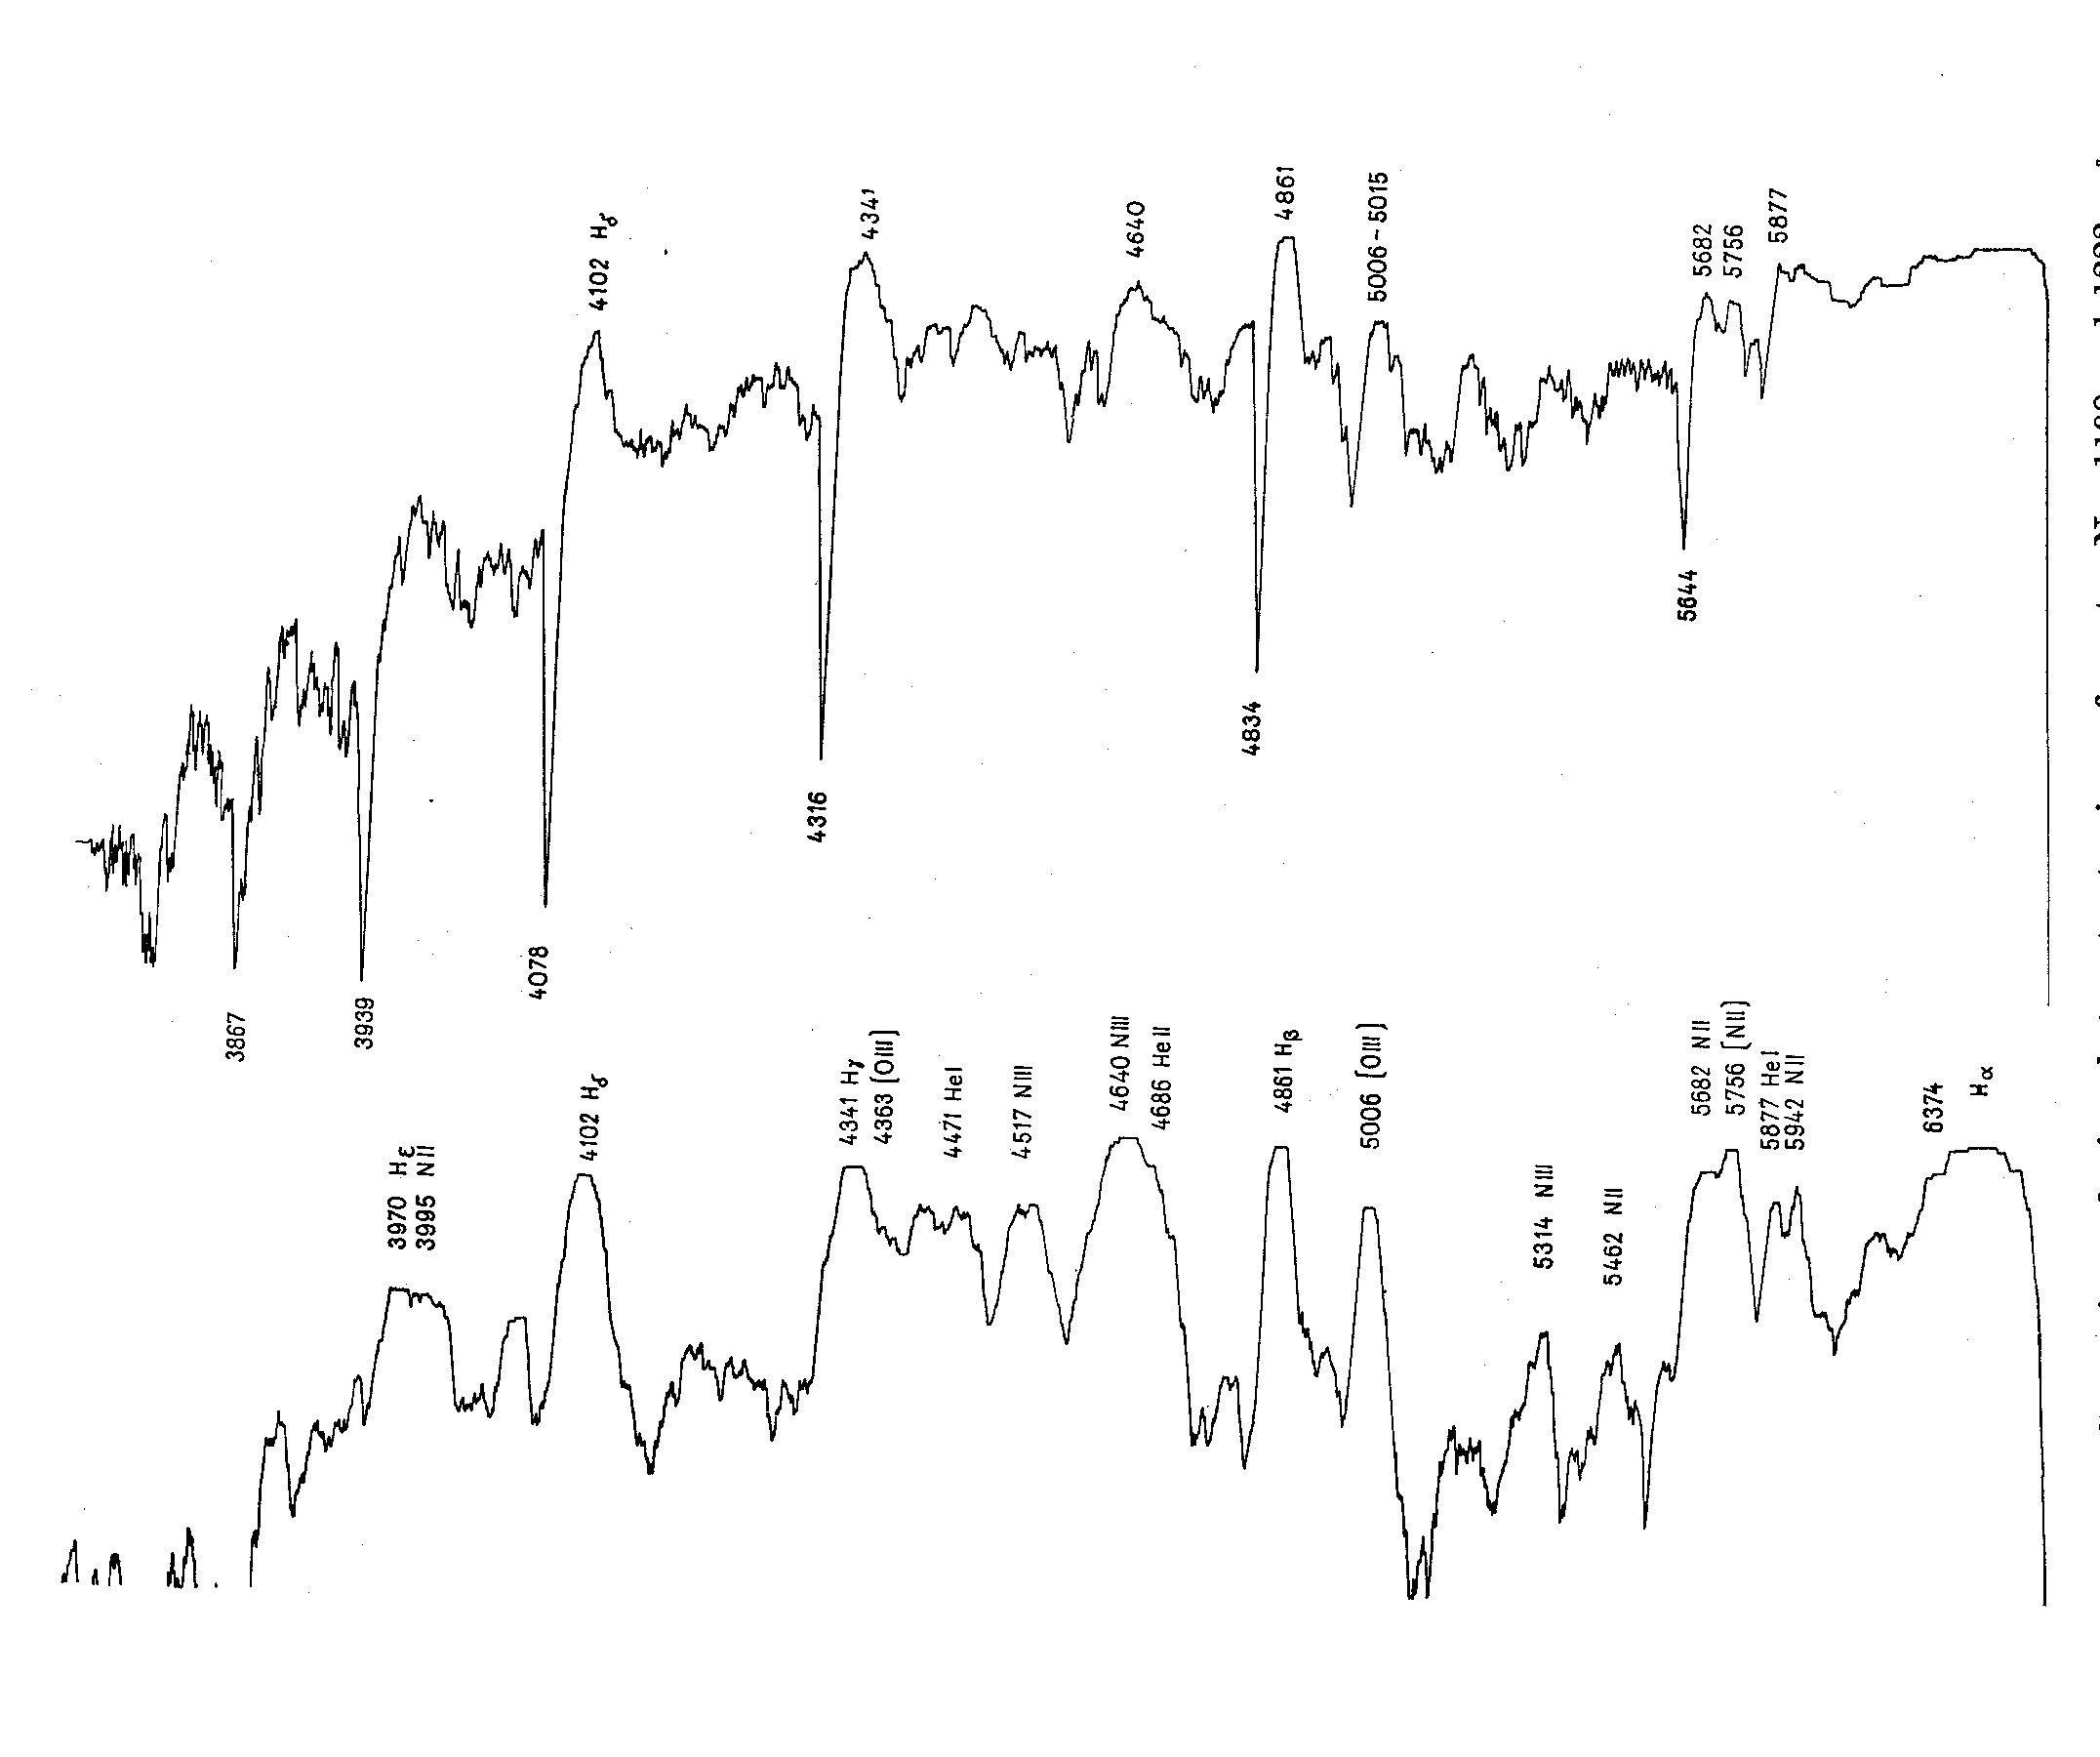 Fig. 3. Comparison of microphotometer tracings of spectra No. 1198 and 1222.
REFERENCES
Adams, W. S. and Joy, A. H., 1920, Pop. Astr. 28, 514.
Babcock, H. W., Elvey, C. T., 1943, Astrophys. J. 97, 412.
Humason, M. L., 1938, Astrophys. J. 88, 228.
Jones, A., 1966, IAU Circ. 1983.
Joy, A. H., 1945, Publ. astr. Soc. Pacific 57, 171.
Mayall, M. W., 1967, J. R. astr. Soc. Can. 61, 350.
COMMENT
Feast: A series of spectra of T Pyx was obtained at the Radcliffe Observatory
and these have been discussed by Mr. R. Catchpole whose paper will
appear shortly. Evidence for coronal lines was obtained although they
never became very strong.
Fig. 3. Comparison of microphotometer tracings of spectra No. 1198 and 1222.
REFERENCES
Adams, W. S. and Joy, A. H., 1920, Pop. Astr. 28, 514.
Babcock, H. W., Elvey, C. T., 1943, Astrophys. J. 97, 412.
Humason, M. L., 1938, Astrophys. J. 88, 228.
Jones, A., 1966, IAU Circ. 1983.
Joy, A. H., 1945, Publ. astr. Soc. Pacific 57, 171.
Mayall, M. W., 1967, J. R. astr. Soc. Can. 61, 350.
COMMENT
Feast: A series of spectra of T Pyx was obtained at the Radcliffe Observatory
and these have been discussed by Mr. R. Catchpole whose paper will
appear shortly. Evidence for coronal lines was obtained although they
never became very strong.