Non-Periodic Phenomena in Variable Stars
IAU Colloquium, Budapest, 1968
ON NOVA DELPHINI 1967 AND SOME SLOW NOVA
CHARACTERISTICS
WALTRAUT CAROLA SEITTER
Observatorium Hoher List, Daun (Eifel), Germany
A Schmidt telescope equipped with an objective prism is not the most
suitable instrument for observing spectral changes of a single object; yet,
lacking other spectroscopic equipment, we have used this combination to
follow the development of Nova Delphini 1967 for more than a year. The major
advantages and disadvantages of the instrumentation are summarized in
Table I. It may be added that a low resolution applied to very complex objects
occasionally facilitates the recognition of major trends which might be more
difficult to extract from the wealth of detail seen at larger dispersions.
Table 2 gives the characteristics of our instrument.
155 spectrograms were obtained on Kodak I-N plates between July 16,
1967 and August 26, 1968. A complete atlas will be published elsewhere.
Representative samples are shown in Fig. 1. The following history of the
nova is assembled from brightness determinations published by various authors
(IAU Circulars 1967--68, Sky Tel. 34, 300, Rev. Pop. Astr. 62, 23, 1968) and a
visual inspection of our plates plus one set of radial velocity measurements.
The spectral analysis is quite incomplete and subject to some changes,
especially concerning the dates of first and last observations of lines,
after quantitative measurements of our spectra become available. Only some
of the more prominent features are described.
Two main periods of grossly different nova behaviour may be distinguished.
PERIOD I
During the first six months changes in both brightness and spectrum
occurred in two successive stages, the second stage showing three subdivisions.
The dates given refer to first or last appearance on the spectrograms.
The actual changes may have occurred at earlier or later dates not covered
by observations.
1. July 16-August 20
Mean brightness constant at about 6.5 magnitudes above pre-outburst
brightness with oscillations of less than 0.2 magnitude.
Both emission and absorption spectra well developed.
Strongest absorption lines: Balmer lines, Na I 5890, 5896, Ca II 3934,
3968, Ti II 3759, 3761.
Strongest emission lines: H and Fe II
Table 1
Objective prism spectra with Schmidt-telescopes
Advantages Disadvantages Compensations
Large fields Overlapping spectra Different Position Angles of
prism
All photographically
accessible wavelengths
covered simultaneously
Diffuse lines due to bad seeing
For large instruments:
Optimum exposure times Wavelength resolution limited
by seeing disk in contrast to
slit spectroscopes
of same dispersions
Comparison spectra for
photometric calibration
present
Zero point through atm. A-band
No Comparison spectra scale from neighbouring stars
for radial velocity Double exposures with direct
determinations and reversed instrument
Superimposed scales
Sky background
(Moon, twilight)
Table 2
Schmidt-telescope Hoher List
Aperture: 340 mm (Mirror: 500 mm)
Focal length: 1375 mm
Prism I
Flint glass
Angle of refraction: 7 deg 31
Reciprocal linear dispersion in A/mm at
lambda 3500 lambda 3700 H_gamma H_alpha lambda 8000
85 120 240 850 1680
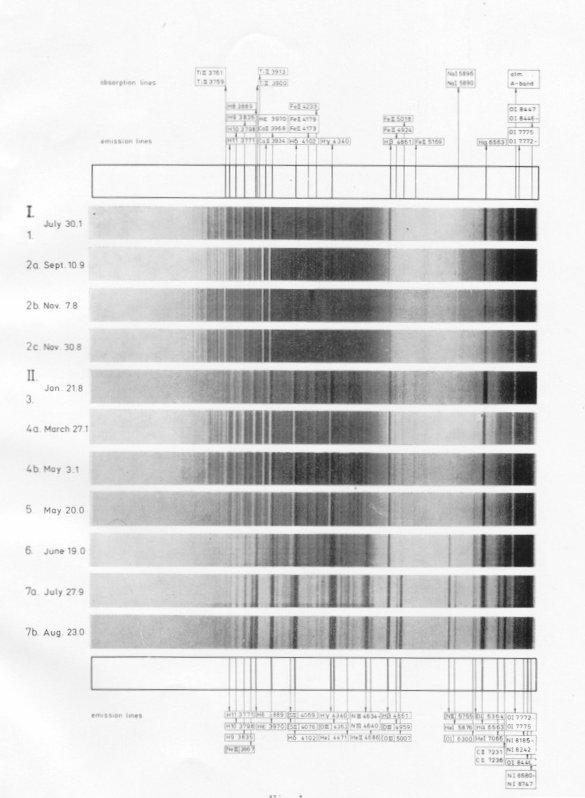 Fig. 1
Radial velocity measurements indicate --600 km/sec (+-120 km/sec) for
the H-lines. During the remainder of Period I no major velocity changes are
suggested from the appearance of the spectra.
2a. September 5-October 21
September: Nova about 0.7 magnitude brighter than during stage 1 after
an increase between August 18 and August 28.
October: Slow decline through 0.4 magnitude to broad minimum around
October 16; small oscillations as in stage 1.
The absorption spectrum resembles that of Phi Cas F0Ia. The D-lines
and numerous Ti II lines, however, are much stronger than in the supergiant
and even more pronounced than in stage 1.
Emission spectrum weak.
2b. November 8-November 12
Nova has increased again to September brightness; small oscillations as
in stage 1.
Certain absorption line intensities, e.g. between lambda 3700 and
lambda 3760 have decreased as compared with stage 2a.
No apparent changes in the emission spectrum.
2c. November 18-December 11
Mean brightness slightly lower than during stage 2b and approximately
0.6 magnitude above that of stage 1. Oscillations as before. Rise towards
secondary maximum starts December 4.
Both absorption and emission spectra practically identical with those
of stage 2a.
PERIOD II
For Period II not enough brightness data are yet available to permit
looking for a close correspondence between changes in magnitude and spectral
changes.
Photometric Data
The secondary maximum reaching 2 magnitudes above the brightness
of the first rise, occurred on December 13. It is followed by a symmetrical
decline through about 2.3 magnitudes. During the following months the
brightness oscillates about the new mean with amplitudes up to 1 magnitude.
In early July the nova starts to decline steadily through about 1.5 magnitudes.
Spectroscopic Data
Five distinct stages and two subdivisions are found in the spectral
development of the nova during Period II.
3. December 17-March 24
Absorption spectrum:
Major changes following the December maximum are.
December 17: First doubling of H-lines observable at our small dispersion.
December 28: Ca II lines distinctly double.
After December 28 the more shortward displaced Balmer and Ca II
components rapidly increase in strength and soon become dominant. By the
middle of March the primary components seem to have disappeared and the
secondary components stand separated from the unexpectedly narrow
emission lines.
The behaviour of the secondary components is compatible with their
being members of the principal absorption system.
The Sodium D-lines are weak.
One could suspect this to be caused by the bad definition of the plates
taken at very low altitudes during the months preceeding and following the
January 28 conjunction of the nova with the sun. The like behaviour of Ca II
3934, however, strengthens the assumption that the effect is real. Ca II 3934
lies in a spectral region of much better resolution and is not so much affected
by bad seeing.
Ti II 3759, 3761 begin to weaken in early January and remain faint
until late March.
Emission spectrum:
Permitted lines: The beginning of Period II is marked by the reappearance
of a strong emission spectrum, especially of H and Fe II, similar to that seen
after the July outburst. The behaviour of the hydrogen lines is unusual;
they are much narrower than would be expected from the displacement of the
absorption lines.
One of the most striking features is the strong O I 8446 emission first
visible on December 18. The triplet had been absent or very weak before and
comparable in strength to the O I triplet near lambda 7774. Since the greater
intensity of O I 8446 relative to the shorter wavelength triplet is attributed
to a fluorescence effect due to Lyman beta emission (Bowen, 1947), one must
conclude that either Lyman beta has considerably increased or that the
underlying material has become much more transparent to UV radiation.
Forbidden lines: [O I] 6300 and possibly [O I] 6364 are first visible on
our spectrograms on January 9. After some slight increase they stay more or
less constant until April. 23.
[N II] 5755 is the next one of the forbidden lines to appear. It is first
seen faintly on January 30.
The emission features, too, correspond to those seen in the principal
spectrum of normal novae.
4a. March 27-April 23
Absorption spectrum:
The Balmer lines appear as in the latter part of stage 3. The D-lines
and Ca II 3934 are strong again.
Ti II 3759, 3761 first show moderate strength on March 27. The lines
display some variation, possibly synchronous with Ca II, approaching their
former prominence on March 30 and April 17.
Since these lines are sensitive indicators of a tenuous atmosphere,
conclusions relating to the density of the Ti II absorbing shell may be drawn.
A rich absorption spectrum is seen in the ultraviolet extending to the
end of the recorded spectrum near lambda 3400. It disappears after May 15.
Emission spectrum:
Permitted lines: The Balmer and Fe II lines appear as in stage 3. The
strength of O I 8446 only slightly surpasses that of O I 7774.
Forbidden lines: As in stage 3.
4b. May 3-May 15
Absorption spectrum:
Na I 5890, 5896 and Ca II 3934 strong.
Ti II 3759, 3761 as prominent as during Period I.
Emission spectrum:
Permitted lines: as in stage 4a.
Forbidden lines: [O I] 6300, 6364 have disappeared; they are possibly
masked by strong absorption lines.
[N II] 5755 has disappeared.
5. May 20-June 2
Absorption spectrum:
The Balmer lines are double again with a slightly more violet displaced
component.
Sodium, Calcium and Titanium lines fade away rapidly.
Emission spectrum:
Permitted lines: O I 8446 is again sensibly stronger than the triplet
near lambda 7774.
Forbidden lines: [O I] 6300, 6364 are stronger than ever before [N II]
5755 reappears and becomes one of the most prominent emission lines in June
and later.
6. June 7-July 18
Absorption spectrum:
The Balmer lines have disappeared; most of the other absorption lines
weaken giving place to broad absorption bands.
Emission spectrum:
The N III 4640 emission first stands out clearly on June 7. At the same
time a faint increase of Fe II 5018 signals the appearance of [O III] 5007.
The above and several other emission lines indicate that the nova has
entered the 4640 stage.
7a. July 20-July 28
Absorption spectrum:
Broad bands.
Emission spectrum:
Permitted lines: H lines become much broader. Neutral and ionized
Helium lines appear on July 18 and fully develop during stage 7a.
Forbidden lines: On July 20 [O III] 5007 suddenly begins to increase.
[O III] 4363 is first indicated on July 20 and definitely present after July 25,
when [O III] 4959 is also seen.
On July 28 the nebular spectrum has emerged including strong lines of
[Ne III].
7b. July 28 and later
The nova shows a fully developed nebular spectrum.
CONCLUSIONS
From the above description it seems that Nova Delphini has some
unusual features. For two reasons, however, I would refrain from calling it
abnormal, as has been done by some authors.
1. Nova Delphini is a very slow nova and with less than ten adequately
observed objects we have rather incomplete statistics concerning the spectral
development of this class.
2. Among the very slow novae are objects such as eta Carinae and FU
Orionis which apparently adhere even less to the established rules of nova
behaviour.
In spite of these limitations, however, it seems possible to extract from
the meager data available some general pattern of slow nova development:
A comparison of the light curves of eight slow novae shows that their
common characteristics is a flat topped maximum which is of longer duration
the slower the nova.
For some of the novae secondary maxima are well established: eta Car,
RR Pic, V 849 Oph and N Del (Payne-Gaposchkin, 1957). (see Table 3).
Fig. 2 shows the first section of a generalized slow nova light curve.
Some of the novae have shown only or predominantly absorption spectra
during the protracted maximum: FU Ori, DO Aql and N Del (Payne- Gaposchkin 1957).
Because of this evidence and because the spectral development of Nova Delphini
indicates the presence of the principal spectrum and the sequence of other
typical postmaximum spectra only after the secondary outburst, the following
hypothesis is adopted:
In slow novae the pre-maximum halt which is normally of short duration
or absent (McLaughlin, 1960) appears to be protracted as a direct function of
the slowness of the nova.
Fig. 1
Radial velocity measurements indicate --600 km/sec (+-120 km/sec) for
the H-lines. During the remainder of Period I no major velocity changes are
suggested from the appearance of the spectra.
2a. September 5-October 21
September: Nova about 0.7 magnitude brighter than during stage 1 after
an increase between August 18 and August 28.
October: Slow decline through 0.4 magnitude to broad minimum around
October 16; small oscillations as in stage 1.
The absorption spectrum resembles that of Phi Cas F0Ia. The D-lines
and numerous Ti II lines, however, are much stronger than in the supergiant
and even more pronounced than in stage 1.
Emission spectrum weak.
2b. November 8-November 12
Nova has increased again to September brightness; small oscillations as
in stage 1.
Certain absorption line intensities, e.g. between lambda 3700 and
lambda 3760 have decreased as compared with stage 2a.
No apparent changes in the emission spectrum.
2c. November 18-December 11
Mean brightness slightly lower than during stage 2b and approximately
0.6 magnitude above that of stage 1. Oscillations as before. Rise towards
secondary maximum starts December 4.
Both absorption and emission spectra practically identical with those
of stage 2a.
PERIOD II
For Period II not enough brightness data are yet available to permit
looking for a close correspondence between changes in magnitude and spectral
changes.
Photometric Data
The secondary maximum reaching 2 magnitudes above the brightness
of the first rise, occurred on December 13. It is followed by a symmetrical
decline through about 2.3 magnitudes. During the following months the
brightness oscillates about the new mean with amplitudes up to 1 magnitude.
In early July the nova starts to decline steadily through about 1.5 magnitudes.
Spectroscopic Data
Five distinct stages and two subdivisions are found in the spectral
development of the nova during Period II.
3. December 17-March 24
Absorption spectrum:
Major changes following the December maximum are.
December 17: First doubling of H-lines observable at our small dispersion.
December 28: Ca II lines distinctly double.
After December 28 the more shortward displaced Balmer and Ca II
components rapidly increase in strength and soon become dominant. By the
middle of March the primary components seem to have disappeared and the
secondary components stand separated from the unexpectedly narrow
emission lines.
The behaviour of the secondary components is compatible with their
being members of the principal absorption system.
The Sodium D-lines are weak.
One could suspect this to be caused by the bad definition of the plates
taken at very low altitudes during the months preceeding and following the
January 28 conjunction of the nova with the sun. The like behaviour of Ca II
3934, however, strengthens the assumption that the effect is real. Ca II 3934
lies in a spectral region of much better resolution and is not so much affected
by bad seeing.
Ti II 3759, 3761 begin to weaken in early January and remain faint
until late March.
Emission spectrum:
Permitted lines: The beginning of Period II is marked by the reappearance
of a strong emission spectrum, especially of H and Fe II, similar to that seen
after the July outburst. The behaviour of the hydrogen lines is unusual;
they are much narrower than would be expected from the displacement of the
absorption lines.
One of the most striking features is the strong O I 8446 emission first
visible on December 18. The triplet had been absent or very weak before and
comparable in strength to the O I triplet near lambda 7774. Since the greater
intensity of O I 8446 relative to the shorter wavelength triplet is attributed
to a fluorescence effect due to Lyman beta emission (Bowen, 1947), one must
conclude that either Lyman beta has considerably increased or that the
underlying material has become much more transparent to UV radiation.
Forbidden lines: [O I] 6300 and possibly [O I] 6364 are first visible on
our spectrograms on January 9. After some slight increase they stay more or
less constant until April. 23.
[N II] 5755 is the next one of the forbidden lines to appear. It is first
seen faintly on January 30.
The emission features, too, correspond to those seen in the principal
spectrum of normal novae.
4a. March 27-April 23
Absorption spectrum:
The Balmer lines appear as in the latter part of stage 3. The D-lines
and Ca II 3934 are strong again.
Ti II 3759, 3761 first show moderate strength on March 27. The lines
display some variation, possibly synchronous with Ca II, approaching their
former prominence on March 30 and April 17.
Since these lines are sensitive indicators of a tenuous atmosphere,
conclusions relating to the density of the Ti II absorbing shell may be drawn.
A rich absorption spectrum is seen in the ultraviolet extending to the
end of the recorded spectrum near lambda 3400. It disappears after May 15.
Emission spectrum:
Permitted lines: The Balmer and Fe II lines appear as in stage 3. The
strength of O I 8446 only slightly surpasses that of O I 7774.
Forbidden lines: As in stage 3.
4b. May 3-May 15
Absorption spectrum:
Na I 5890, 5896 and Ca II 3934 strong.
Ti II 3759, 3761 as prominent as during Period I.
Emission spectrum:
Permitted lines: as in stage 4a.
Forbidden lines: [O I] 6300, 6364 have disappeared; they are possibly
masked by strong absorption lines.
[N II] 5755 has disappeared.
5. May 20-June 2
Absorption spectrum:
The Balmer lines are double again with a slightly more violet displaced
component.
Sodium, Calcium and Titanium lines fade away rapidly.
Emission spectrum:
Permitted lines: O I 8446 is again sensibly stronger than the triplet
near lambda 7774.
Forbidden lines: [O I] 6300, 6364 are stronger than ever before [N II]
5755 reappears and becomes one of the most prominent emission lines in June
and later.
6. June 7-July 18
Absorption spectrum:
The Balmer lines have disappeared; most of the other absorption lines
weaken giving place to broad absorption bands.
Emission spectrum:
The N III 4640 emission first stands out clearly on June 7. At the same
time a faint increase of Fe II 5018 signals the appearance of [O III] 5007.
The above and several other emission lines indicate that the nova has
entered the 4640 stage.
7a. July 20-July 28
Absorption spectrum:
Broad bands.
Emission spectrum:
Permitted lines: H lines become much broader. Neutral and ionized
Helium lines appear on July 18 and fully develop during stage 7a.
Forbidden lines: On July 20 [O III] 5007 suddenly begins to increase.
[O III] 4363 is first indicated on July 20 and definitely present after July 25,
when [O III] 4959 is also seen.
On July 28 the nebular spectrum has emerged including strong lines of
[Ne III].
7b. July 28 and later
The nova shows a fully developed nebular spectrum.
CONCLUSIONS
From the above description it seems that Nova Delphini has some
unusual features. For two reasons, however, I would refrain from calling it
abnormal, as has been done by some authors.
1. Nova Delphini is a very slow nova and with less than ten adequately
observed objects we have rather incomplete statistics concerning the spectral
development of this class.
2. Among the very slow novae are objects such as eta Carinae and FU
Orionis which apparently adhere even less to the established rules of nova
behaviour.
In spite of these limitations, however, it seems possible to extract from
the meager data available some general pattern of slow nova development:
A comparison of the light curves of eight slow novae shows that their
common characteristics is a flat topped maximum which is of longer duration
the slower the nova.
For some of the novae secondary maxima are well established: eta Car,
RR Pic, V 849 Oph and N Del (Payne-Gaposchkin, 1957). (see Table 3).
Fig. 2 shows the first section of a generalized slow nova light curve.
Some of the novae have shown only or predominantly absorption spectra
during the protracted maximum: FU Ori, DO Aql and N Del (Payne- Gaposchkin 1957).
Because of this evidence and because the spectral development of Nova Delphini
indicates the presence of the principal spectrum and the sequence of other
typical postmaximum spectra only after the secondary outburst, the following
hypothesis is adopted:
In slow novae the pre-maximum halt which is normally of short duration
or absent (McLaughlin, 1960) appears to be protracted as a direct function of
the slowness of the nova.
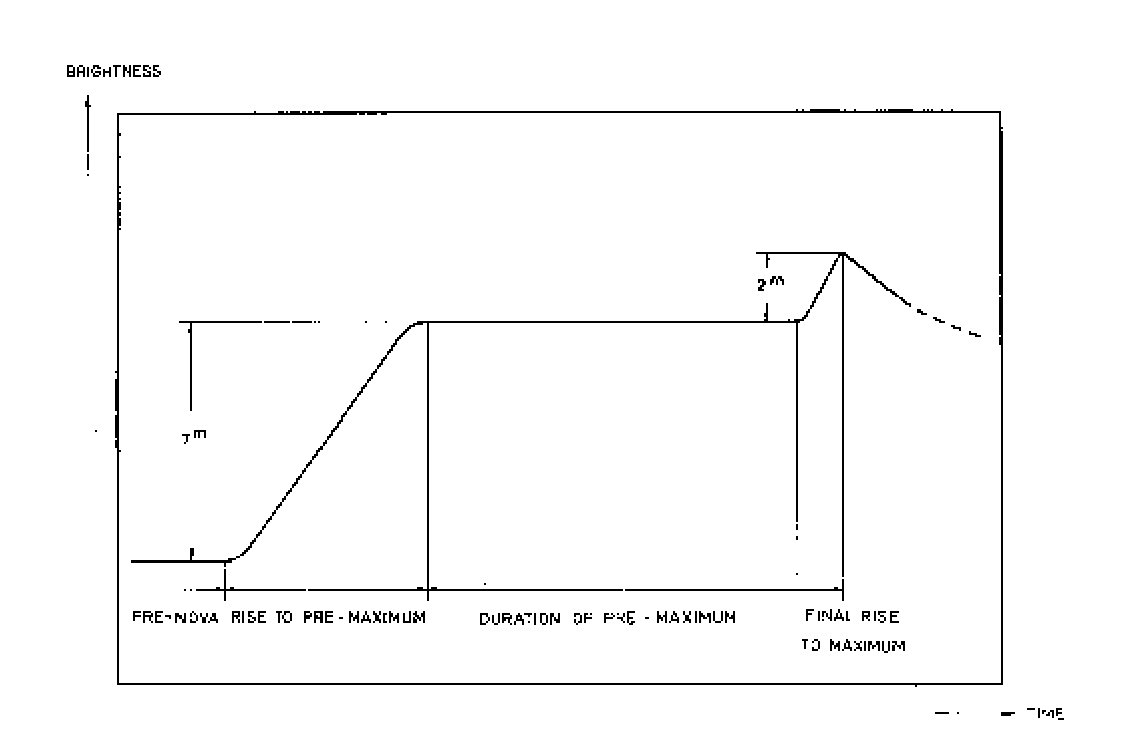 Fig. 2
Table 3
Pre-maximum Maximum
Star time of rising amplitude duration time of rising amplitude
eta Car 1848 > 8 a 8m 150 a 10 a 3m
FU Ori (1937) 120 d 6.5m >30 a - -
RT Ser (1909) - >6m 14.5 a - O.5m
RR Tel (1945)x 150 d 7m 4.1 a (< 260 d) (1m)
DO Aql (1925)xx >30 d >3.5m 200 d 40 d 0.4m
Nova Del 1967 25 d 7m 150 d 12 d 2m
RR Pic (1925) <45 d 4m 50 d 5 d 2m
V 849 Oph (1919) - - >4 d 4 d 1.2m
x More likely explanation through superposition of periodic light change
xx Vorontsov-Veljaminov suggests earlier and brighter maximum from comparison
with RR Pic
REFERENCES
IAU Circulars 1967-68, Sky and Telescope Vol. 34,300 (1967), Review of Popular
Astronomy Vol. 62, 23 (1968).
I. S. Bowen, 1947, "Excitation by line coincidence", Publ. astr. Soc. Pacific 59, 196.
McLaughlin, D., 1960, "The Spectra of Novae", Stars and Stellar Systems Vol. VI, 585.
Payne-Gaposchkin, C., 1957, "The Galactic Novae" Amsterdam 1957.
DISCUSSION
Hutchings: An interpretation of the spectrum based on line profiles from a
series of plates at 15 A/ mm at Victoria indicates that the line
spectrum during 1967 is formed in an extended envelope expanding
together with the underlying photosphere. After the December
outburst and until May the profiles correspond to shells ejected
from a large and fairly stationary photosphere.
Mammano: 1) Recognition of the conventional absorption systems is rather
difficult even at 40 A/mm, because many strong or faint systems
appeared in Nova Delphini 1967 sometimes simultaneously.
2) [1] 6300 A was present, although faint, before the maximum
in December.
3) The apparent broadening of emission lines, during the transition
at your dispersion, is actually caused by the emergence
of two more emission bands due to some condensations in
the atmosphere of the nova. Each forbidden line has central
band stronger than the two apart, while the contrary is true
for the permitted lines. Details will be communicated at the
IAU Colloquium in Triest.
Seitter: As I said at the beginning, an objective prism is not suitable for
detecting details in the spectrum. Yet, it may be useful for
recognition of major trends.
Fig. 2
Table 3
Pre-maximum Maximum
Star time of rising amplitude duration time of rising amplitude
eta Car 1848 > 8 a 8m 150 a 10 a 3m
FU Ori (1937) 120 d 6.5m >30 a - -
RT Ser (1909) - >6m 14.5 a - O.5m
RR Tel (1945)x 150 d 7m 4.1 a (< 260 d) (1m)
DO Aql (1925)xx >30 d >3.5m 200 d 40 d 0.4m
Nova Del 1967 25 d 7m 150 d 12 d 2m
RR Pic (1925) <45 d 4m 50 d 5 d 2m
V 849 Oph (1919) - - >4 d 4 d 1.2m
x More likely explanation through superposition of periodic light change
xx Vorontsov-Veljaminov suggests earlier and brighter maximum from comparison
with RR Pic
REFERENCES
IAU Circulars 1967-68, Sky and Telescope Vol. 34,300 (1967), Review of Popular
Astronomy Vol. 62, 23 (1968).
I. S. Bowen, 1947, "Excitation by line coincidence", Publ. astr. Soc. Pacific 59, 196.
McLaughlin, D., 1960, "The Spectra of Novae", Stars and Stellar Systems Vol. VI, 585.
Payne-Gaposchkin, C., 1957, "The Galactic Novae" Amsterdam 1957.
DISCUSSION
Hutchings: An interpretation of the spectrum based on line profiles from a
series of plates at 15 A/ mm at Victoria indicates that the line
spectrum during 1967 is formed in an extended envelope expanding
together with the underlying photosphere. After the December
outburst and until May the profiles correspond to shells ejected
from a large and fairly stationary photosphere.
Mammano: 1) Recognition of the conventional absorption systems is rather
difficult even at 40 A/mm, because many strong or faint systems
appeared in Nova Delphini 1967 sometimes simultaneously.
2) [1] 6300 A was present, although faint, before the maximum
in December.
3) The apparent broadening of emission lines, during the transition
at your dispersion, is actually caused by the emergence
of two more emission bands due to some condensations in
the atmosphere of the nova. Each forbidden line has central
band stronger than the two apart, while the contrary is true
for the permitted lines. Details will be communicated at the
IAU Colloquium in Triest.
Seitter: As I said at the beginning, an objective prism is not suitable for
detecting details in the spectrum. Yet, it may be useful for
recognition of major trends.