Non-Periodic Phenomena in Variable Stars
IAU Colloquium, Budapest, 1968
ON THE NATURE OF SOME OF THE O-C DIAGRAMS OF THE
RR LYRAE VARIABLES IN M5
C. COUTTS
Dunlap Observatory, Toronto, Canada
INTRODUCTION
The O-C diagrams determined from light curves of RR Lyrae stars in
globular clusters have many different forms. Some are extremely irregular, some
appear to be periodic in form, while others seem less complicated. The purpose
of this investigation is to consider those diagrams which are reasonably
regular (i.e. those to which it is reasonable to fit some simple curve).
When a star has a constant period, its O-C diagram (phase-shift plotted
against time) is a straight line. If the period is not constant, the form of the
diagram is different. If the period changes at a constant rate, the O-C diagram
is a parabola. However, if the change of period is more complicated, then
the diagram is more complicated. If we wish to learn something of the evolution
of a star from the behaviour of its period, then it is convenient to assume
as simple a form as possible for the diagram. The two simplest forms which
come to mind are:
1. a parabola, implying that the period changes at a constant rate, or
2. two intersecting straight lines, implying that the period changes
abruptly.
To learn about the evolution of the star, the former assumption seems the
more advantageous because the rate of period change, beta, can be deduced
from the shape of the parabola. The determination of beta has been discussed
in more detail by Sawyer-Hogg and Coutts (1969). If we assume the latter
(intersecting straight lines), we can deduce the net change of period, but not
the rate. Thus it seems that the assumption of the parabola is the better
one.
However, some recent investigations in M5 (Sawyer-Hogg and Coutts
1969) show that, of 66 RR Lyrae stars studied, 18 have had constant periods
during a 70-year interval. If the usual period changes are abrupt, then it is
possible that the stars that have had constant periods for 70 years would also
exhibit changes if the range of observations were extended to 100 years, for
example. Furthermore, if for all the stars which have exhibited period increases
or decreases during the 70-year interval of observations, the observed period
change represents the net period change for 100 years, then it is possible to
calculate an average rate of period change from these abrupt period changes.
Such calculations have been made for M5 (Sawyer-Hogg and Coutts 1969) and
Figure 1 is a graph showing the relation between Delta P, the period change
in days per million years, calculated in this manner and beta, the rate of period
change in days per million years calculated from the parabolas. A straight
line of slope 1.1 has been drawn through the points. It seems that the rates of
period change calculated from the two different assumptions are approximately
equivalent, and so the assumption of a parabola is not necessarily more
convenient than that of intersecting straight lines.
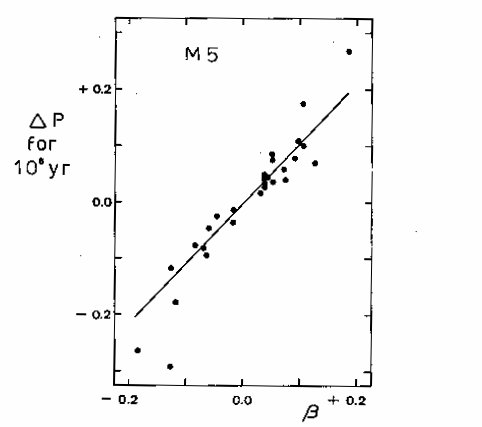 Figure 1. Delta P, period change in days per million years calculated assuming abrupt period
changes, plotted against beta, in days per million years, calculated assuming gradual
period changes.
To understand the significance of the constancy of period of so many of
the stars, it is useful to know whether the changes occur in a uniform manner
or abruptly. If the changes usually occur in a uniform manner, then the stars
which have had constant periods over the 70-year interval might have, either
periods which are truly constant, or, periods which are changing, but at a rate
too slow to be detected with the present observations. On the other hand,
if the changes are usually abrupt, this could imply that the stars with constant
periods would exhibit changes as large as those observed in the other stars
if the interval of observations were extended for a few years.
Clearly, if we are interested in understanding the changes of period,
to learn of any possible evolutionary interpretation, we need to know which
of these interpretations is the more probable. It must, however, be mentioned,
that at present, it does not appear that observed period changes of RR Lyrae
stars in globular clusters are caused by the evolution of the stars. Time scales
for stars on the horizontal branch calculated by Faulkner and Iben (1966)
do not agree with the observed period changes. This has been discussed for
the variables of M5 by Sawyer-Hogg and Coutts (1969).
INVESTIGATION
The present investigation is only preliminary, based on 6 RR Lyrae
variables in M5. The purpose is to determine whether the O-C diagrams of
those stars which show increasing or decreasing periods, are best represented
by parabolas or intersecting straight lines.
When we construct O-C diagrams, we must assume a certain period of
light variation. However, if this period is varying, it is difficult to know what
is the best period to assume. If the change of period occurs in a uniform manner,
the O-C diagram is a parabola and the vertex of the parabola occurs
at the time when the assumed period is actually the real period. Thus, as
different periods are assumed for a particular star, the O-C diagram is a
parabola, always with the same shape, but with the vertex shifted along the
time-axis. On the other hand, if the period change is sudden, the O-C diagram
is two straight lines which intersect at the time when the period change occurs.
If the diagram is constructed assuming a range of periods, the time of intersection
of the two lines is always the same. The slopes of the two lines vary
according to the period assumed, but the difference of the two slopes always
remains constant and corresponds to the magnitude of the period change.
It would therefore seem that one could see, from a series of O-C diagrams
for one star, constructed using a range of different periods, which interpretation
is better. Figures 2 show the O-C diagrams for six RR Lyrae variables in M5.
For each star, O-C diagrams are shown for three different periods.
In the upper three diagrams, for each star, parabolas have been fitted to the
points. In the lower three, intersecting straight lines have been fitted. It is
not readily observable from the diagrams which interpretation is better, except
for the case of variable 19 for which two straight lines obviously fit the points
better than the parabolas.
For each star studied here, O-C diagrams have been constructed for
10 different periods. In each case, parabolas corresponding to a certain value
of beta, and intersecting straight lines have been fitted to the points.
The deviation of each point from the curve has been measured and the mean sum of
these residuals has been calculated, first for the intersecting straight lines and
then for the parabolas. These values are listed in Table 1, which contains in
Table I
Sum of Residuals
Var. Period beta N Error 2 lines parabolas
7 0.49 0.07 15 0.00140 0.0393 0.0413
12 0.47 -0.06 17 0.00078 0.0233 0.0148
15 0.34 0.03 16 0.00136 0.0243 0.0451
19 0.47 0.16 16 0.00183 0.0298 0.1756
29 0.45 -0.12 16 0.00067 0.1232 0.1595
41 0.49 -0.04 16 0.00074 0.0162 0.0273
Figure 1. Delta P, period change in days per million years calculated assuming abrupt period
changes, plotted against beta, in days per million years, calculated assuming gradual
period changes.
To understand the significance of the constancy of period of so many of
the stars, it is useful to know whether the changes occur in a uniform manner
or abruptly. If the changes usually occur in a uniform manner, then the stars
which have had constant periods over the 70-year interval might have, either
periods which are truly constant, or, periods which are changing, but at a rate
too slow to be detected with the present observations. On the other hand,
if the changes are usually abrupt, this could imply that the stars with constant
periods would exhibit changes as large as those observed in the other stars
if the interval of observations were extended for a few years.
Clearly, if we are interested in understanding the changes of period,
to learn of any possible evolutionary interpretation, we need to know which
of these interpretations is the more probable. It must, however, be mentioned,
that at present, it does not appear that observed period changes of RR Lyrae
stars in globular clusters are caused by the evolution of the stars. Time scales
for stars on the horizontal branch calculated by Faulkner and Iben (1966)
do not agree with the observed period changes. This has been discussed for
the variables of M5 by Sawyer-Hogg and Coutts (1969).
INVESTIGATION
The present investigation is only preliminary, based on 6 RR Lyrae
variables in M5. The purpose is to determine whether the O-C diagrams of
those stars which show increasing or decreasing periods, are best represented
by parabolas or intersecting straight lines.
When we construct O-C diagrams, we must assume a certain period of
light variation. However, if this period is varying, it is difficult to know what
is the best period to assume. If the change of period occurs in a uniform manner,
the O-C diagram is a parabola and the vertex of the parabola occurs
at the time when the assumed period is actually the real period. Thus, as
different periods are assumed for a particular star, the O-C diagram is a
parabola, always with the same shape, but with the vertex shifted along the
time-axis. On the other hand, if the period change is sudden, the O-C diagram
is two straight lines which intersect at the time when the period change occurs.
If the diagram is constructed assuming a range of periods, the time of intersection
of the two lines is always the same. The slopes of the two lines vary
according to the period assumed, but the difference of the two slopes always
remains constant and corresponds to the magnitude of the period change.
It would therefore seem that one could see, from a series of O-C diagrams
for one star, constructed using a range of different periods, which interpretation
is better. Figures 2 show the O-C diagrams for six RR Lyrae variables in M5.
For each star, O-C diagrams are shown for three different periods.
In the upper three diagrams, for each star, parabolas have been fitted to the
points. In the lower three, intersecting straight lines have been fitted. It is
not readily observable from the diagrams which interpretation is better, except
for the case of variable 19 for which two straight lines obviously fit the points
better than the parabolas.
For each star studied here, O-C diagrams have been constructed for
10 different periods. In each case, parabolas corresponding to a certain value
of beta, and intersecting straight lines have been fitted to the points.
The deviation of each point from the curve has been measured and the mean sum of
these residuals has been calculated, first for the intersecting straight lines and
then for the parabolas. These values are listed in Table 1, which contains in
Table I
Sum of Residuals
Var. Period beta N Error 2 lines parabolas
7 0.49 0.07 15 0.00140 0.0393 0.0413
12 0.47 -0.06 17 0.00078 0.0233 0.0148
15 0.34 0.03 16 0.00136 0.0243 0.0451
19 0.47 0.16 16 0.00183 0.0298 0.1756
29 0.45 -0.12 16 0.00067 0.1232 0.1595
41 0.49 -0.04 16 0.00074 0.0162 0.0273
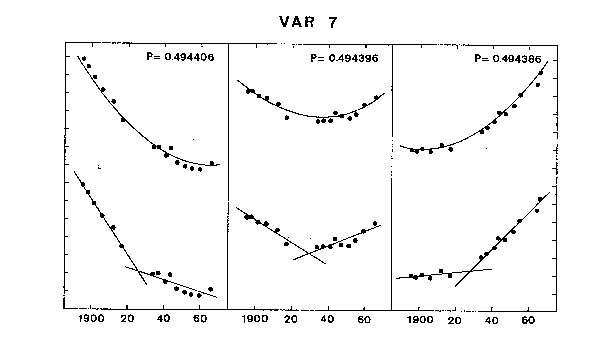 Figure 2a. O-C diagram for Var 7 in M5. The marks on the vertical axes are
two-tenths of a cycle apart; those on the horizontal axes are twenty years apart.
Figure 2a. O-C diagram for Var 7 in M5. The marks on the vertical axes are
two-tenths of a cycle apart; those on the horizontal axes are twenty years apart.
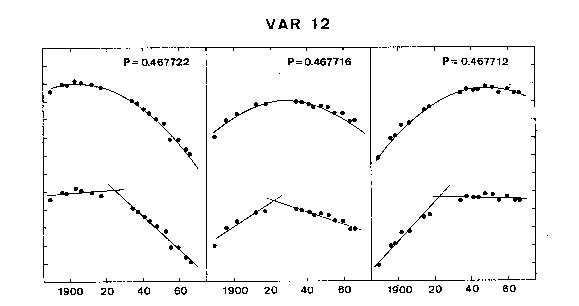 Figure 2b. O-C diagram for Var 12 in M5. The marks on the the vertical axes are
two-tenths of a cycle apart; those on the horizontal axes are twenty years apart.
Figure 2b. O-C diagram for Var 12 in M5. The marks on the the vertical axes are
two-tenths of a cycle apart; those on the horizontal axes are twenty years apart.
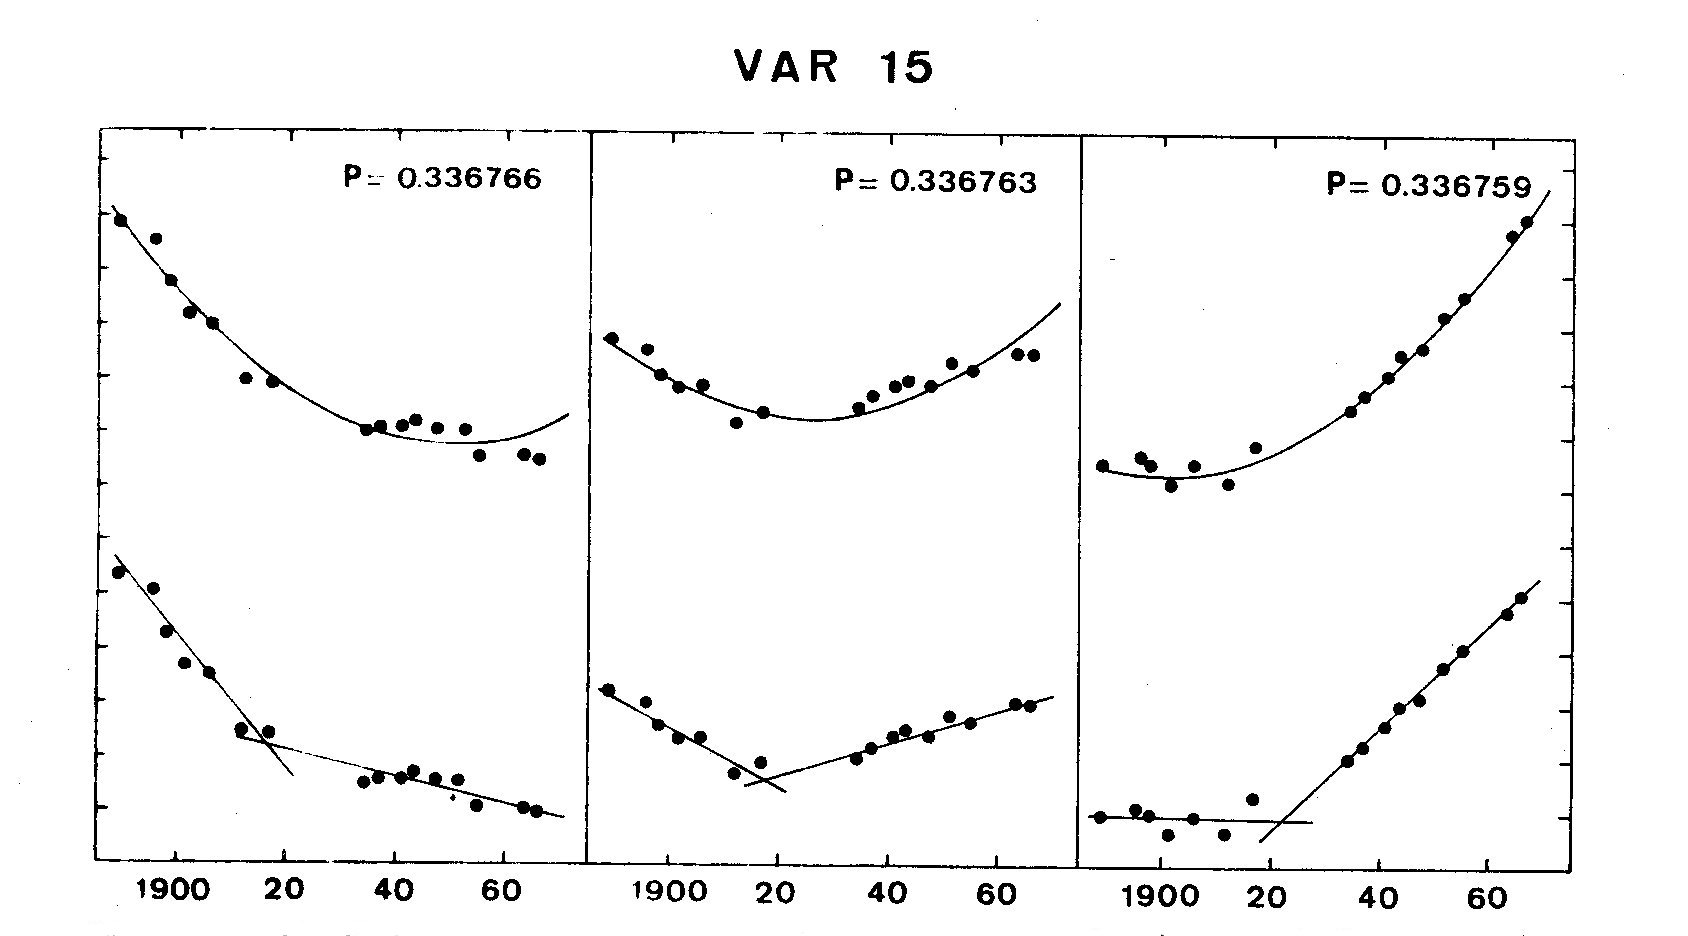 Figure 2c. O-C diagram for Var 15 in M5. The marks on the the vertical axes are
two-tenths of a cycle apart; those on the horizontal axes are twenty years apart.
Figure 2c. O-C diagram for Var 15 in M5. The marks on the the vertical axes are
two-tenths of a cycle apart; those on the horizontal axes are twenty years apart.
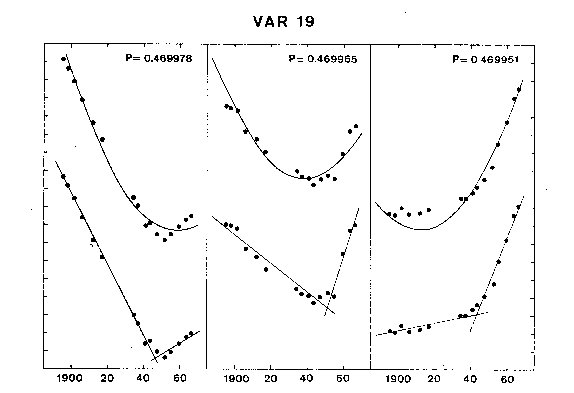 Figure 2d. O-C diagram for Var 19 in M5. The marks on the the vertical axes are
two-tenths of a cycle apart; those on the horizontal axes are twenty years apart.
Figure 2d. O-C diagram for Var 19 in M5. The marks on the the vertical axes are
two-tenths of a cycle apart; those on the horizontal axes are twenty years apart.
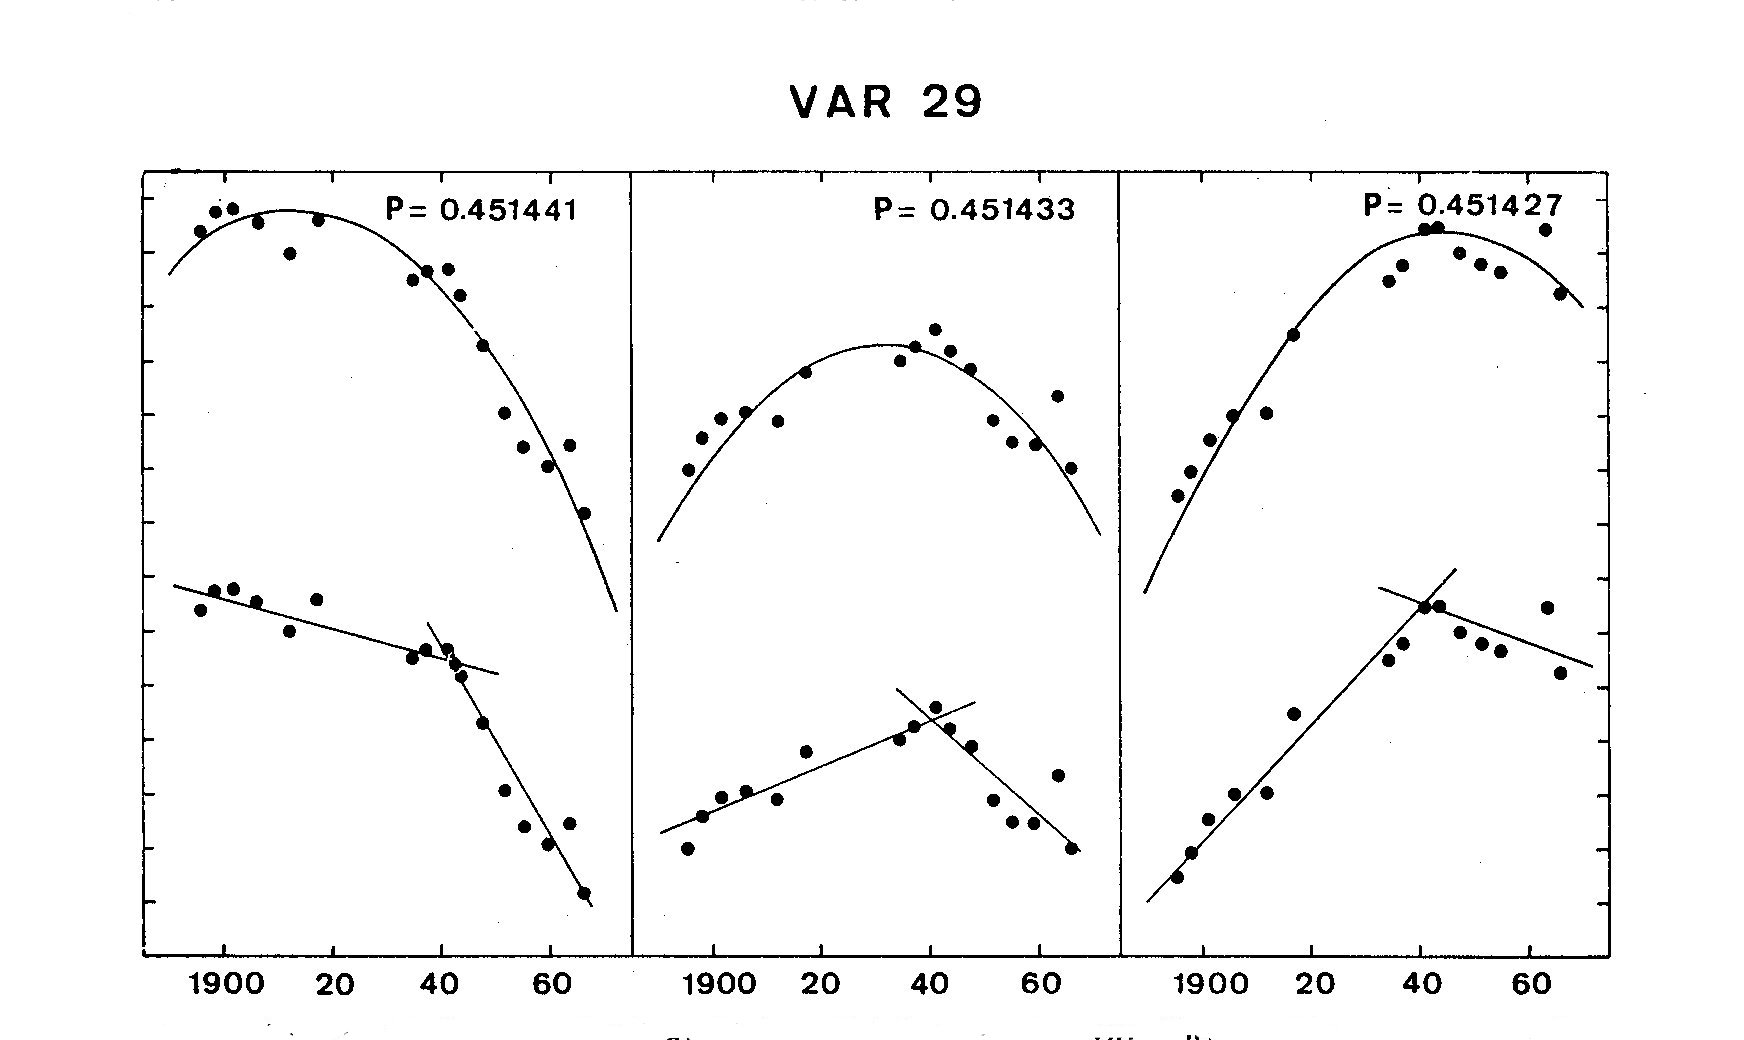 Figure 2e. O-C diagram for Var 29 in M5. The marks on the vertical axes are
two-tenths of a cycle apart; those on the horizontal axes are twenty years apart.
Figure 2e. O-C diagram for Var 29 in M5. The marks on the vertical axes are
two-tenths of a cycle apart; those on the horizontal axes are twenty years apart.
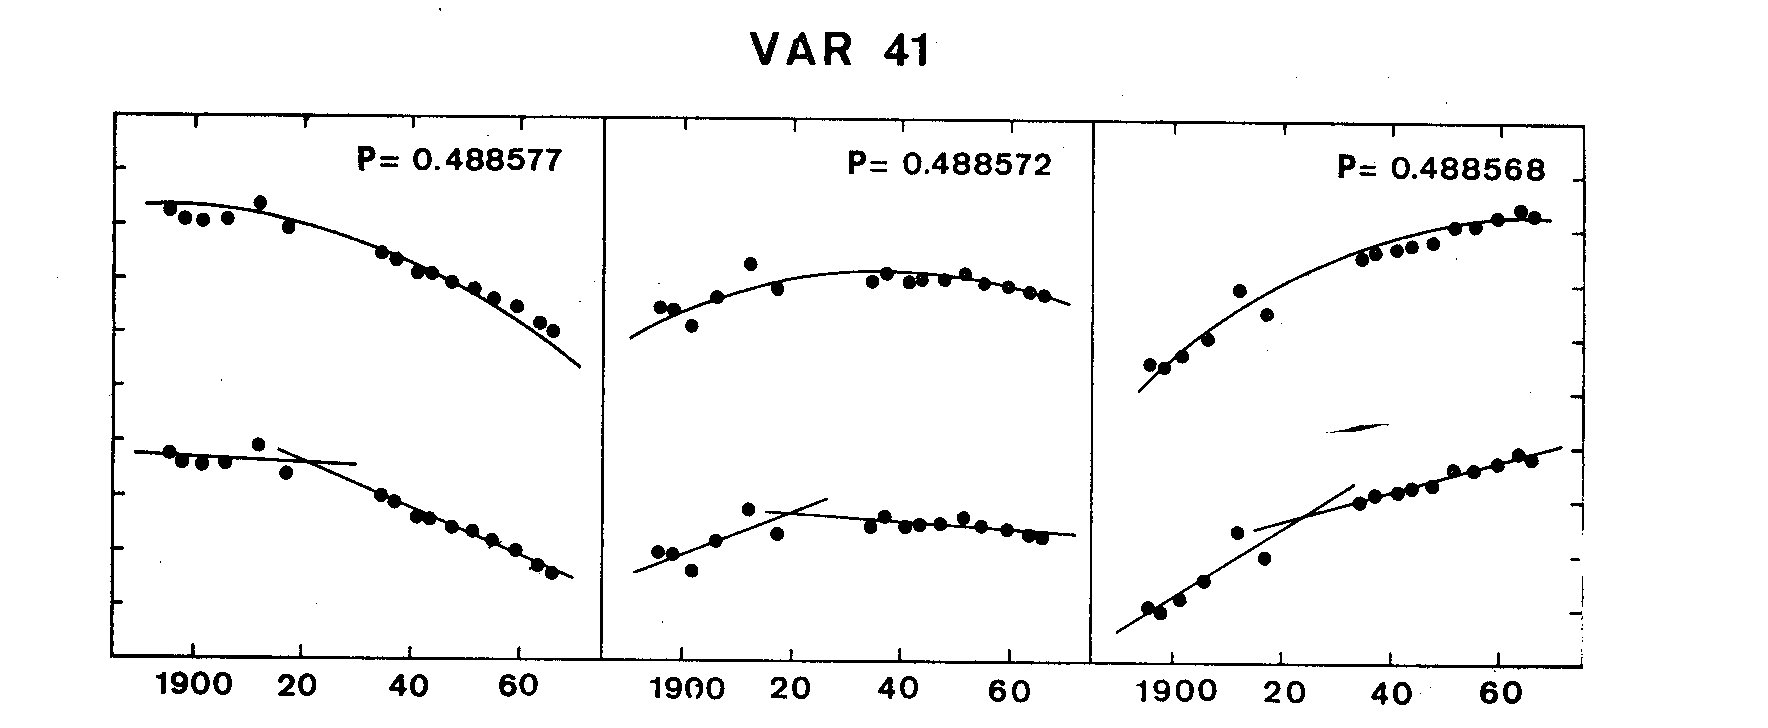 Figure 2f. O-C diagram for Var 41 in M5. The marks on the vertical axes are
two-tenths of a cycle apart; those on the horizontal axes are twenty years apart.
column 1, the number of the variable star; in 2, the period; in 3, beta, the rate of
period change in days per million years represented by the parabolas; in 4,
N, the number of points in the O-C diagram; in 5, the estimated variance of
errors in determination of the points; and in 6 and 7, the mean sums of the
residuals for the intersecting straight lines and the parabolas, respectively.
In this investigation, the curves have been fitted to the points by eye,
and so the results can only be considered tentative. However, for 5 of the 6
stars, the mean sum of the residuals is less when we consider the hypothesis
of the intersecting straight lines than when we consider parabolas. (In the
case of variable 29, the residuals are large in both cases and so we are probably
not justified to assume that either hypothesis is reasonable.)
This investigation is presently being extended to all the stars for which
O-C diagrams have been constructed in M5. The curves will be fitted to the
points by the method of least squares and the results will thus be more certain.
However, it is interesting to note that these preliminary results appear to
indicate that most period changes probably occur in an abrupt rather than
gradual manner. The final result will be important for our understanding of
period changes in RR Lyrae stars and their connection with the evolution
of the stars along the horizontal branch.
I am grateful to Professor Mannino of Bologna for arranging for me to
use the IBM1620 computer at the Faculty of Engineering, University of
Bologna to make this investigation. Dr. Emma Nasi kindly discussed the
computer programs with me.
REFERENCES
Faulkner, J, and Iben, I., 1966, Astrophys. J., 144, 995.
Sawyer-Hogg, H. and Coutts, C. 1969, Publ. David Dunlap Obs. (in press).
DISCUSSION
Plagemann: Is there any significance to the fact that the break in your 2
straight lines seem to occur between 1917 and 1935 when there were
no observations?
Coutts: No, I don't think so.
Geyer: What type of RR Lyrae-stars are covered by your investigation?
Are there differences of the O-C diagrams of RRc and RRab-stars?
Coutts: Of the 6 stars I have presented here, only one, variable 15 is an RRc
type. In general, in M5, the O-C diagrams of the RRc types stars do
not seem to differ from those of the RRab types.
Detre: 1) From which years have you observations? Lovas has taken about
500 plates of M5 in the years 1952-1966 at the Konkoly Observatory
2) Photoelectric observations (e.g. RR Leo) reveal even in the case
of parabolic O-C diagrams some irregularities superposed on the
parabolas.
3) Can you separate the two branches of RRab variables in the P-A
relation first shown by Belserene in M3 and omega Cen? In M3 the
stars located on the brighter branch have all positive parabolas in
the O-C diagrams.
Coutts:1) The David Dunlap Collection for M5 includes plates between the
years 1936 and 1966. However, the material is somewhat weak
between 1959 and 1964. Lovas' material will therefore be very
important.
2) This is also true for most of the variables in M5. The deviation of
the points from the curves often exceeds their errors in determination.
However, chi^2 tests indicate that it is reasonable to accept the
parabola or straight line hypothesis for all the stars discussed,
except variable 29. The chi^2 test also rejects the parabola
hypothesis for variable 19.
3) The periods of variables in M5 with longer periods which show
period changes are increasing. However, many are constant and
this may be due to the fact that period changes are harder to detect
for longer period stars. The shape of the parabola is related to beta/2P^2.
Thus the lower limit for detectable period changes is higher for
stars with longer periods.
Figure 2f. O-C diagram for Var 41 in M5. The marks on the vertical axes are
two-tenths of a cycle apart; those on the horizontal axes are twenty years apart.
column 1, the number of the variable star; in 2, the period; in 3, beta, the rate of
period change in days per million years represented by the parabolas; in 4,
N, the number of points in the O-C diagram; in 5, the estimated variance of
errors in determination of the points; and in 6 and 7, the mean sums of the
residuals for the intersecting straight lines and the parabolas, respectively.
In this investigation, the curves have been fitted to the points by eye,
and so the results can only be considered tentative. However, for 5 of the 6
stars, the mean sum of the residuals is less when we consider the hypothesis
of the intersecting straight lines than when we consider parabolas. (In the
case of variable 29, the residuals are large in both cases and so we are probably
not justified to assume that either hypothesis is reasonable.)
This investigation is presently being extended to all the stars for which
O-C diagrams have been constructed in M5. The curves will be fitted to the
points by the method of least squares and the results will thus be more certain.
However, it is interesting to note that these preliminary results appear to
indicate that most period changes probably occur in an abrupt rather than
gradual manner. The final result will be important for our understanding of
period changes in RR Lyrae stars and their connection with the evolution
of the stars along the horizontal branch.
I am grateful to Professor Mannino of Bologna for arranging for me to
use the IBM1620 computer at the Faculty of Engineering, University of
Bologna to make this investigation. Dr. Emma Nasi kindly discussed the
computer programs with me.
REFERENCES
Faulkner, J, and Iben, I., 1966, Astrophys. J., 144, 995.
Sawyer-Hogg, H. and Coutts, C. 1969, Publ. David Dunlap Obs. (in press).
DISCUSSION
Plagemann: Is there any significance to the fact that the break in your 2
straight lines seem to occur between 1917 and 1935 when there were
no observations?
Coutts: No, I don't think so.
Geyer: What type of RR Lyrae-stars are covered by your investigation?
Are there differences of the O-C diagrams of RRc and RRab-stars?
Coutts: Of the 6 stars I have presented here, only one, variable 15 is an RRc
type. In general, in M5, the O-C diagrams of the RRc types stars do
not seem to differ from those of the RRab types.
Detre: 1) From which years have you observations? Lovas has taken about
500 plates of M5 in the years 1952-1966 at the Konkoly Observatory
2) Photoelectric observations (e.g. RR Leo) reveal even in the case
of parabolic O-C diagrams some irregularities superposed on the
parabolas.
3) Can you separate the two branches of RRab variables in the P-A
relation first shown by Belserene in M3 and omega Cen? In M3 the
stars located on the brighter branch have all positive parabolas in
the O-C diagrams.
Coutts:1) The David Dunlap Collection for M5 includes plates between the
years 1936 and 1966. However, the material is somewhat weak
between 1959 and 1964. Lovas' material will therefore be very
important.
2) This is also true for most of the variables in M5. The deviation of
the points from the curves often exceeds their errors in determination.
However, chi^2 tests indicate that it is reasonable to accept the
parabola or straight line hypothesis for all the stars discussed,
except variable 29. The chi^2 test also rejects the parabola
hypothesis for variable 19.
3) The periods of variables in M5 with longer periods which show
period changes are increasing. However, many are constant and
this may be due to the fact that period changes are harder to detect
for longer period stars. The shape of the parabola is related to beta/2P^2.
Thus the lower limit for detectable period changes is higher for
stars with longer periods.