Non-Periodic Phenomena in Variable Stars
IAU Colloquium, Budapest, 1968
THE IRREGULARITIES IN THE LIGHT-CHANGES OF MIRA CETI
P. L. FISCHER
Wien, Freyung 6, Austria
The author has collected the whole material he was able to obtain about
the visual light-changes of Mira Ceti and about 500 individual light curves
of maxima and minima as well. A Monograph will be published next year in
the Annals of the University Observatory in Vienna.
Although Mira was discovered in 1596 by Fabricius and since Hevelius it was
systematically observed, the observations for serious researches - especially
for the study of the period-length - are not useful before 1839 (ep. 268
according to Prager. Gesch. u. Lit. 1934).
The statement by Eddington and Plakidis (M.N. 90, 65, 1929) "The light
fluctuations of long-period variables have a well-marked periodicity
complicated by superposed irregularities" is particularly confirmed by
Mira Ceti: not only the dates and magnitudes of the maxima and minima
show irregularities, but also the shape of the light curve is different
from cycle to cycle. In order to measure these changes, numerical quantities
have been introduced, which together with other essential notions, can be seen
in Fig. 1. In addition to the minimum and the subsequent maximum - a natural
unit of one cycle - there is another point of special astrophysical interest,
the eruption-point: this is the beginning of the nearly linear, very steep
slope ES of the ascending branch; in plotting the observations, the magnitudes
begin to vary strongly at this point, until a clear ascent is to be seen. The
steepness of the eruption ES is eta (in days pro 1m). Between the points
A and B the star is 0.4m brighter than in the minimum and between C and
D 0.4m fainter than in the maximum; thus t can be considered as the duration
of the minimum-light, and h as that of the maximum-light. The steepness of
B_1C_1 and D_1A_2 defines sigma and tau (in days pro 1m), the mean slope of
the ascending and descending branch, respectively.
Which are the irregularities in the light-changes of Mira Ceti? The most
important phenomena are as follow:
1. The individual period-lengths, defined as time differences between two
subsequent observed maxima (P) or minima (Q) or eruption-points (R; see Fig. 1),
have a wide range; Table 1 shows the frequency distribution and the mean values.
The good agreement of the P-, Q- and R-values proves that the eruption-point
is a reliable feature, to which the spectroscopists should pay more attention.
Figure 2 shows an everlasting fluctuation of the individual period-lengths up
to 30d and more, which is interrupted only occasionally, and fully irregularly,
by quiet times. If a power spectrum analysis is made as Blackman and Tukey
(Dover Publ. 190, 1958) have done for climatological time-series, significant
waves are to be seen (Fig. 2, below): a wave of 2 cycles length in the P's;
a less clear wave in the Q's; surprisingly a 10 cycles-wave in the R's;
a Markov-persistence has not been observed.
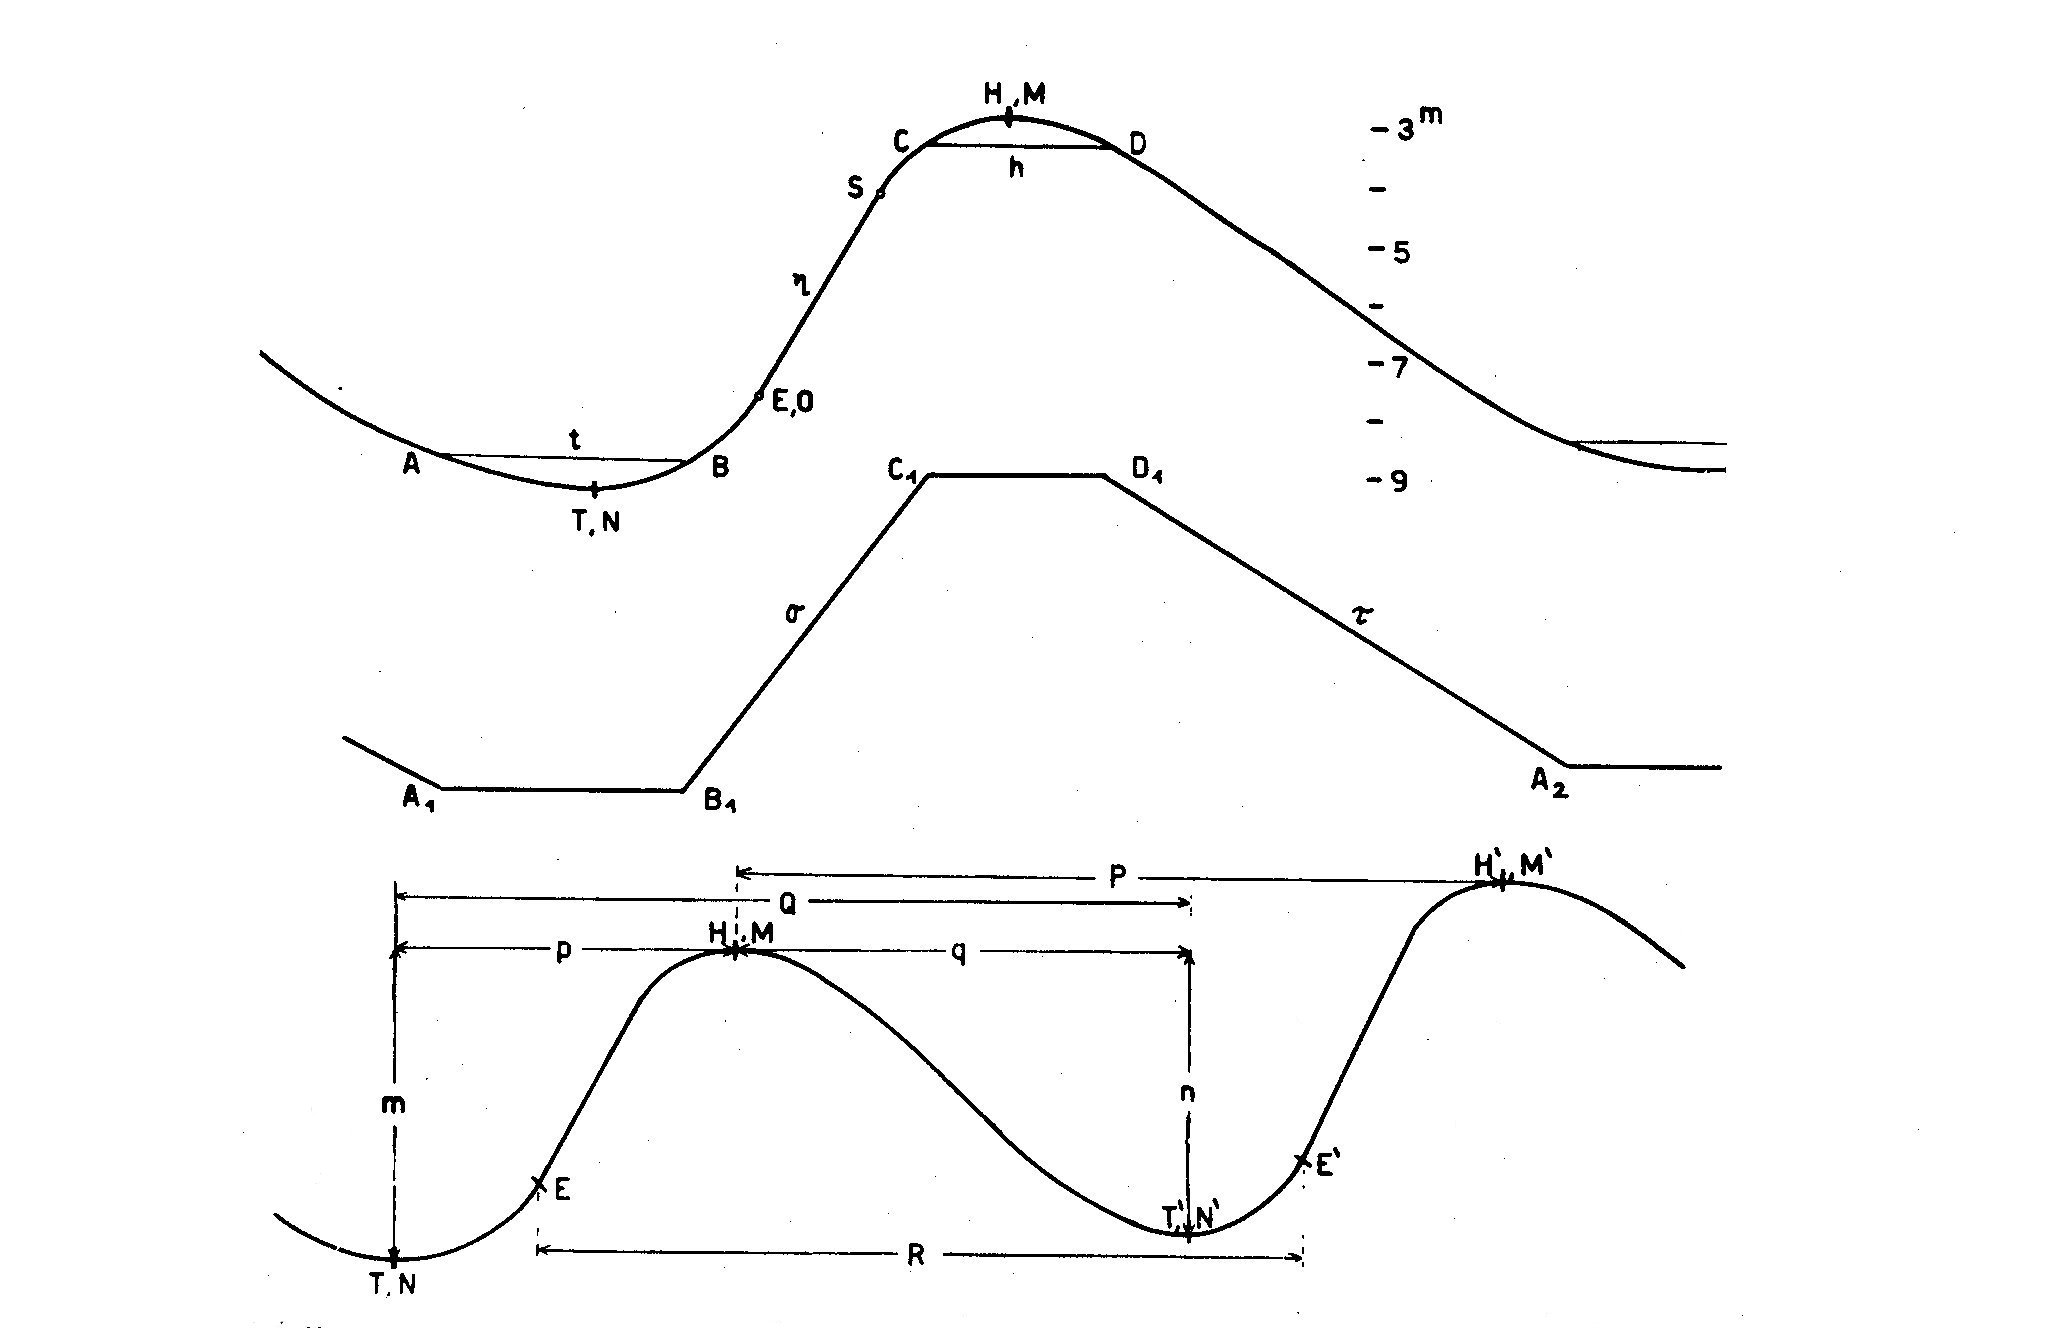 Figure 1. The numerical quantities of the light curve and other essential notions:
T, N minimum (date, magnitude)
t duration of the minimum light (A beginning, B end)
E, O eruption-point (date, magnitude)
S the end of the eruption (saturation point)
eta steepness (slope) of the eruption
H, M maximum (date, magnitude)
h duration of the maximum light (C beginning, D end)
sigma mean slope of the ascending branch
tau mean slope of the descending branch
P, Q, R individual period length, found out of 2 subsequent observed maxima,
or minima or eruptions respectively
p, q partial period length of the ascending or descending branch
m, n partial amplitude of the ascending or descending branch
II) Punctualities of the events (maxima, minima, eruptions): It is
usual to use a formula of the form C = T + n * X for a certain observational
series and compare the C's with the observed dates O; the (O-C)-values can be
taken for "punctualities" and are denoted in the maxima with U, in the minima
with V and in the eruption-points with W; Z is the average of them. The method
of least squares furnishes the following formulas for the time after 1938
(ep. 268-408):
from 123 observed maxima:
C_max = 239 3019.5 (+-4.2d) + n * 331.5545 (+-0.045d);
from 91 observed minima:
C_min = 240 1500.8 (+-6.1d) + n * 331.7762 (+-0.075d);
from observed eruption-points:
C_eru = 240 1916.8 (+-6.3d) + n * 331.4809 (+-0.088d).
Figure 1. The numerical quantities of the light curve and other essential notions:
T, N minimum (date, magnitude)
t duration of the minimum light (A beginning, B end)
E, O eruption-point (date, magnitude)
S the end of the eruption (saturation point)
eta steepness (slope) of the eruption
H, M maximum (date, magnitude)
h duration of the maximum light (C beginning, D end)
sigma mean slope of the ascending branch
tau mean slope of the descending branch
P, Q, R individual period length, found out of 2 subsequent observed maxima,
or minima or eruptions respectively
p, q partial period length of the ascending or descending branch
m, n partial amplitude of the ascending or descending branch
II) Punctualities of the events (maxima, minima, eruptions): It is
usual to use a formula of the form C = T + n * X for a certain observational
series and compare the C's with the observed dates O; the (O-C)-values can be
taken for "punctualities" and are denoted in the maxima with U, in the minima
with V and in the eruption-points with W; Z is the average of them. The method
of least squares furnishes the following formulas for the time after 1938
(ep. 268-408):
from 123 observed maxima:
C_max = 239 3019.5 (+-4.2d) + n * 331.5545 (+-0.045d);
from 91 observed minima:
C_min = 240 1500.8 (+-6.1d) + n * 331.7762 (+-0.075d);
from observed eruption-points:
C_eru = 240 1916.8 (+-6.3d) + n * 331.4809 (+-0.088d).
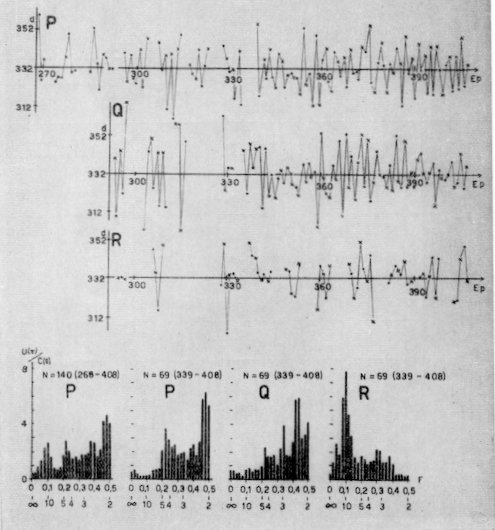 Figure 2. The individual period lengths P, Q, R and their power spectra:
the numbers below are the frequencies and the wavelengths (in cycles)
Table 1
Mira Ceti. The individual period-lengths P, Q, and R: frequency distribution,
mean value, +- standard deviation, time and number of events
From all the material
From the better material
frequency distribution
. . . . . . . . . . . . X+-s X+-s
332.15+-12.7 332.0389+-10.4
P 2 2 8 20 47 55 42 24 10 2 1
ep 38-407 213 ep 71-407 131
332.92+-13.0 332.6256+-11.8
Q 0 2 3 8 22 23 17 12 5 2 0
ep 293-407 94 ep 293-407 86
333.28+-9.8 333.0357+-10.0
R 0 1 1 3 8 25 15 7 0 0 0 ep 295-407 60 ep 295-407 56
Summa 2 5 12 31 77 103 74 43 15 4 1 367 273
Table 2
Mira Ceti, prognosis of the maxima, minima and eruptions
Events Ep. Method of Sterne (H. C. 386) Method of Fischer T_S - T_F
T_S T_F
408 243 9459 = 1966 Nov. 29 9453 = 1966 Nov. 23 6d
409 9791 1967 Oct. 27 9783 1967 Oct. 19 8
410 244 0122 1968 Spt. 22 0113 1968 Spt. 13 9
411 0454 1969 Aug. 20 0443 1969 Aug. 9 11
maxima 412 0785 1970 July 17 0772 1970 July 4 13
413 1117 1971 Jun. 14 1102 1971 May 30 15
414 1449 1972 May 11 1431 1972 Apr. 23 18
415 1780 1973 Apr. 7 1760 1973 Mar. 18 20
416 2112 1974 Mar. 5 2090 1974 Feb. 11 22
408 243 9340 = 1966 Aug. 2 9339 = 1966 Aug. 1 1d
409 9672 1967 Jun. 30 9670 1967 Jun. 28 2
410 244 0004 1968 May 27 9999 1968 May 22 5
411 0336 1969 Apr. 24 0329 1969 Apr. 17 7
minima 412 0668 1970 Mar. 22 0659 1970 Mar. 13 9
413 1000 1971 Feb. 17 0989 1971 Feb. 6 11
414 1331 1972 Jan. 14 1318 1972 Jan. 1 13
415 1663 1972 Dec. 11 1648 1972 Nov. 26 15
416 1995 1973 Nov. 8 1978 1973 Oct. 22 17
408 243 9402 = 1966 Oct. 3 9390 = 1966 Spt. 21 12d
409 9734 1967 Aug. 31 9720 1967 Aug. 17 14
410 244 0066 1968 Jul. 28 0050 1968 Jul. 12 16
411 0398 1969 Jun. 25 0379 1969 Jun. 6 19
eruptions 412 0731 1970 May 24 0709 1970 May 2 22
413 1063 1971 Apr. 21 1038 1971 Mar. 27 25
414 1395 1972 Mar. 18 1367 1972 Feb. 19 28
415 1727 1973 Feb. 13 1697 1973 Jan. 14 30
416 2059 1974 Jan. 11 2026 1973 Dec. 9 33
Figure 2. The individual period lengths P, Q, R and their power spectra:
the numbers below are the frequencies and the wavelengths (in cycles)
Table 1
Mira Ceti. The individual period-lengths P, Q, and R: frequency distribution,
mean value, +- standard deviation, time and number of events
From all the material
From the better material
frequency distribution
. . . . . . . . . . . . X+-s X+-s
332.15+-12.7 332.0389+-10.4
P 2 2 8 20 47 55 42 24 10 2 1
ep 38-407 213 ep 71-407 131
332.92+-13.0 332.6256+-11.8
Q 0 2 3 8 22 23 17 12 5 2 0
ep 293-407 94 ep 293-407 86
333.28+-9.8 333.0357+-10.0
R 0 1 1 3 8 25 15 7 0 0 0 ep 295-407 60 ep 295-407 56
Summa 2 5 12 31 77 103 74 43 15 4 1 367 273
Table 2
Mira Ceti, prognosis of the maxima, minima and eruptions
Events Ep. Method of Sterne (H. C. 386) Method of Fischer T_S - T_F
T_S T_F
408 243 9459 = 1966 Nov. 29 9453 = 1966 Nov. 23 6d
409 9791 1967 Oct. 27 9783 1967 Oct. 19 8
410 244 0122 1968 Spt. 22 0113 1968 Spt. 13 9
411 0454 1969 Aug. 20 0443 1969 Aug. 9 11
maxima 412 0785 1970 July 17 0772 1970 July 4 13
413 1117 1971 Jun. 14 1102 1971 May 30 15
414 1449 1972 May 11 1431 1972 Apr. 23 18
415 1780 1973 Apr. 7 1760 1973 Mar. 18 20
416 2112 1974 Mar. 5 2090 1974 Feb. 11 22
408 243 9340 = 1966 Aug. 2 9339 = 1966 Aug. 1 1d
409 9672 1967 Jun. 30 9670 1967 Jun. 28 2
410 244 0004 1968 May 27 9999 1968 May 22 5
411 0336 1969 Apr. 24 0329 1969 Apr. 17 7
minima 412 0668 1970 Mar. 22 0659 1970 Mar. 13 9
413 1000 1971 Feb. 17 0989 1971 Feb. 6 11
414 1331 1972 Jan. 14 1318 1972 Jan. 1 13
415 1663 1972 Dec. 11 1648 1972 Nov. 26 15
416 1995 1973 Nov. 8 1978 1973 Oct. 22 17
408 243 9402 = 1966 Oct. 3 9390 = 1966 Spt. 21 12d
409 9734 1967 Aug. 31 9720 1967 Aug. 17 14
410 244 0066 1968 Jul. 28 0050 1968 Jul. 12 16
411 0398 1969 Jun. 25 0379 1969 Jun. 6 19
eruptions 412 0731 1970 May 24 0709 1970 May 2 22
413 1063 1971 Apr. 21 1038 1971 Mar. 27 25
414 1395 1972 Mar. 18 1367 1972 Feb. 19 28
415 1727 1973 Feb. 13 1697 1973 Jan. 14 30
416 2059 1974 Jan. 11 2026 1973 Dec. 9 33
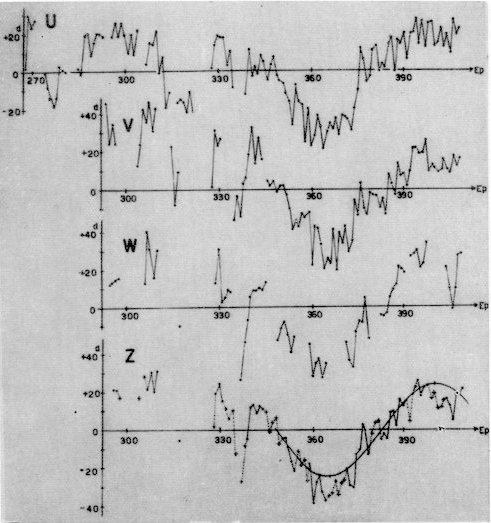 Figure 3. The punctualities (O-C) of the events: U maxima, V minima,
W eruptions; Z average
Figure 3 shows the punctualities U, V, W and the average Z as a function of
time: their similar appearance is conspicuous; the sine curve of the last
Z-values (from ep. 348) makes a prognosis possible up to the epoch 416,
regardless of the way of its coming into being: see Table 2.
Two publications have furnished an essential contribution to the correct
understanding of the O-C diagrams:
1. A. S. Eddington and S. Plakidis, "Irregularities of Period of Longperiod
Variable Stars" (M. N. 90, 65, 1929): They distinguish the following 3 kinds
of irregularities: a) permanent i.: if the individual periods differ from the
mean period by a purely accidental fluctuation; b) temporary i.: if the primary
cause of the light-changes works regularly, but its visible effect is
delayed or accelerated by casual circumstances (so that the maximum-date
differs from the ephemeris-date by an accidental fluctuation); a side
remark: observational errors operate in the same manner; c) repeat i.:
if the phase differencies increase with time - in this case the
period-length changes. In the first case there is no tendency to return
to the original ephemeris-dates: the delays and accelerations of
successive periods build up in the same way as accidental errors; if the
star is late, the time lost is written off as irretrievable.
2. T. E. Sterne, in "The Errors of Period of Variable Stars" (H. C. 386,
1934) has further developed these ideas as "cumulative" and "non-cumulative"
errors. About O-C diagrams he remarks: They indicate, particularly after the
lapse of many epochs, the accumulated errors of the star; and although changes
of true period will be reflected in such diagrams as curvatures, curvatures
will also be caused, in the absence of such changes, by the accumulation of
errors" (p. 14). Further in his work Sterne demonstrates a way for the
calculation of the standard deviations s and e of the cumulative and
non-cumulative errors respectively, and the "best approximation" X' to the
true period over a certain series of observations, a so-called "run". The mean
error (m.e.) of the period determined in this way is greater than that obtained
by using the method of least squares. This m.e. is of great importance in
ascertaining whether the difference between the periods found from 2 subsequent
runs is significant or not; in this way it is possible to find a change of the
period-length. Table 3 shows the application of Sterne's method to the rich
material of Mira Ceti: The entire time of useful observations has been divided
in runs and then
Table 3
Proof of the constancy of the period-length in Mira Ceti after the method of T. E. Sterne
(HC. 386)
Differences
Run Number of epoch e s X' +- m. e.
r_i - r_14 r_i - r_34
r_1 268-303 4.5d 7.4d 331.7315 +- 1.26d +0.14d -
r_2 303-335 6.6 6.1 331.0984 +- 1.11 -0.49 -
r_3 339-373 6.8 2.7 330.7194 +- 0.51 -0.87 -1.19d
maxima r_4 373-408 7.5 2.0 332.4328 +- 0.39 +0.84 +0.52
r_34 339-408 6.8 4.1 331.9100 +- 0.50 <--------
r_14 268-408 6.5 5.0 331.5885 +- 0.42 <--------
r_3 338-373 7.5 4.1 330.7091 +- 0.73 - -1.21
r_4 373-408 5.9 2.8 332.5321 +- 0.51 - +0.61
r_34 338-408 6.3 4.8 331.9174 +- 0.58 <--------
r_3 338-373 2.2 7.4 331.1143 +- 1.25 - -1.04
r_4 373-408 6.5 2.9 332.4532 +- 0.53 - +0.30
r_34 338-408 4.1 6.7 332.1572 +- 0.81 <--------
Table 4
Mira Ceti. The numerical quantities
Frequency distribution
Quantity Mean +- st. dev.
(middle of the class, number)
/ maximum M 3.45 +- 0.64m 2.1 2.3 2.6 2.9 3.2 3.5 3.8 4.1 4.4 4.7 5.0m Sum
4 6 15 37 36 31 41 29 13 3 5 220
magnitude of - minimum N 9.07 +- 0.27m 8.5 8.8 9.1 9.4 9.7m
9 23 41 25 3 101
\ eruption O 7.7 +- 0.6m 6.6 6.8 7.1 7.4 7.7 8.0 8.3 8.6 8.8m
3 5 6 10 15 13 12 6 0 70
/ max. light h 50 +-12d 15 22 29 36 43 50 57 64 71 78 85d
duration of 0 2 6 11 26 30 25 14 4 1 1 120
\ min. light t 76 +-12d 41 48 55 62 69 76 83 90 97 104 111d
1 1 1 6 20 21 18 2 4 3 1 78
/ partial period p 121.16 +- 11.24 89 100 111 122 133 144 155d
ascending 1 8 16 44 21 4 1 95
- part. amplitude m 5.56 +- 0.51m 4.2 4.7 5.2 5.7 6.2 6.7 7.2m
branch 1 10 26 34 17 2 0 90
\ mean slope sigma 13.5 +- 2.3d/m 7.5 9.5 11.5 13.5 15.5 17.5 19.5d/m
1 4 17 26 14 3 3 68
Mean slope of eruption eta 9.1 +- 2.2d/m 6.5 10.5 14.5d/m
22 33 3 58
/ partial period q 210.62 +- 12.7d 178 189 200 211 222 233 244d
descending 2 7 21 36 17 9 1 93
- part. amplitude n 5.55 +- 0.64m 4.2 4.7 5.2 5.7 6.2 6.7 7.2m
branch 1 18 22 22 18 6 2 89
\ mean slope tau 29.7 +- 3.9d/m 21 24 27 30 33 36 39d/m
1 6 21 17 13 4 3 65
the "best approximations" X' together with their m.e. for each part and the
whole time has been calculated; as the differences are of the order of the
magnitude of the m.e. the main question is solved: the period of Mira Ceti is
constant, although the fluctuations of the individual lengths of the period
are very large.
III) The numerical quantities: their mean values and the frequency
distributions are shown in Table 4. Only the maximum magnitudes show a
tendency to alternate, not the magnitudes of the minima or eruptions.
Neither the sequence of the partial-periods (p. q, see Fig. 1), nor
the sequence of the partial-amplitudes (m, n) have any regularity; it is
interesting that the partial period p of the ascending branch is nearly
always 37% (+-3) of the time difference (Q) between the corresponding minima.
DISCUSSION
Fernie: I was not quite clear as to what you meant by "eruption". Is this
the moment at which the emission lines appear in the spectrum?
Fischer: No. The eruption-point is defined as the beginning of the nearly
linear, very steep slope of the ascending branch of the light curve.
Detre: It was a pleasure to hear about an application of power spectrum
analysis to a Mira variable. So far I know, this is the first study of
this kind.
Fischer: Yes.
Figure 3. The punctualities (O-C) of the events: U maxima, V minima,
W eruptions; Z average
Figure 3 shows the punctualities U, V, W and the average Z as a function of
time: their similar appearance is conspicuous; the sine curve of the last
Z-values (from ep. 348) makes a prognosis possible up to the epoch 416,
regardless of the way of its coming into being: see Table 2.
Two publications have furnished an essential contribution to the correct
understanding of the O-C diagrams:
1. A. S. Eddington and S. Plakidis, "Irregularities of Period of Longperiod
Variable Stars" (M. N. 90, 65, 1929): They distinguish the following 3 kinds
of irregularities: a) permanent i.: if the individual periods differ from the
mean period by a purely accidental fluctuation; b) temporary i.: if the primary
cause of the light-changes works regularly, but its visible effect is
delayed or accelerated by casual circumstances (so that the maximum-date
differs from the ephemeris-date by an accidental fluctuation); a side
remark: observational errors operate in the same manner; c) repeat i.:
if the phase differencies increase with time - in this case the
period-length changes. In the first case there is no tendency to return
to the original ephemeris-dates: the delays and accelerations of
successive periods build up in the same way as accidental errors; if the
star is late, the time lost is written off as irretrievable.
2. T. E. Sterne, in "The Errors of Period of Variable Stars" (H. C. 386,
1934) has further developed these ideas as "cumulative" and "non-cumulative"
errors. About O-C diagrams he remarks: They indicate, particularly after the
lapse of many epochs, the accumulated errors of the star; and although changes
of true period will be reflected in such diagrams as curvatures, curvatures
will also be caused, in the absence of such changes, by the accumulation of
errors" (p. 14). Further in his work Sterne demonstrates a way for the
calculation of the standard deviations s and e of the cumulative and
non-cumulative errors respectively, and the "best approximation" X' to the
true period over a certain series of observations, a so-called "run". The mean
error (m.e.) of the period determined in this way is greater than that obtained
by using the method of least squares. This m.e. is of great importance in
ascertaining whether the difference between the periods found from 2 subsequent
runs is significant or not; in this way it is possible to find a change of the
period-length. Table 3 shows the application of Sterne's method to the rich
material of Mira Ceti: The entire time of useful observations has been divided
in runs and then
Table 3
Proof of the constancy of the period-length in Mira Ceti after the method of T. E. Sterne
(HC. 386)
Differences
Run Number of epoch e s X' +- m. e.
r_i - r_14 r_i - r_34
r_1 268-303 4.5d 7.4d 331.7315 +- 1.26d +0.14d -
r_2 303-335 6.6 6.1 331.0984 +- 1.11 -0.49 -
r_3 339-373 6.8 2.7 330.7194 +- 0.51 -0.87 -1.19d
maxima r_4 373-408 7.5 2.0 332.4328 +- 0.39 +0.84 +0.52
r_34 339-408 6.8 4.1 331.9100 +- 0.50 <--------
r_14 268-408 6.5 5.0 331.5885 +- 0.42 <--------
r_3 338-373 7.5 4.1 330.7091 +- 0.73 - -1.21
r_4 373-408 5.9 2.8 332.5321 +- 0.51 - +0.61
r_34 338-408 6.3 4.8 331.9174 +- 0.58 <--------
r_3 338-373 2.2 7.4 331.1143 +- 1.25 - -1.04
r_4 373-408 6.5 2.9 332.4532 +- 0.53 - +0.30
r_34 338-408 4.1 6.7 332.1572 +- 0.81 <--------
Table 4
Mira Ceti. The numerical quantities
Frequency distribution
Quantity Mean +- st. dev.
(middle of the class, number)
/ maximum M 3.45 +- 0.64m 2.1 2.3 2.6 2.9 3.2 3.5 3.8 4.1 4.4 4.7 5.0m Sum
4 6 15 37 36 31 41 29 13 3 5 220
magnitude of - minimum N 9.07 +- 0.27m 8.5 8.8 9.1 9.4 9.7m
9 23 41 25 3 101
\ eruption O 7.7 +- 0.6m 6.6 6.8 7.1 7.4 7.7 8.0 8.3 8.6 8.8m
3 5 6 10 15 13 12 6 0 70
/ max. light h 50 +-12d 15 22 29 36 43 50 57 64 71 78 85d
duration of 0 2 6 11 26 30 25 14 4 1 1 120
\ min. light t 76 +-12d 41 48 55 62 69 76 83 90 97 104 111d
1 1 1 6 20 21 18 2 4 3 1 78
/ partial period p 121.16 +- 11.24 89 100 111 122 133 144 155d
ascending 1 8 16 44 21 4 1 95
- part. amplitude m 5.56 +- 0.51m 4.2 4.7 5.2 5.7 6.2 6.7 7.2m
branch 1 10 26 34 17 2 0 90
\ mean slope sigma 13.5 +- 2.3d/m 7.5 9.5 11.5 13.5 15.5 17.5 19.5d/m
1 4 17 26 14 3 3 68
Mean slope of eruption eta 9.1 +- 2.2d/m 6.5 10.5 14.5d/m
22 33 3 58
/ partial period q 210.62 +- 12.7d 178 189 200 211 222 233 244d
descending 2 7 21 36 17 9 1 93
- part. amplitude n 5.55 +- 0.64m 4.2 4.7 5.2 5.7 6.2 6.7 7.2m
branch 1 18 22 22 18 6 2 89
\ mean slope tau 29.7 +- 3.9d/m 21 24 27 30 33 36 39d/m
1 6 21 17 13 4 3 65
the "best approximations" X' together with their m.e. for each part and the
whole time has been calculated; as the differences are of the order of the
magnitude of the m.e. the main question is solved: the period of Mira Ceti is
constant, although the fluctuations of the individual lengths of the period
are very large.
III) The numerical quantities: their mean values and the frequency
distributions are shown in Table 4. Only the maximum magnitudes show a
tendency to alternate, not the magnitudes of the minima or eruptions.
Neither the sequence of the partial-periods (p. q, see Fig. 1), nor
the sequence of the partial-amplitudes (m, n) have any regularity; it is
interesting that the partial period p of the ascending branch is nearly
always 37% (+-3) of the time difference (Q) between the corresponding minima.
DISCUSSION
Fernie: I was not quite clear as to what you meant by "eruption". Is this
the moment at which the emission lines appear in the spectrum?
Fischer: No. The eruption-point is defined as the beginning of the nearly
linear, very steep slope of the ascending branch of the light curve.
Detre: It was a pleasure to hear about an application of power spectrum
analysis to a Mira variable. So far I know, this is the first study of
this kind.
Fischer: Yes.