Non-Periodic Phenomena in Variable Stars
IAU Colloquium, Budapest, 1968
THE O'CONNELL EFFECT IN SOME ECLIPSING VARIABLES
E. F. MILONE
Gettysburg College, Gettysburg, Pennsylvania
University of Maryland, Astronomy Program, College Park, Maryland
Kitt Peak National Observatory, Tucson, Arizona
INTRODUCTION
The O'Connell effect, a name Dr. Wesselink and I have given to the
phenomenon of unequal light maxima in certain eclipsing binary stars,
was formerly called the 'periastron effect'. Although there is no
definite known cause, in the majority of cases it cannot be due to any
periastron effect. This is clear from the negative correlation found by
Mergentaler (1950) between the magnitude of the effect and the orbital
eccentricity. A more likely origin lies in clouds or streams of matter
existing on or around the Lagrangian surfaces of close binaries with
nearly circular orbits. UBV observations of two stars in O'Connell's
(1951) list do not contradict the latter hypothesis.
PRESENT WORK
The systems RT Lacertae and CG Cygni were selected for observation on
these grounds: strong O'Connell effect, lack of previous photoelectric
photometry, and brightness.
The data were gathered with more than the usual care. Careful attention
was paid to changes in sky transparency in the following ways: 1) a double
pair of "U" observations were placed on the outside of the observing sequence,
2) observations of the comparison star inevitably flanked those of the
variable; and 3) three times a night high and low standard stars of matching
color were observed to provide accurate primary extinction coefficients.
Transformations to the standard UBV system were done in the usual way
(Hardie, 1962) using coefficients obtained from the low air-mass observations
of standards paired according to contrasting spectral types. The reduction
technique, described more fully elsewhere (Milone, 1967), produced both
differential magnitudes and colors (in the sense: variable-comparison
stars) and UBV values for the comparison. Comparison stars (BD + 34 4216
for CG Cygni and BD + 43 4108 for RT Lacertae) were selected because of
similarity in colors to the variables and because air mass differences between
the variable and comparison stars never exceeded 0.01 within a ten-hour range
in hour angle. These conditions minimized the effects of extinction and
transformation coefficient changes on the light curve. As a check on
the constancy of each comparison star, at least once per night a near-by check
star was observed. The magnitudes and colors of the comparison and check stars
are given in Table I.
Table I
Comparison and Check Stars
Star V B-V U-B
for RT Lac BD + 43 4108 7.410 +- 0.003 1.355 +- 0.003 1.527 +- 0.005
BD + 43 4109 8.562 0.336 0.112
epsilon_mse in mean difference: +- 0.002 +- 0.002 +- 0.004
for CG Cyg BD + 34 4216 8.969 +- 0.003 0.744 +- 0.002 0.231 +- 0.003
BD + 34 4213 6.636 1.484 1.811
epsilon_mse in mean difference: +- 0.002 +- 0.002 +- 0.003
RT LACERTAE
The differential light curve for the 5.07d-period binary RT Lacertae during
1965 is shown in Figure 1. Filled circles are normal points of Kitt Peak
observations obtained by the author in October-November, open circles are
normal points of Yale observations, x's represent individual Kitt Peak
observations contributed by Dr. Douglas Hall (1967b) over a somewhat wider
range in time. The light curve is clearly incomplete. Further photoelectric
observations are being obtained by Hall (1968), and the author plans
simultaneous spectrographic observations. The remarkable features of the
present light curve have been reported earlier (Milone, 1967, 1968a, 1968b)
and need only be summarized here as:
1) an anomalously blue primary minimum, independently discovered by
Hall (1967a) and
2) an apparent change in the magnitude and sign of the difference
between maxima from Wachmann's (1935) photographic light curve.
A previous radial velocity solution by Joy (1931) yielded masses of 1.90
and 1.00 for the "fainter" and "brighter" components respectively. Entering
with the mass ratio of .53 in Kratochvil's (1964) Table II, the limits of
the inner contact surface in the direction normal to the line of centers are
for the primary: .434 and for the secondary: .318. These exceed by 20% the
largest radius derived for either component in this direction by previous
workers, viz: Fowler (1920) using Luizet's (1910, 1915) data; Krat and
Nekrasova (1936) using Wachmann's light curve. Consequently we cannot assume
that the system is a contact binary.
Table II
Scatter in the light curve maxima of CG Cygni
Run Maximum sigma V* sigma B* sigma U*
1965 I 0.015m 0.015m 0.022m
II .014 .014 .025
I & II .015 .015 .025
1967 I .011 .010 .023
II .012 .010 .021
I & II .012 .010 .022
1965+1967 I .020 .020 .026
II .016 .019 .027
I & II .019 .020 .027
* sigma refers to the mean standard error of a single differential observation.
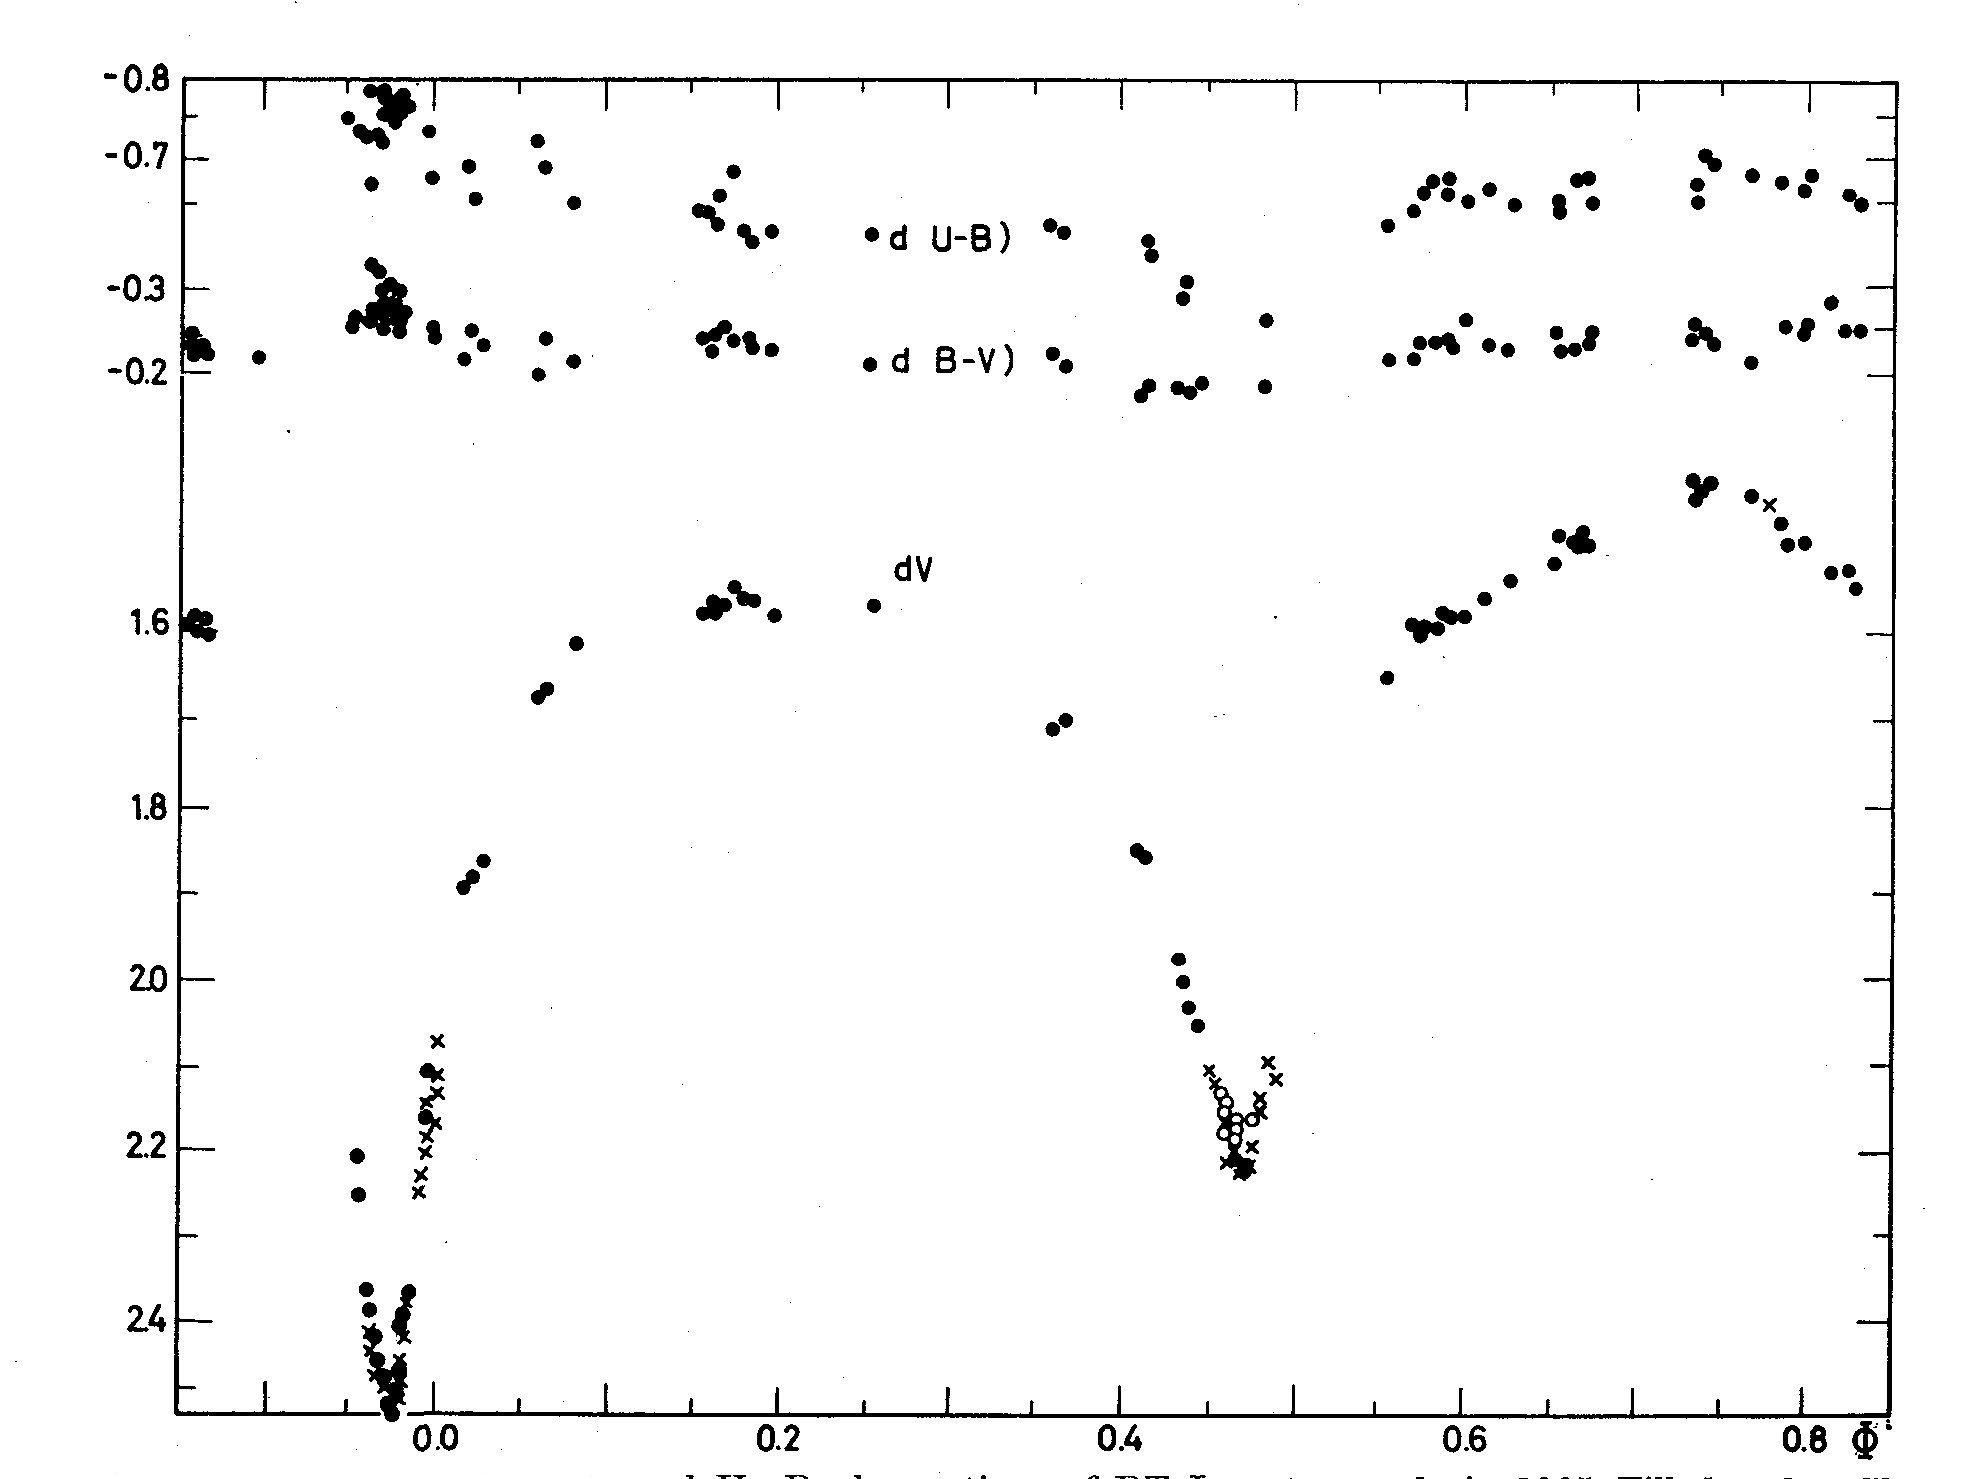 Fig. 1. Differential V, B-V, and U-R observations of RT Lacertae made in 1965.
Filled and unfilled circles are normal points of data obtained, respectively, at
KPNO in October-November and at Yale Observatory during September - November.
X's are the individual points of D. Hall obtained at KPNO.
The mechanism for causing the O'Connell effect in this star, as well as
light curve features 1) and 2) is still unknown. Joy's (1931) study precludes
the possibility that the hotter star is seen masked by an absorbing cloud at
primary minimum. The increase of the O'Connell effect with decreasing wavelength
means that clouds of the negative hydrogen ion are not responsible for that
effect if it is caused by absorption at maximum I. Further analysis must await
completion of the light curve and high-dispersion spectroscopic work.
CG CYGNI
The differential light curve for the 0.63d-period binary CG Cygni is
shown in Figure 2. Here unfilled circles are normals of observations
made at Yale in 1965, filled circles are individual October-November
1965 Kitt Peak observations, x's mark individual June 1967 Kitt Peak
observations, and +'s indicate individual observations made at the Dyer
Observatory of Vanderbilt University, Nashville, Tennessee in July,
1965. All data have been reduced to the UBV system.
It will be noticed that although the 1965 observations were made in
three different local systems, the data from this year forms a generally
more homogeneous set than the combined 1965-1967 Kitt Peak data obtained
with the same telescope and filter slide. In particular, over several
cycles, the 1967 primary minima are consistently more shallow and have
an earlier rise than the 1965 data. This is true for all colors. The
scatter in the maxima, computed by differencing phase-adjacent
observations, is given in Table II. In all bands the combined-run data
show more scatter than either run separately. The scatter in maximum II
is slightly less than in maximum I, a feature shared with Yu's (1922)
light curve.
There is also evidence of shorter term changes. Around phase 0.4P,
observations from October 29-30, 1965 are apparently fainter by 0.04m in
V, 0.06m in B, and 0.10m in U than corresponding-phase data of October 7-8,
1965. With E_0 = 2422967.4283 and p = O.6311437d (Kukarkin et al., 1958),
the dates correspond to cycles 25503 and 25468. Small differences between
the color transformation coefficients (cf Table III) calculated for those
nights and the mean run values adopted for the two sets of observations cannot
account for the magnitude and color differences.
The overall appearance of the light curve is also apparently changing
with time. Current extrema are listed along with earlier published
values in Table IV. The recent minima values have been read from the
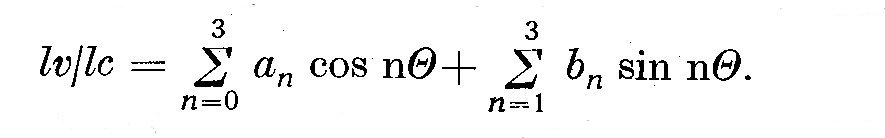
light curve but those for maxima have been obtained from the mid-maxima
values of truncated
Fourier series of the form
Fig. 1. Differential V, B-V, and U-R observations of RT Lacertae made in 1965.
Filled and unfilled circles are normal points of data obtained, respectively, at
KPNO in October-November and at Yale Observatory during September - November.
X's are the individual points of D. Hall obtained at KPNO.
The mechanism for causing the O'Connell effect in this star, as well as
light curve features 1) and 2) is still unknown. Joy's (1931) study precludes
the possibility that the hotter star is seen masked by an absorbing cloud at
primary minimum. The increase of the O'Connell effect with decreasing wavelength
means that clouds of the negative hydrogen ion are not responsible for that
effect if it is caused by absorption at maximum I. Further analysis must await
completion of the light curve and high-dispersion spectroscopic work.
CG CYGNI
The differential light curve for the 0.63d-period binary CG Cygni is
shown in Figure 2. Here unfilled circles are normals of observations
made at Yale in 1965, filled circles are individual October-November
1965 Kitt Peak observations, x's mark individual June 1967 Kitt Peak
observations, and +'s indicate individual observations made at the Dyer
Observatory of Vanderbilt University, Nashville, Tennessee in July,
1965. All data have been reduced to the UBV system.
It will be noticed that although the 1965 observations were made in
three different local systems, the data from this year forms a generally
more homogeneous set than the combined 1965-1967 Kitt Peak data obtained
with the same telescope and filter slide. In particular, over several
cycles, the 1967 primary minima are consistently more shallow and have
an earlier rise than the 1965 data. This is true for all colors. The
scatter in the maxima, computed by differencing phase-adjacent
observations, is given in Table II. In all bands the combined-run data
show more scatter than either run separately. The scatter in maximum II
is slightly less than in maximum I, a feature shared with Yu's (1922)
light curve.
There is also evidence of shorter term changes. Around phase 0.4P,
observations from October 29-30, 1965 are apparently fainter by 0.04m in
V, 0.06m in B, and 0.10m in U than corresponding-phase data of October 7-8,
1965. With E_0 = 2422967.4283 and p = O.6311437d (Kukarkin et al., 1958),
the dates correspond to cycles 25503 and 25468. Small differences between
the color transformation coefficients (cf Table III) calculated for those
nights and the mean run values adopted for the two sets of observations cannot
account for the magnitude and color differences.
The overall appearance of the light curve is also apparently changing
with time. Current extrema are listed along with earlier published
values in Table IV. The recent minima values have been read from the
light curve but those for maxima have been obtained from the mid-maxima
values of truncated
Fourier series of the form
 The purpose in obtaining the 1967 data was to fill in the light curve
- particularly on the branches of the minima - so that a preliminary solution
could be attempted. The apparent depression of maximum I between fall,
1965 and June, 1967 suggests that it is growing fainter with time and that
maximum II may be unchanging. Low dispersion spectra taken with a 36"
Kitt Peak telescope and Yale's 40" reflector fail to show evidence of
emission, although this work should be repeated with greater dispersion
on larger instruments.
The purpose in obtaining the 1967 data was to fill in the light curve
- particularly on the branches of the minima - so that a preliminary solution
could be attempted. The apparent depression of maximum I between fall,
1965 and June, 1967 suggests that it is growing fainter with time and that
maximum II may be unchanging. Low dispersion spectra taken with a 36"
Kitt Peak telescope and Yale's 40" reflector fail to show evidence of
emission, although this work should be repeated with greater dispersion
on larger instruments.
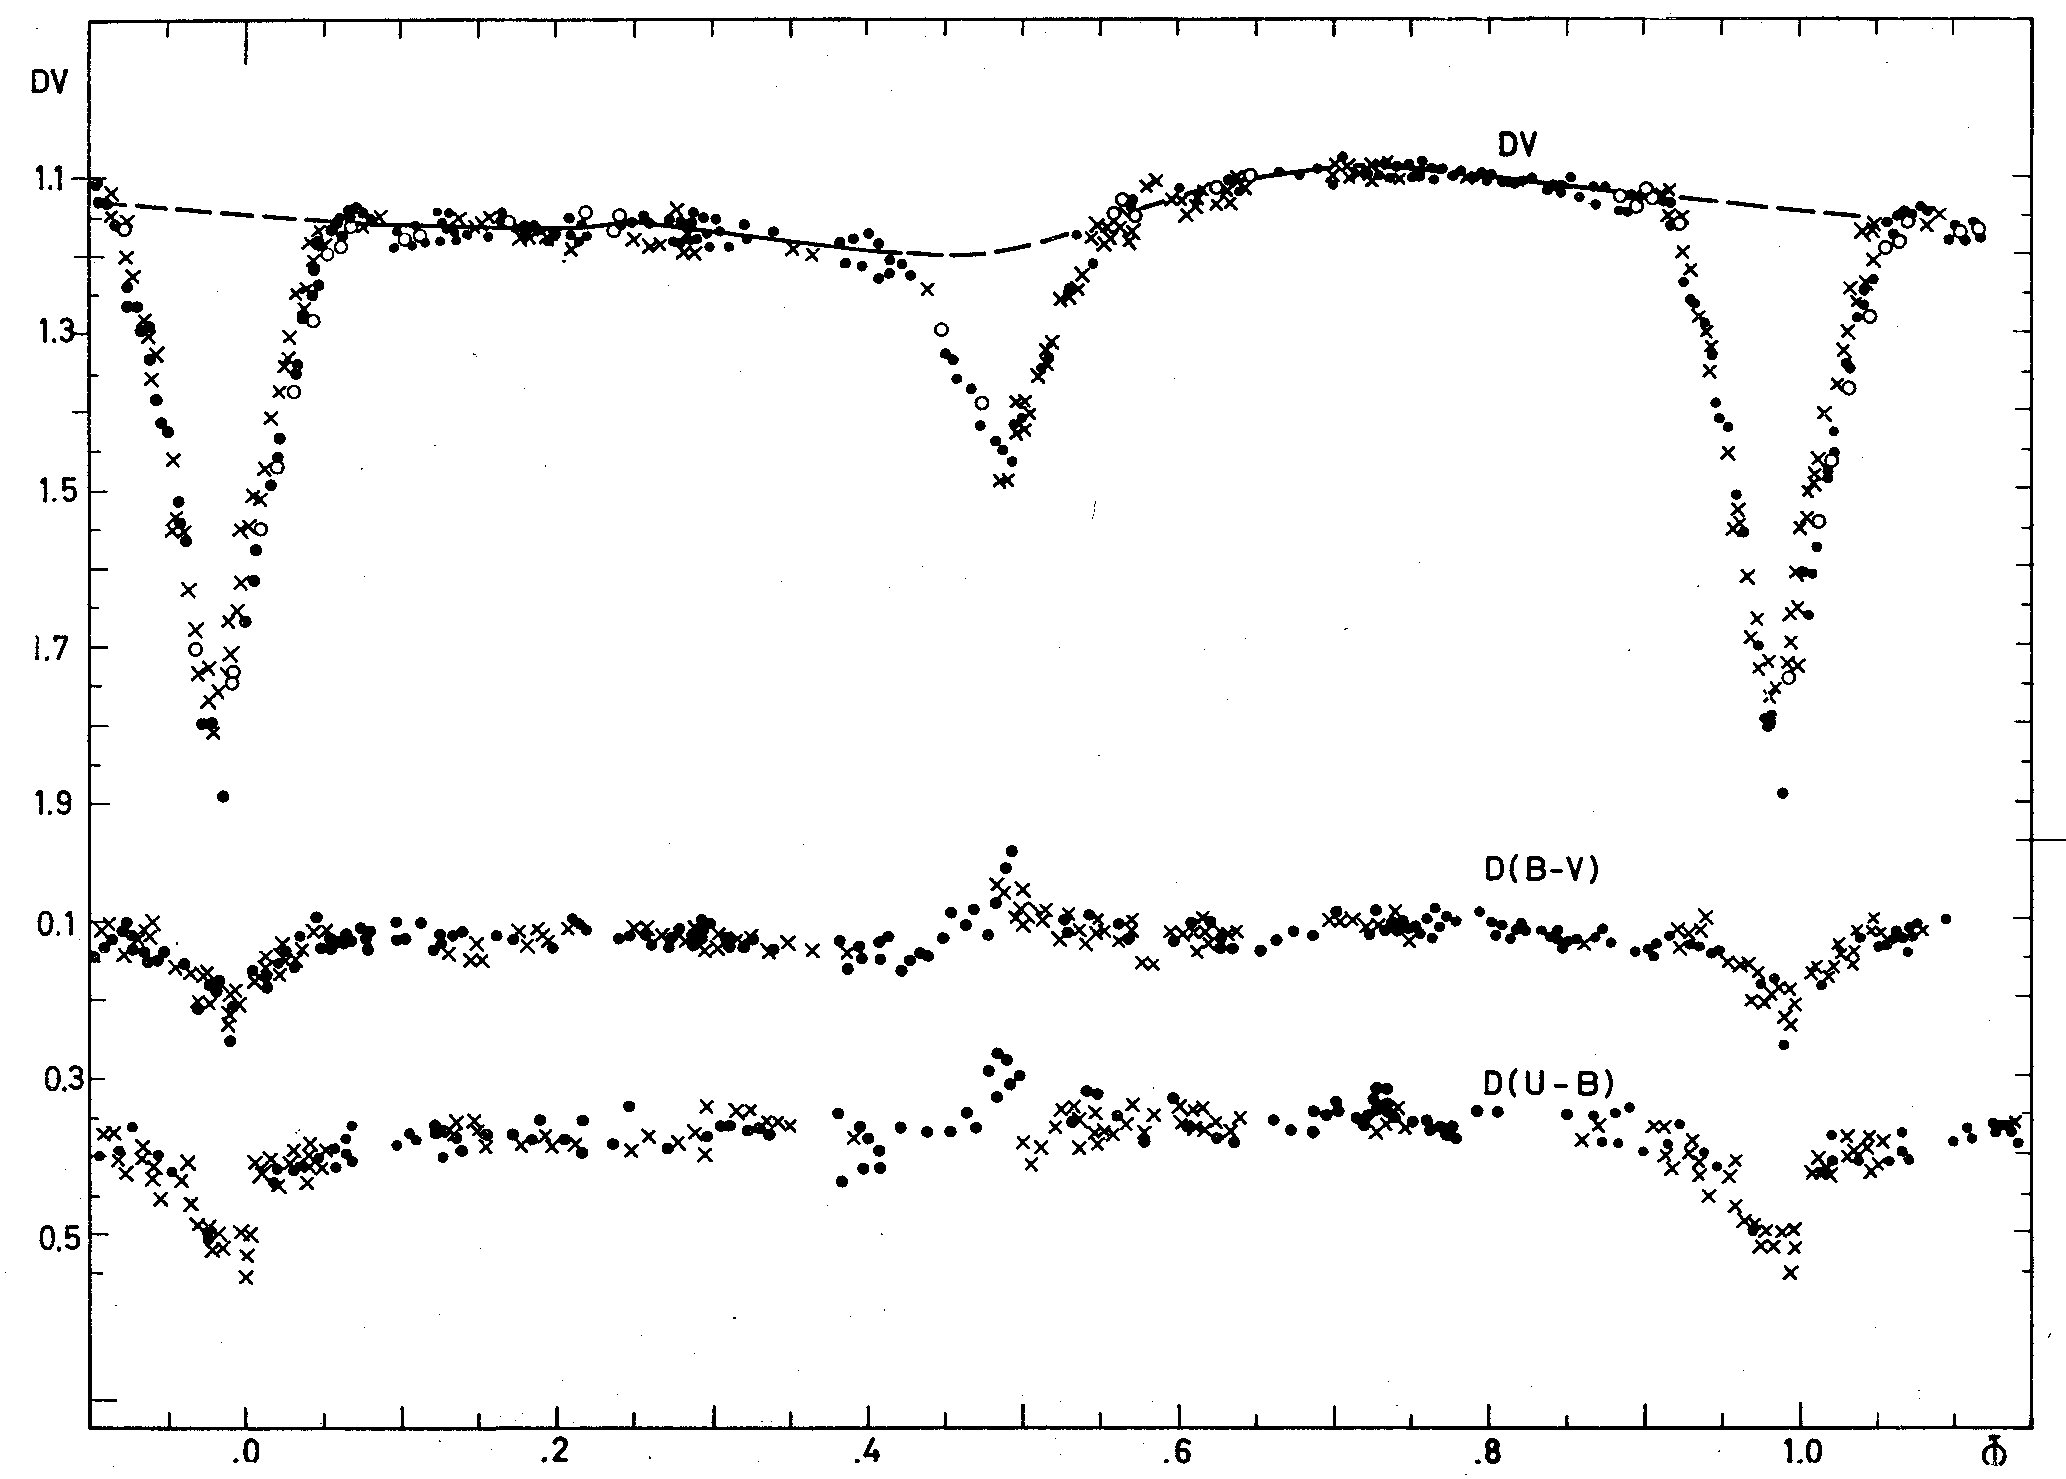 Fig. 2. Differential V, B-V, and U-B observations of CG Cygni made in
1965 and 1967. Filled and unfilled circles are, respectively, individual
observations made at Kitt Peak in October-November, 1965 and normal points
of observations made at Yale Observatory during 1965; X's mark individual June,
1967 Kitt Peak observations; and +'s are individual July, 1965 observations
made at the Dyer Observatory. The dark line through the DV observations is
the Fourier representation of the combined 1965-67 Kitt Peak observations
outside of eclipse.
Table III
Transformation coefficients and fitting errors for Kitt Peak Telescope
No. 3 photometric system during two nights in 1965
A = Date
B = epsilon
C = sigma epsilon
D = sigma V * Y_0
E = mu
F = sigma mu
G = sigma(B-V)*(b-y)_0
H = Psi
I = sigma Psi
J = sigma(U-B)*(u-b)_0
A B C D E F G H I J
10/7-8 +0.003 1.092 0.989
Mean for Run 1: -0.015 +-0.008 +-0.026 1.088 +-0.002 +-0.020 0.967 +-0.006 +-0.017
10/29-30 -0.040 1.118 0.989
Mean for Run 2: -0.026 +-0.006 +-0.029 1.103 +-0.004 +-0.019 0.977 +-0.001 +-0.019
The notation is that of Hardie (1962). sigma_epsilon is the m.s.e. of the run mean, sigma_V,Y_0 is the
mean square deviation between tabulated and calculated values of V for standard stars.
The other quantities are analogous.
At the present time no radial velocity curve exists, and the mass ratio
is not known. The orbit is sensibly circular with r = 1.44 X 10^-2 X ((m_1+m_2)/m_Sun)^1/3
a.u. The times of external contact are sharp enough to obtain the sum of the
radii: r_1 + r_2 = 0.48 X 10^-2 X ((m_1+m_2)/m_Sun)^1/3 a.u. = 1.2R_Sun for solar masses.
If the mass ratio is of the order unity, the stars do not fill their inner lobes.
From a spectrogram taken at Yale, it is quite clear that the stars cannot
be of early spectral type, but are closer to late G.
The origin of the O'Connell effect in this star is not known, but a slowly
changing absorption of maximum I, and occasionally minimum I may be
taking place. If absorption is the agent, it cannot be due to clouds of H^-.
Clearly, the system must be monitored during the coming years for
further light curve changes, and at least moderate dispersion spectra secured
with a large instrument, preferably simultaneously with the photometry.
CONCLUSION
The two binary systems discussed here were selected from O'Connell's
list of more than 50 stars exhibiting the asymmetry at maximum light. It
is most remarkable that both should have undergone a shift in the sign
of the effect. It is possible that both systems are not properly members
of his list, but it seems more likely that the underlying causes for the
O'Connell effect themselves change with time, and that the general case
Delta m > 0 is probable only.
ACKNOWLEDGEMENTS
It is a pleasure to thank Dr. A. J. Wesselink for suggesting the problem
of the O'Connell Effect and for many valuable discussions, Mr. E. W.
McClurken who provided valuable observing assistance in June, 1967, and
Dr. Douglas Hall for his RT Lacertae data.
Table IV
Extreme of the light curves of CG Cygni
Source Band Date max I max II d max (II-I) min I min II d min (I-11)
Williams (1922) visual 1921 9.93 m 9.94 m +0.01 m 10.42 m (10.15m) (0.27m)
Yu (1922) ptg. 1922 9.219 10.264 +0.045 11.374 10.544 0.830
Milstein and Nicolaev
(1940) ptg. ~1936 11.02 11.02 <=0.00 11.78 11.29 0.49
Milone (1966, 7) V 1965 10.124 10.060 -0.064 (10.86) 10.429 (0.43)
Milone (1966, 7) B 1965 10.990 10.918 -0.072 (11.78) 11.253 (0.53)
Milone (1966, 7) U 1965 11.381 11.301 -0.080 (12.42) 11.604 (0.82)
Milone (unpubl.) V 1967 10.151 10.069 -0.082 10.737 10.459 0.276
Milone (unpubl.) B 1967 11.004 10.898 -0.106 11.663 11.255 0.408
Milone (unpubl.) U 1967 11.409 11.301 -0.108 12.212 (11.61) (0.60)
Milone (unpubl.) V 1965+1967 10.134 10.063 -0.071 -* 10.444 -
Milone (unpubl.) B 1965+1967 10.992 10.917 -0.075 -* 11.258 -
Milone (unpubl.) U 1965+1967 11.393 11.303 -0.090 -* 11.60 -
* Differences are too extreme.
Brackets indicate uncertain values. In addition, the visual (~ 1931) and photographic (~ 1951)
light curves of Tsesevich (1954) show no discernible O'Connell Effect. The values cited for
the early investigations are in local magnitude systems.
This work was begun when the author was a graduate student at Yale, and
was carried forth with the help of a Creativity and Research Grant of
the Lutheran Church in America and Gettysburg College in 1967-1968, a
Gettysburg College Faculty Fellowship in June, 1968, and a summer research
participation fellowship at the University of Maryland from June to September,
1968, the help of all of which the author gratefully knowledges.
REFERENCES
Fowler, M., 1920, Astrophys. J. 52, 257.
Hall, D. S., 1967a, private communication.
Hall, D. S., 1967b, I. A. U. Information Bulletin on Variable Stars, No. 259, Budapest. (IBVS N°.259)
Hall, D. S., 1968, private communication.
Hardie, R. H., 1962, Photoelectric Reductions in Astronomical Techniques, Stars and
Stellar Systems II, 178.
Joy, A. H., 1931, Astrophys. J. 74, 101.
Krat, W. and Nekrasova, S., 1936, Acta Astron. Ser. C., 2, 129.
Kratochvil, P., 1964, Bull. Astron. Inst. Czech. 15, 165.
Kukarkin, B. V., Parenago, P. P., Efremov, Yu. I., and Kholopov, P. N., 1958, General
Catalogue of Variable Stars, 2nd ed., Moscow.
Mergentaler, J., 1950, Wroclaw Contrib. 4.
Milone, E. F., 1966, Astron. J. 71, 864.
Milone, E. F., 1967, Thesis, Yale University.
Milone, E. F., 1968a, Astron. J. 73, S26.
Milone, E. F., 1968b, Astron. J., in press.
Milstein, I. P. and Nicolaev, S. P., 1940, Vsesoiuznoe Astron.-Geodetic Soc. N. 6, 9.
O'Connell, D. J. K., 1951, Riverview Publ. 2, 85.
Tsesevich, V. P., 1954, Odessa Izvestia 4, Part I, 255.
Wachmann, A. A., 1935, Astron. Nachr. 255, 367.
Williams, A. S., 1922, MN 82, 300.
Yu, Ch'ing-Sung, 1923, Astrophys. J. 58, 75.
Fig. 2. Differential V, B-V, and U-B observations of CG Cygni made in
1965 and 1967. Filled and unfilled circles are, respectively, individual
observations made at Kitt Peak in October-November, 1965 and normal points
of observations made at Yale Observatory during 1965; X's mark individual June,
1967 Kitt Peak observations; and +'s are individual July, 1965 observations
made at the Dyer Observatory. The dark line through the DV observations is
the Fourier representation of the combined 1965-67 Kitt Peak observations
outside of eclipse.
Table III
Transformation coefficients and fitting errors for Kitt Peak Telescope
No. 3 photometric system during two nights in 1965
A = Date
B = epsilon
C = sigma epsilon
D = sigma V * Y_0
E = mu
F = sigma mu
G = sigma(B-V)*(b-y)_0
H = Psi
I = sigma Psi
J = sigma(U-B)*(u-b)_0
A B C D E F G H I J
10/7-8 +0.003 1.092 0.989
Mean for Run 1: -0.015 +-0.008 +-0.026 1.088 +-0.002 +-0.020 0.967 +-0.006 +-0.017
10/29-30 -0.040 1.118 0.989
Mean for Run 2: -0.026 +-0.006 +-0.029 1.103 +-0.004 +-0.019 0.977 +-0.001 +-0.019
The notation is that of Hardie (1962). sigma_epsilon is the m.s.e. of the run mean, sigma_V,Y_0 is the
mean square deviation between tabulated and calculated values of V for standard stars.
The other quantities are analogous.
At the present time no radial velocity curve exists, and the mass ratio
is not known. The orbit is sensibly circular with r = 1.44 X 10^-2 X ((m_1+m_2)/m_Sun)^1/3
a.u. The times of external contact are sharp enough to obtain the sum of the
radii: r_1 + r_2 = 0.48 X 10^-2 X ((m_1+m_2)/m_Sun)^1/3 a.u. = 1.2R_Sun for solar masses.
If the mass ratio is of the order unity, the stars do not fill their inner lobes.
From a spectrogram taken at Yale, it is quite clear that the stars cannot
be of early spectral type, but are closer to late G.
The origin of the O'Connell effect in this star is not known, but a slowly
changing absorption of maximum I, and occasionally minimum I may be
taking place. If absorption is the agent, it cannot be due to clouds of H^-.
Clearly, the system must be monitored during the coming years for
further light curve changes, and at least moderate dispersion spectra secured
with a large instrument, preferably simultaneously with the photometry.
CONCLUSION
The two binary systems discussed here were selected from O'Connell's
list of more than 50 stars exhibiting the asymmetry at maximum light. It
is most remarkable that both should have undergone a shift in the sign
of the effect. It is possible that both systems are not properly members
of his list, but it seems more likely that the underlying causes for the
O'Connell effect themselves change with time, and that the general case
Delta m > 0 is probable only.
ACKNOWLEDGEMENTS
It is a pleasure to thank Dr. A. J. Wesselink for suggesting the problem
of the O'Connell Effect and for many valuable discussions, Mr. E. W.
McClurken who provided valuable observing assistance in June, 1967, and
Dr. Douglas Hall for his RT Lacertae data.
Table IV
Extreme of the light curves of CG Cygni
Source Band Date max I max II d max (II-I) min I min II d min (I-11)
Williams (1922) visual 1921 9.93 m 9.94 m +0.01 m 10.42 m (10.15m) (0.27m)
Yu (1922) ptg. 1922 9.219 10.264 +0.045 11.374 10.544 0.830
Milstein and Nicolaev
(1940) ptg. ~1936 11.02 11.02 <=0.00 11.78 11.29 0.49
Milone (1966, 7) V 1965 10.124 10.060 -0.064 (10.86) 10.429 (0.43)
Milone (1966, 7) B 1965 10.990 10.918 -0.072 (11.78) 11.253 (0.53)
Milone (1966, 7) U 1965 11.381 11.301 -0.080 (12.42) 11.604 (0.82)
Milone (unpubl.) V 1967 10.151 10.069 -0.082 10.737 10.459 0.276
Milone (unpubl.) B 1967 11.004 10.898 -0.106 11.663 11.255 0.408
Milone (unpubl.) U 1967 11.409 11.301 -0.108 12.212 (11.61) (0.60)
Milone (unpubl.) V 1965+1967 10.134 10.063 -0.071 -* 10.444 -
Milone (unpubl.) B 1965+1967 10.992 10.917 -0.075 -* 11.258 -
Milone (unpubl.) U 1965+1967 11.393 11.303 -0.090 -* 11.60 -
* Differences are too extreme.
Brackets indicate uncertain values. In addition, the visual (~ 1931) and photographic (~ 1951)
light curves of Tsesevich (1954) show no discernible O'Connell Effect. The values cited for
the early investigations are in local magnitude systems.
This work was begun when the author was a graduate student at Yale, and
was carried forth with the help of a Creativity and Research Grant of
the Lutheran Church in America and Gettysburg College in 1967-1968, a
Gettysburg College Faculty Fellowship in June, 1968, and a summer research
participation fellowship at the University of Maryland from June to September,
1968, the help of all of which the author gratefully knowledges.
REFERENCES
Fowler, M., 1920, Astrophys. J. 52, 257.
Hall, D. S., 1967a, private communication.
Hall, D. S., 1967b, I. A. U. Information Bulletin on Variable Stars, No. 259, Budapest. (IBVS N°.259)
Hall, D. S., 1968, private communication.
Hardie, R. H., 1962, Photoelectric Reductions in Astronomical Techniques, Stars and
Stellar Systems II, 178.
Joy, A. H., 1931, Astrophys. J. 74, 101.
Krat, W. and Nekrasova, S., 1936, Acta Astron. Ser. C., 2, 129.
Kratochvil, P., 1964, Bull. Astron. Inst. Czech. 15, 165.
Kukarkin, B. V., Parenago, P. P., Efremov, Yu. I., and Kholopov, P. N., 1958, General
Catalogue of Variable Stars, 2nd ed., Moscow.
Mergentaler, J., 1950, Wroclaw Contrib. 4.
Milone, E. F., 1966, Astron. J. 71, 864.
Milone, E. F., 1967, Thesis, Yale University.
Milone, E. F., 1968a, Astron. J. 73, S26.
Milone, E. F., 1968b, Astron. J., in press.
Milstein, I. P. and Nicolaev, S. P., 1940, Vsesoiuznoe Astron.-Geodetic Soc. N. 6, 9.
O'Connell, D. J. K., 1951, Riverview Publ. 2, 85.
Tsesevich, V. P., 1954, Odessa Izvestia 4, Part I, 255.
Wachmann, A. A., 1935, Astron. Nachr. 255, 367.
Williams, A. S., 1922, MN 82, 300.
Yu, Ch'ing-Sung, 1923, Astrophys. J. 58, 75.