Non-Periodic Phenomena in Variable Stars
IAU Colloquium, Budapest, 1968
THE CEPHEIDS ON THE COLOUR-COLOUR PLOT
N. S. NIKOLOV and P. Z. KUNCHEV
Department of Astronomy, University of Sofia
A study of the behaviour of cepheids on the colour-colour plot provides
significant information about the radiation of these stars in different regions
of the spectrum and, about the physical conditions in their atmospheres, which
are of importance for the explanation of the physical nature and evolution of
these objects.
The behaviour of more than 200 cepheids were investigated on the
colour-colour plot using the mean values of the colours U-B and B-V at
intervals of 0.05P from Nikolov's catalogue of the light and colour curves
of the cepheids (1968). At first we tried to classify the curves. In spite of
the considerable variety of their shape these curves can be ordered in a few
groups:
1. Linear or almost linear curves. Their colour-changes on the ascending
and descending branches are almost parallel, and the differences in the
U-B values in both branches do not exceed 0.03-0.05 magn. (Fig. 1)
2. "Open" curves. They represent closed contour which includes a considerable
part of the area of the colour-colour plot. More than 50 per cent of the
cepheids belong to group 2. (Fig. 2)
3. Curves exhibiting a loop on the colour-colour plot. In this group are
included those cepheids whose clearly defined loops are not consequences of
uncertain data. (Fig. 3)
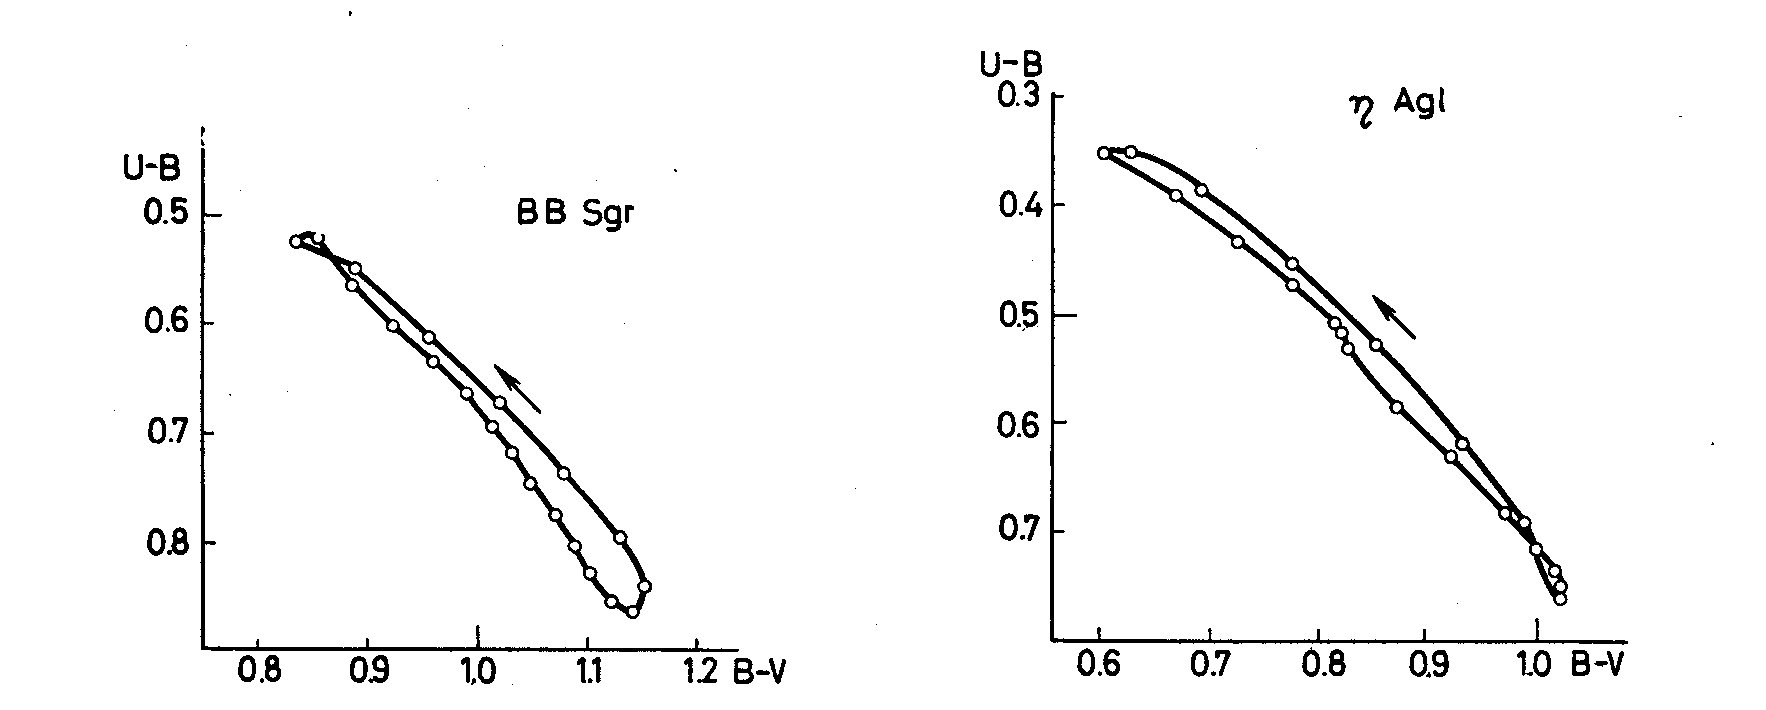 Fig. 1. Colour-colour curves. Group 1.
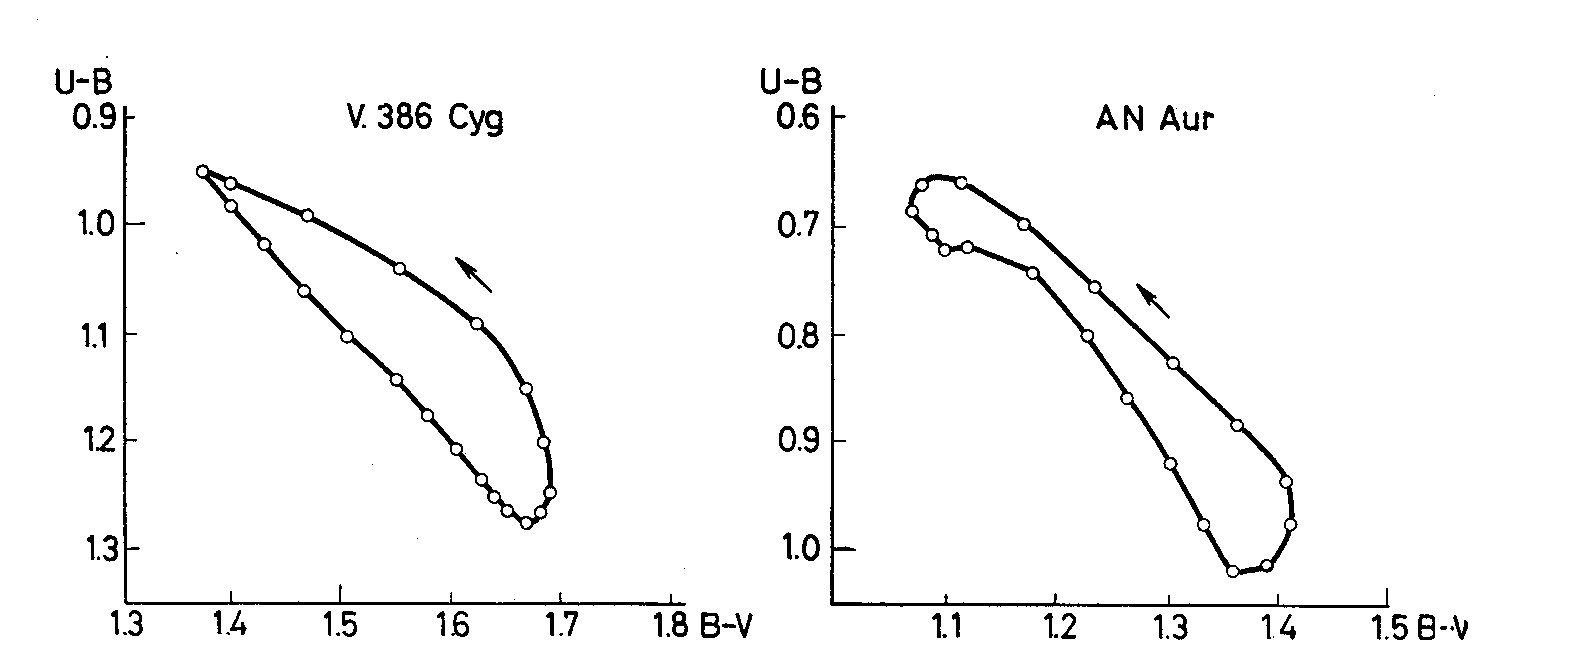 Fig. 2. Colour-colour curves. Group 2.
Our data do not confirm Mianes' opinion (1963) that the presence of a loop
on the colour-colour plot may be considered as a criterion for the star
belonging to Population II. We find among the stars of group 3 CW-type cepheids
and also C delta-type stars. On the other hand, a considerable number of
cepheids classified as CW in the General Catalogue as well as by Petit (1960)
do not show a loop on the colour-colour plot at all.
It is interesting that W Vir itself, as a typical representative of the
Population II cepheids, does not exhibit a loop according to our data,
as well as according to other authors (Kwee 1965, Oosterhoff and Walraven 1966).
We tried to find some relations between the characteristics of the cepheid
curves on the colour-colour plot and the logarithm of the period
of these stars. It was found that the tangent of the angle by which the
curve for each cepheid on the (U-B)_0/(B-V)_0 plot is inclined towards
the (B-V)_0 axis, increased with the period (Fig. 4). This dependence shows
that for a given increase of the temperature during the pulsation the relative
change in the ultraviolet emission grows with increasing period.
Fig. 2. Colour-colour curves. Group 2.
Our data do not confirm Mianes' opinion (1963) that the presence of a loop
on the colour-colour plot may be considered as a criterion for the star
belonging to Population II. We find among the stars of group 3 CW-type cepheids
and also C delta-type stars. On the other hand, a considerable number of
cepheids classified as CW in the General Catalogue as well as by Petit (1960)
do not show a loop on the colour-colour plot at all.
It is interesting that W Vir itself, as a typical representative of the
Population II cepheids, does not exhibit a loop according to our data,
as well as according to other authors (Kwee 1965, Oosterhoff and Walraven 1966).
We tried to find some relations between the characteristics of the cepheid
curves on the colour-colour plot and the logarithm of the period
of these stars. It was found that the tangent of the angle by which the
curve for each cepheid on the (U-B)_0/(B-V)_0 plot is inclined towards
the (B-V)_0 axis, increased with the period (Fig. 4). This dependence shows
that for a given increase of the temperature during the pulsation the relative
change in the ultraviolet emission grows with increasing period.
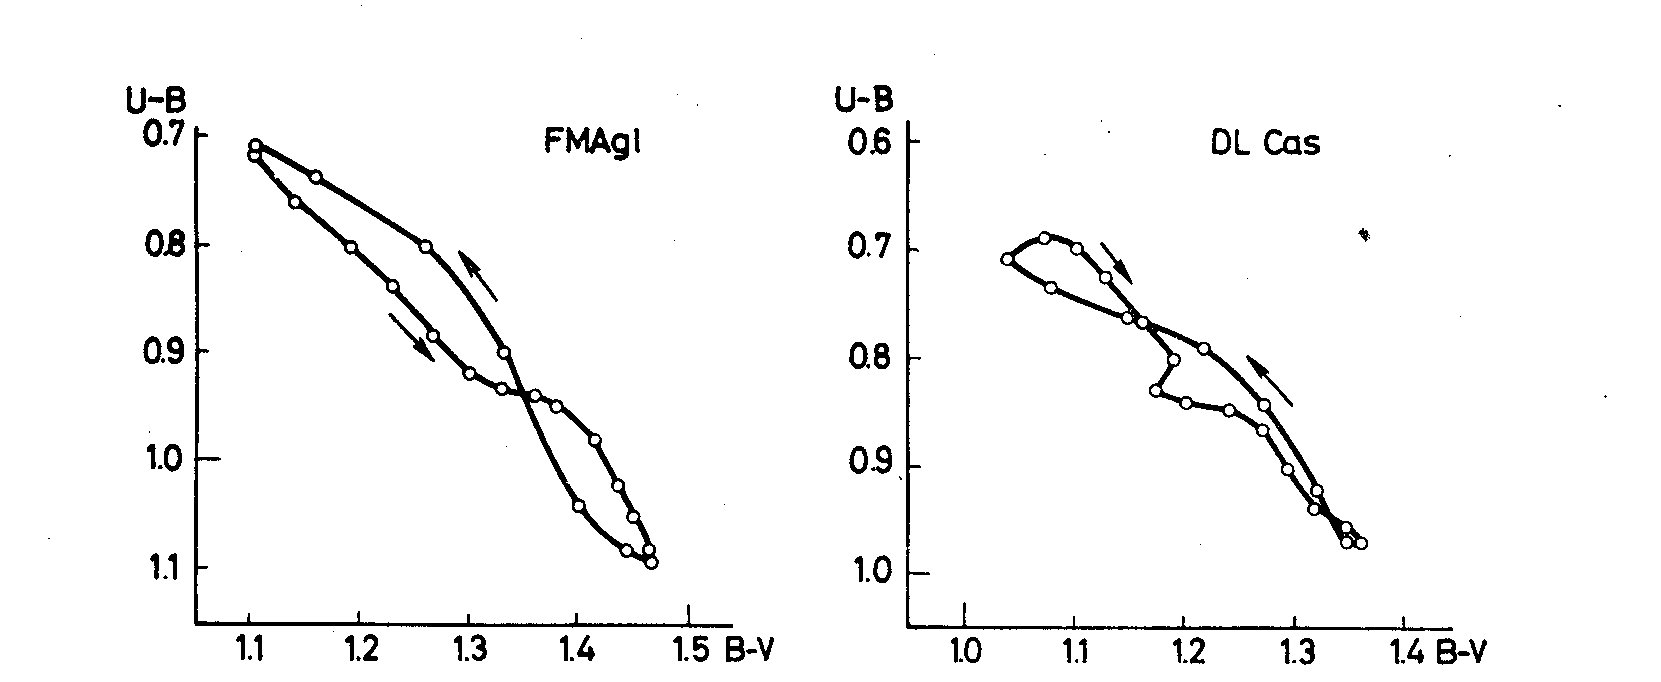 Fig. 3. Colour-colour curves. Group 3.
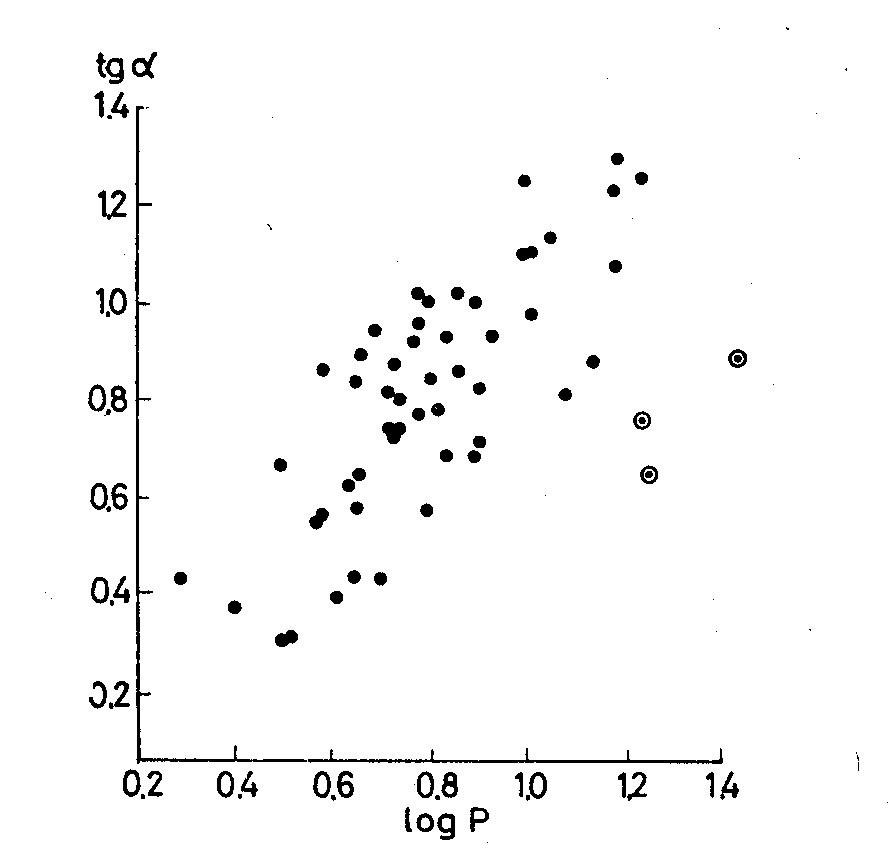 Fig. 4
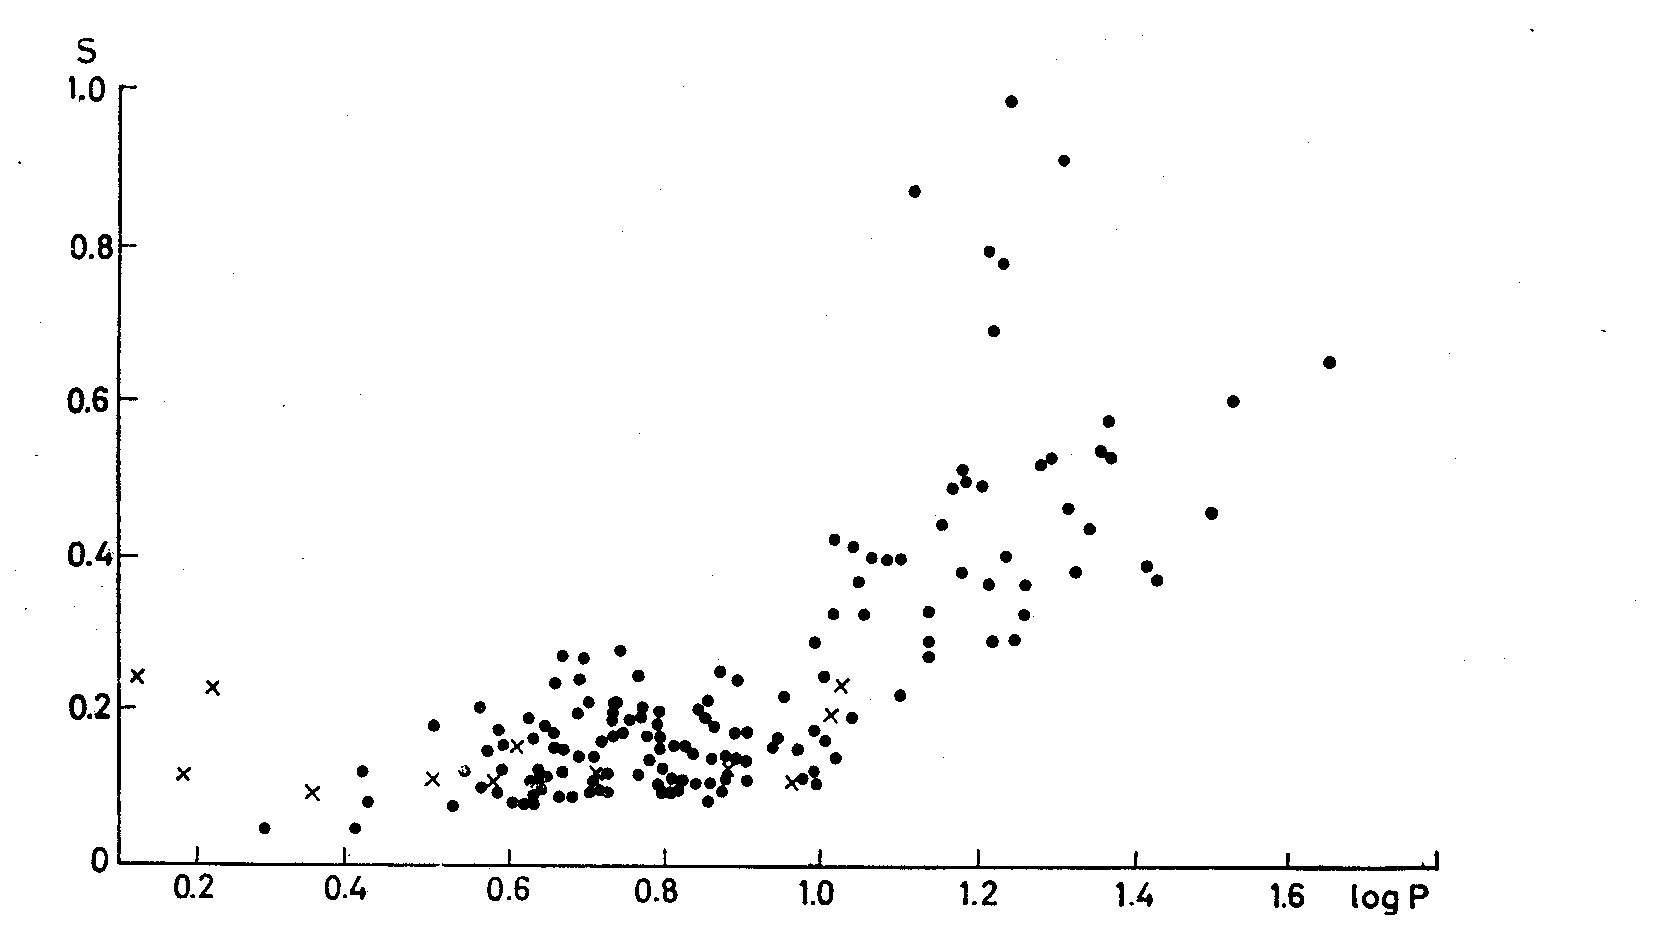 Fig. 5
Since the areas limited by the cepheid curves on the (U-B)_0/(B-V)_0 plot do
not differ essentially from those on the (U-B)/(B-V) plot, the areas limited by
the two-colour curves of about 160 cepheids were determined and plotted against
the logarithm of the periods (Fig. 5). It is evident that for all stars with
periods from 1d to about 10d the surface occupied by the two-colour curves
practically does not increase, or it increases only slightly with increasing
period. For periods longer than about 10 days this surface increases
comparatively quickly. On the basis of some additional investigations we
concluded that the major part of the observed effect is due to the increasing
differences between the values of U-B for the ascending and descending branches
of the curve, although the increase of the range B-V and U-B with the period
also influences the surfaces determined by the two-colour curves.
Thus the increase of the "opening" of the curves (U-B)/(B-V) correlates
strongly with the logarithm of the period. So, for a given B-V the ultraviolet
emission for the ascending branch is stronger than for the descending branch
of the two-colour curve. The difference in this emission is greater for the
periods longer than about 10d.
It is difficult to arrive at definitive conclusions about the physical
causes which are responsible for the observed relations. Three causes
can be mentioned, which may influence the observed effects.
1. The presence of emission lines in the spectrum of the cepheids with
relatively longer periods (see Kraft 1960).
The presence of emission lines in the spectrum on the ascending branch
of the light curve will lead to an increase of the ultraviolet emission
and therefore the ascending branch of the two-colour curves will be
shifted towards smaller U-B values. The surface mentioned above will
therefore increase.
2. Probably the influence on the ultraviolet emission will also cause a
decrease of the effective gravity at the descending branch of the two-colour
curve. The longer the cepheid pulsation period, the larger the pulsation range,
and the effective gravity will become still smaller on the descending branch.
In accordance with this, one observes with the increase of the period a still
smaller ultraviolet emission on the descending branch.
3. The blanketing effect may also influence the observed phenomena.
REFERENCES
Kraft, R. P., 1960, "Stellar atmospheres", Chicago.
Kukarkin, B. V., Parenago, P. P., Efremov, Yu. I. and Kholopov, P. N., 1958, Gen.
Catal. of Var. Stars, Moscow.
Kukarkin, B. V., Efremov, Yu. I. and Kholopov, P. N., 1960, Suppl. of the GC, Moscow.
Kwee, K. K., 1965, Colloquium of Comm. 27. of IAU, Bamberg.
Mianes, P. M., 1963, Ann. d'Astrophys. 26, 1.
Nikolov, N. S., 1968, Catalogue of the light and colour curves of the cepheids, Bulg.
Acad. of Sciences, Sofia.
Oosterhoff, P. and Walraven, Th., 1966, Bull. astr. Inst. Netherl. 18, 387.
DISCUSSION
Fernie: It is still true that the abnormality in color is always in U-B
and that this U-B excess is greatest near maximum light?
Nikolov: In this paper we discuss the ultraviolet emission on a given B-V
or its change on a given change of B-V, but I think that we still
have no data which could demonstrate that the abnormality in color is
not due to U-B. In one of our previous papers (Nikolov, 1967, Astr.
Zu., 44, 120) we pointed out that the U-B excess correlates with the
B-amplitude (Kraft's value f_B) only around maximum light.
Fig. 5
Since the areas limited by the cepheid curves on the (U-B)_0/(B-V)_0 plot do
not differ essentially from those on the (U-B)/(B-V) plot, the areas limited by
the two-colour curves of about 160 cepheids were determined and plotted against
the logarithm of the periods (Fig. 5). It is evident that for all stars with
periods from 1d to about 10d the surface occupied by the two-colour curves
practically does not increase, or it increases only slightly with increasing
period. For periods longer than about 10 days this surface increases
comparatively quickly. On the basis of some additional investigations we
concluded that the major part of the observed effect is due to the increasing
differences between the values of U-B for the ascending and descending branches
of the curve, although the increase of the range B-V and U-B with the period
also influences the surfaces determined by the two-colour curves.
Thus the increase of the "opening" of the curves (U-B)/(B-V) correlates
strongly with the logarithm of the period. So, for a given B-V the ultraviolet
emission for the ascending branch is stronger than for the descending branch
of the two-colour curve. The difference in this emission is greater for the
periods longer than about 10d.
It is difficult to arrive at definitive conclusions about the physical
causes which are responsible for the observed relations. Three causes
can be mentioned, which may influence the observed effects.
1. The presence of emission lines in the spectrum of the cepheids with
relatively longer periods (see Kraft 1960).
The presence of emission lines in the spectrum on the ascending branch
of the light curve will lead to an increase of the ultraviolet emission
and therefore the ascending branch of the two-colour curves will be
shifted towards smaller U-B values. The surface mentioned above will
therefore increase.
2. Probably the influence on the ultraviolet emission will also cause a
decrease of the effective gravity at the descending branch of the two-colour
curve. The longer the cepheid pulsation period, the larger the pulsation range,
and the effective gravity will become still smaller on the descending branch.
In accordance with this, one observes with the increase of the period a still
smaller ultraviolet emission on the descending branch.
3. The blanketing effect may also influence the observed phenomena.
REFERENCES
Kraft, R. P., 1960, "Stellar atmospheres", Chicago.
Kukarkin, B. V., Parenago, P. P., Efremov, Yu. I. and Kholopov, P. N., 1958, Gen.
Catal. of Var. Stars, Moscow.
Kukarkin, B. V., Efremov, Yu. I. and Kholopov, P. N., 1960, Suppl. of the GC, Moscow.
Kwee, K. K., 1965, Colloquium of Comm. 27. of IAU, Bamberg.
Mianes, P. M., 1963, Ann. d'Astrophys. 26, 1.
Nikolov, N. S., 1968, Catalogue of the light and colour curves of the cepheids, Bulg.
Acad. of Sciences, Sofia.
Oosterhoff, P. and Walraven, Th., 1966, Bull. astr. Inst. Netherl. 18, 387.
DISCUSSION
Fernie: It is still true that the abnormality in color is always in U-B
and that this U-B excess is greatest near maximum light?
Nikolov: In this paper we discuss the ultraviolet emission on a given B-V
or its change on a given change of B-V, but I think that we still
have no data which could demonstrate that the abnormality in color is
not due to U-B. In one of our previous papers (Nikolov, 1967, Astr.
Zu., 44, 120) we pointed out that the U-B excess correlates with the
B-amplitude (Kraft's value f_B) only around maximum light.