Non-Periodic Phenomena in Variable Stars
IAU Colloquium, Budapest, 1968
HYDROGEN EMISSION PHENOMENA IN T TAURI STARS
L. ANDERSON and L. V. KUHI
University of California, Berkeley
INTRODUCTION
The sample studied includes the 25 or so T Tauri stars with apparent
magnitude brighter than 13 visible from Lick Observatory. For
photometric data, an FW 130 with S20 response out to 7500 A was used,
with exit slits of 48 A for lambda < 5500 A and 64 A for lambda > 5500 A.
All observations were made on the 120-inch Lick telescope, except those
marked 1965, which were made on the 200-inch telescope at Mt. Palomar.
The reduction was carried out with a mean extinction curve for all
nights, and using a new calibration of Vega (Hayes 1967). Data and
reductions are most complete for the star AS209; this paper, as a
preliminary report, shall deal exclusively with that star.
AS209 (1900: 16h 43.6m, -14 deg 13'; m_pg ~ 12) is a T Tauri star which
illuminates a bright nebulosity and has a strong emission spectrum including
a UV excess shortward of ~ lambda 3700 and the following lines:
The Balmer series out to ~ H22 and Paschen to P14;very strong H and
K and the infrared triplet of ionized Calcium;
the stronger multiplets of FeII and TiII;
lambda 4063 and lambda 4132 of FeI;
strong HeI lambda 10830;
weak lines of MgI and other metals; and
very weak lines of [OII] lambda 3727 and [SII] lambda 4068
(these however do not appear on coudé plates obtained in 1967-68).
The absorption lines are all broadened and/or filled in by continuous
emission so that no spectral type may be determined from them.
Approximate UBV colors are V = 11.33, B-V = + 1.2, U-B = -0.4 which
indicates a type ~ K5V but these are uncorrected for reddening.
THE HYDROGEN LINE SPECTRUM
Table 1 shows the Balmer decrement obtained from a 16A/mm Coudé spectrum
(Apr. 3, 1961). The flatness of the decrement in the higher members and
the steep rise to a very strong H alpha implies that both collisional
transitions and self absorption are important. This is further evidenced
by Figure 1 which is a plot of Log_10 H beta/H gamma vs Log_10 H alpha/H beta.
Note the meandering over the diagram. The star was brighter in the visual
in 1965 and 1966 than in 1967 and 1968.
Table 1
The Balmer Decrement (Correction factor for K5V)
Line H beta gamma delta 8 9 10 12
Obs. Int. 45 90.4 60.3 32.8 35.0 32.9 25.4
Cor. Int. 34.9 21.3 9.1 3.3 3.2 3.0 2.3
1/2 width 6.5 5.07 5.27 5.27 4.09 3.45 3.70 A
Area 227 108 48 17 13 10 8.5
Decrement 1.000 .475 .211 .075 .057 .044 .037
Line 13 14 15 16 17 18 19
Obs. Int. 25.9 24.3 24.7 19.0 17.9 16.8 18.4
Cor. Int. 2.3 2.2 2.2 1.7 1.6 1.5 1.65
1/2 width 3.45 3.45 2.81 4.29 2.61 2.81 2.71 A
Area 7.9 7.6 6.2 7.3 4.2 4.2 4.5
Decrement .035 .033 .027 .032 .018 .018 .020
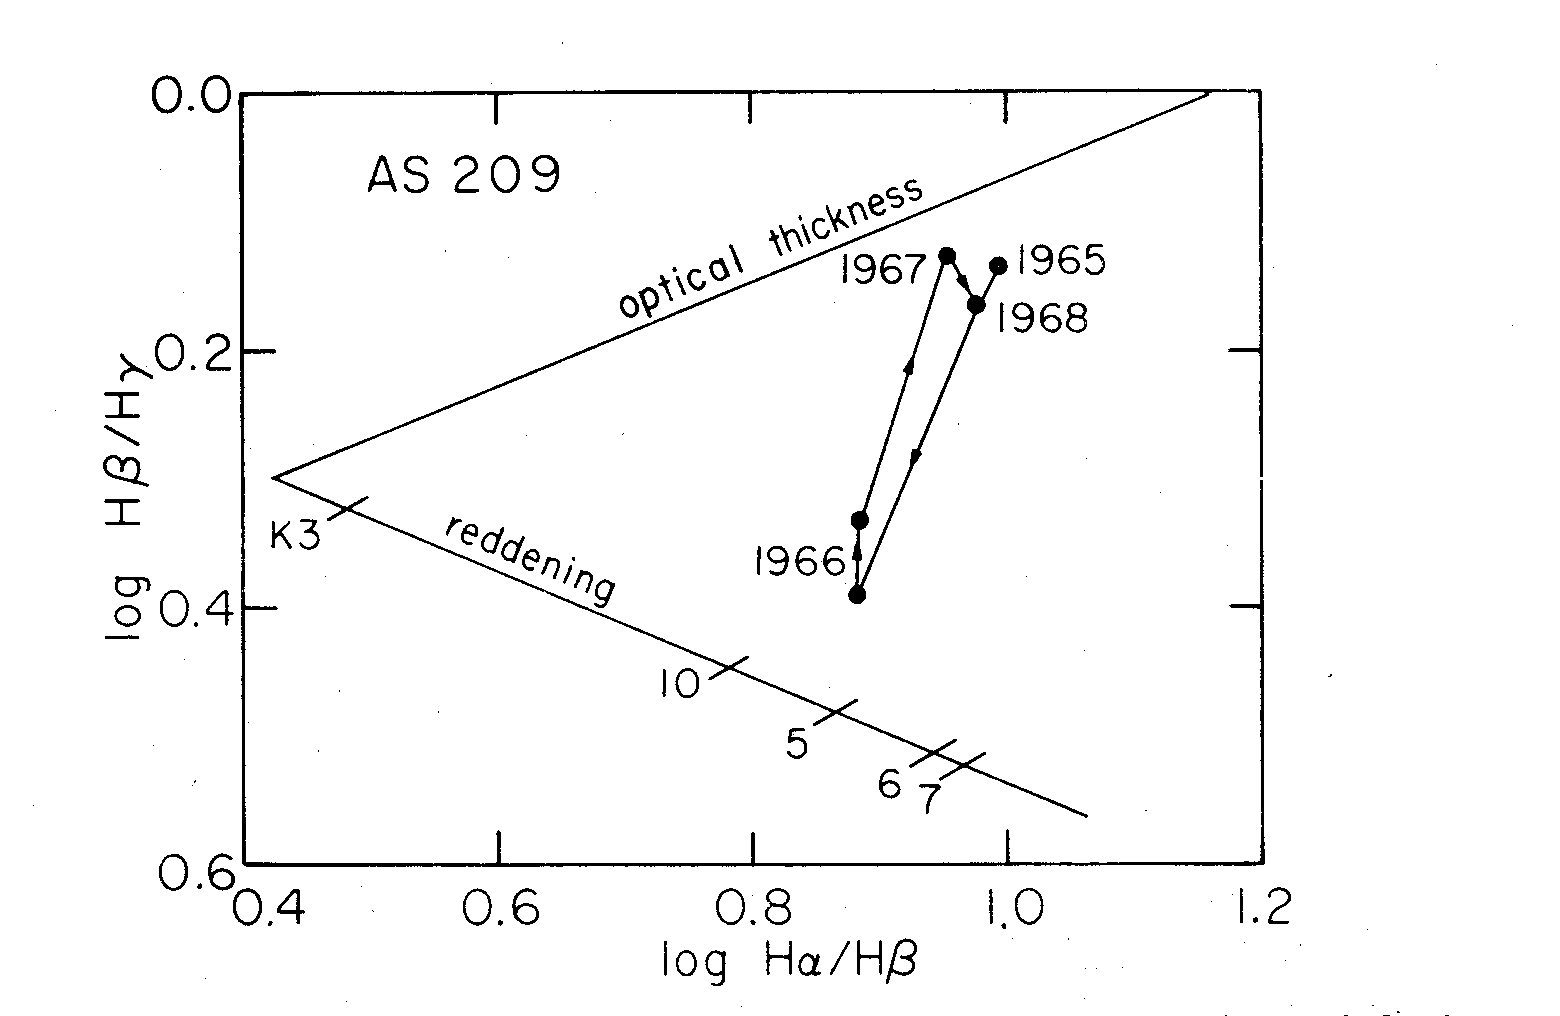 Fig. 1. Intensity ratios of H alpha, beta, and gamma in AS209 from 1965 to 1968.
The symbols along the reddening line are explained in the text.
The marks 5, 6, 7 on the reddening line show the location of the optical
thickness line if the reddening is calculated from the ratio of P gamma/H delta
for the years 1965, '6, and '7 respectively. If the medium is optically thin in
P gamma, H delta, this ratio is useful since it is independent of such physical
parameters as temperature, density, and gravity. However, it is obvious that
using this ratio results in an estimation of the reddening which is far too
large; therefore one may assume that the star is not optically thin in H delta.
The marks K0, K3 show the location of the optical thickness line when the 1966
data are corrected for reddening using the I(lambda 4465) - I(lambda 5556)
color and assuming a K0V, K3V spectral type. If the spectral type remains
constant, then some other agent, such as the presence of collisional
transitions (Parker 1964) is responsible for the motion parallel to the
reddening line.
SOME COMMENTS ON LINE BROADENING AND BLENDING AND THE SO
CALLED "BLUE CONTINUUM"
I. M. Gordon (1957, 1958) has proposed that synchrotron emission in the
infrared from selective "active zones" on the surface of the star may be
responsible for the broadening and blending of the higher member Balmer lines
into what has been referred to as the anomalous "blue continuum" of T Tauri
objects. The polarized infrared emission induces transitions among the upper
energy levels which decreases the mean life time and correspondingly increases
the line width of emission resulting from transitions from those levels. This
proposal is supported in AS209 by an observed infrared excess and a slight
correlation between this excess and the variations in the ultraviolet and blue
continuum.
However, one might expect to see radio emission as well as infrared from
the synchrotron process, but this is not observed.
The authors prefer the simpler hypothesis of Böhm, that the blending is
caused by turbulent motions, in combination with poor instrumental
resolution. At the dispersion of 430 A/mm Böhm (1957) found the "blue
continuum" shortward of lambda 3760 and estimated that a turbulent velocity
of 50 km/sec would be sufficient; with a dispersion of 16 A/mm, Kuhi has
found that the "blue continuum" does not begin until lambda 3690 and that the
width of H8 indicates a turbulent velocity as large as - 100 km/sec (if
no rotational velocity is present).
In reality, both Gordon's and Böhm's effects may be present, but the
verification of the former must await polarization measurements in the
infrared.
Fig. 1. Intensity ratios of H alpha, beta, and gamma in AS209 from 1965 to 1968.
The symbols along the reddening line are explained in the text.
The marks 5, 6, 7 on the reddening line show the location of the optical
thickness line if the reddening is calculated from the ratio of P gamma/H delta
for the years 1965, '6, and '7 respectively. If the medium is optically thin in
P gamma, H delta, this ratio is useful since it is independent of such physical
parameters as temperature, density, and gravity. However, it is obvious that
using this ratio results in an estimation of the reddening which is far too
large; therefore one may assume that the star is not optically thin in H delta.
The marks K0, K3 show the location of the optical thickness line when the 1966
data are corrected for reddening using the I(lambda 4465) - I(lambda 5556)
color and assuming a K0V, K3V spectral type. If the spectral type remains
constant, then some other agent, such as the presence of collisional
transitions (Parker 1964) is responsible for the motion parallel to the
reddening line.
SOME COMMENTS ON LINE BROADENING AND BLENDING AND THE SO
CALLED "BLUE CONTINUUM"
I. M. Gordon (1957, 1958) has proposed that synchrotron emission in the
infrared from selective "active zones" on the surface of the star may be
responsible for the broadening and blending of the higher member Balmer lines
into what has been referred to as the anomalous "blue continuum" of T Tauri
objects. The polarized infrared emission induces transitions among the upper
energy levels which decreases the mean life time and correspondingly increases
the line width of emission resulting from transitions from those levels. This
proposal is supported in AS209 by an observed infrared excess and a slight
correlation between this excess and the variations in the ultraviolet and blue
continuum.
However, one might expect to see radio emission as well as infrared from
the synchrotron process, but this is not observed.
The authors prefer the simpler hypothesis of Böhm, that the blending is
caused by turbulent motions, in combination with poor instrumental
resolution. At the dispersion of 430 A/mm Böhm (1957) found the "blue
continuum" shortward of lambda 3760 and estimated that a turbulent velocity
of 50 km/sec would be sufficient; with a dispersion of 16 A/mm, Kuhi has
found that the "blue continuum" does not begin until lambda 3690 and that the
width of H8 indicates a turbulent velocity as large as - 100 km/sec (if
no rotational velocity is present).
In reality, both Gordon's and Böhm's effects may be present, but the
verification of the former must await polarization measurements in the
infrared.
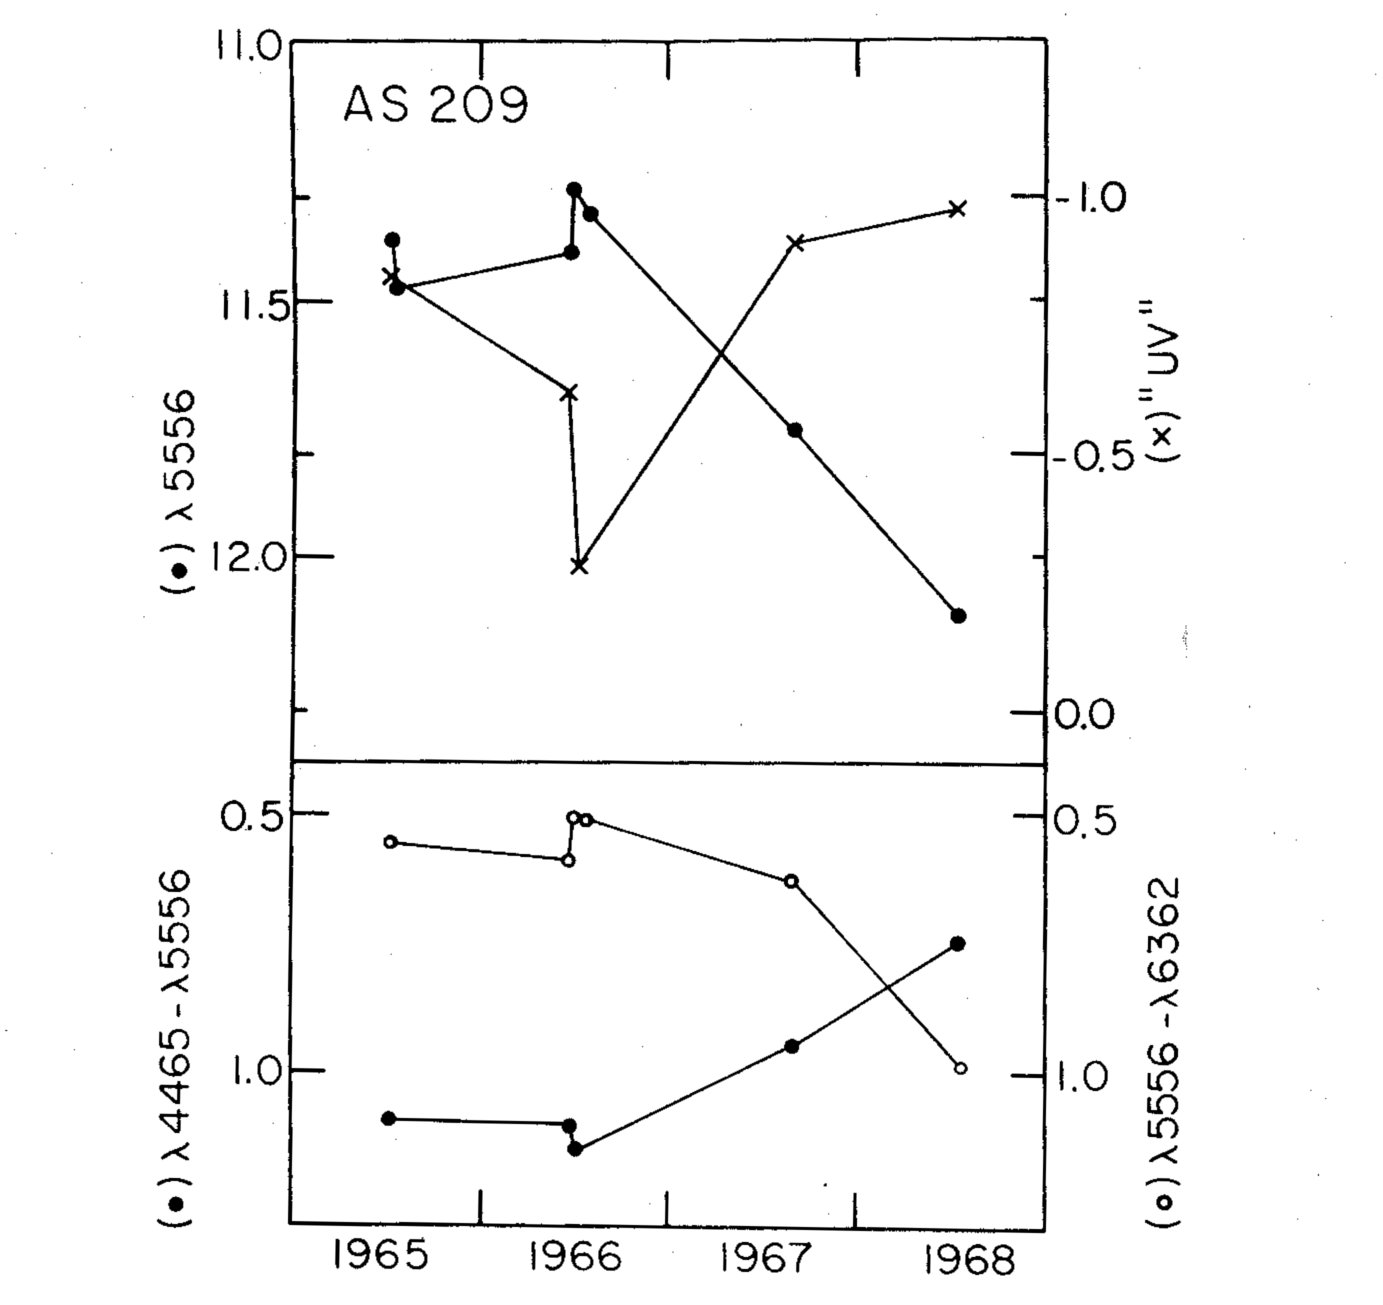 Fig. 2. Narrowband magnitudes and colors of AS209 from 1965 to 1968. "UV" is
defined in the text and is a measure of the ultraviolet excess.
A NOTE ON THE H alpha VS. UV EXCESS RELATION
T Tauri stars as a class seem to have a fairly well defined relation (of
positive slope) between the intensity of H alpha and the ultraviolet excess
(Kuhi, 1966); however, individual examples, in particular AS209, have no
such relation in their variations with time.
Fig. 2. Narrowband magnitudes and colors of AS209 from 1965 to 1968. "UV" is
defined in the text and is a measure of the ultraviolet excess.
A NOTE ON THE H alpha VS. UV EXCESS RELATION
T Tauri stars as a class seem to have a fairly well defined relation (of
positive slope) between the intensity of H alpha and the ultraviolet excess
(Kuhi, 1966); however, individual examples, in particular AS209, have no
such relation in their variations with time.
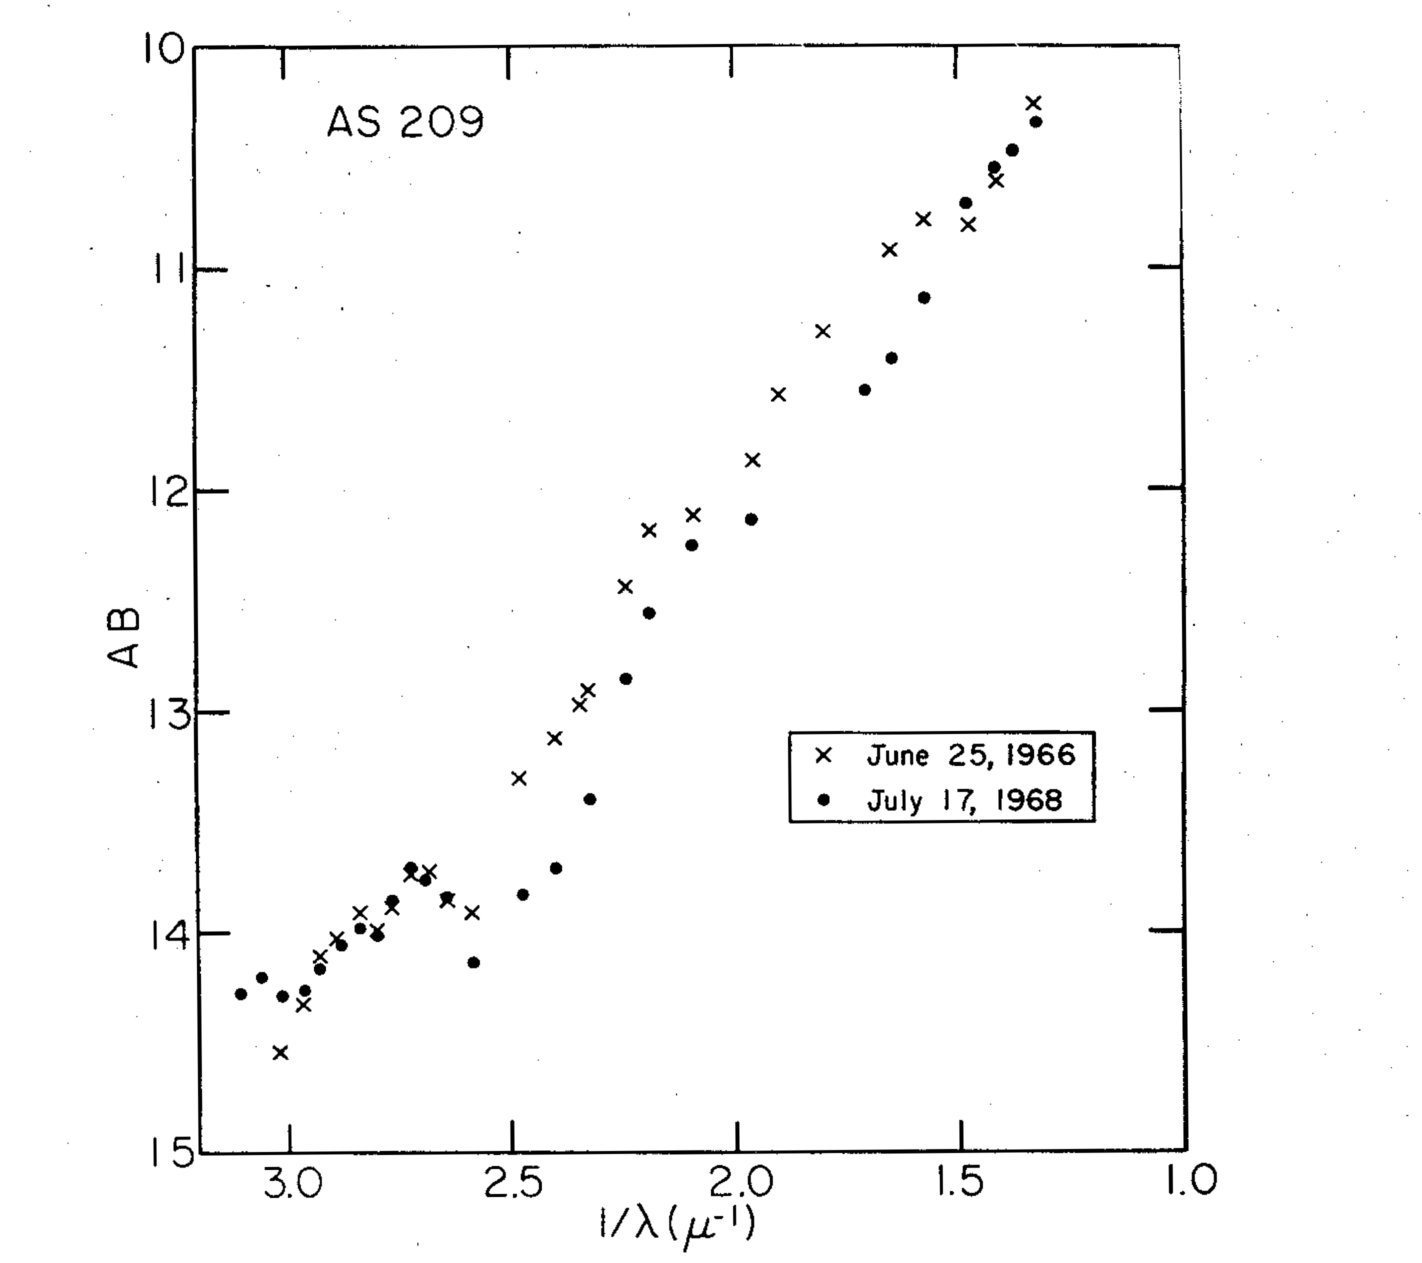 Fig. 3. Continuous energy distribution of AS209. AB gives the observed flux
in mag. per unit frequency. No reddening corrections have been applied.
CONTINUUM OBSERVATIONS
Figure 2 is a plot of the variations in intensity (units: magnitudes/d nu )
for the following parts of the continuum:
a) lambda 5556 (approximately V; 64 A exit slit)
b) lambda 3620 - 2(lambda 4032) + lambda 4465 (a measure of the UV
excess; 48 A exit slits)
c) lambda 4465 (48 A exit) - lambda 5556 (64 A exit) (a measure of the blue
color, ~ B-V )
d) lambda 5556 lambda 6362 (a measure of the red color, ~ V-r; 64 A
exit slits)
These plots show that the star is redder in I(lambda 5556) -I(lambda 6362)
and bluer I(lambda 4465) -I(lambda 5556) and has a larger UV excess when it is
fainter in the visual, i.e. I(lambda 5556).
There are some peculiar apparent inconsistencies between figures 1 and 2.
In 1965 and 1966 the I(lambda 4465) I(lambda 5556) color is about the same, but
the visual [I(lambda 5556)] is higher in 1966 and the UV excess is less.
If one then assumes that collisional excitation changes are responsible for
these differences and the position changes on the log - log plot (figure 1),
it becomes difficult to explain the observation that the star is
bluer in 1967 and 1968 than in 1965 but has the same H beta/H gamma,
H alpha/H beta values. In 1968 I(lambda 4465) - I(lambda 5556) = .75
as opposed to 1.1 in 1966; if the star actually became hotter (to a K0),
it would have required no reddening correction (which is unlikely), and would
have become brighter, but I(lambda 5556) is 0.6 magnitudes fainter. It should be
noted that none of the continuum changes correlate with the changes in optical
depth in figure 1. Note also that I(lambda 5556) - I(lambda 6362) is redder in
1968 than on any previous date which implies a later spectral type than when the
star was brighter and reddening [from I(lambda 4465) - I(lambda 5556)] was greater.
Fig. 3. Continuous energy distribution of AS209. AB gives the observed flux
in mag. per unit frequency. No reddening corrections have been applied.
CONTINUUM OBSERVATIONS
Figure 2 is a plot of the variations in intensity (units: magnitudes/d nu )
for the following parts of the continuum:
a) lambda 5556 (approximately V; 64 A exit slit)
b) lambda 3620 - 2(lambda 4032) + lambda 4465 (a measure of the UV
excess; 48 A exit slits)
c) lambda 4465 (48 A exit) - lambda 5556 (64 A exit) (a measure of the blue
color, ~ B-V )
d) lambda 5556 lambda 6362 (a measure of the red color, ~ V-r; 64 A
exit slits)
These plots show that the star is redder in I(lambda 5556) -I(lambda 6362)
and bluer I(lambda 4465) -I(lambda 5556) and has a larger UV excess when it is
fainter in the visual, i.e. I(lambda 5556).
There are some peculiar apparent inconsistencies between figures 1 and 2.
In 1965 and 1966 the I(lambda 4465) I(lambda 5556) color is about the same, but
the visual [I(lambda 5556)] is higher in 1966 and the UV excess is less.
If one then assumes that collisional excitation changes are responsible for
these differences and the position changes on the log - log plot (figure 1),
it becomes difficult to explain the observation that the star is
bluer in 1967 and 1968 than in 1965 but has the same H beta/H gamma,
H alpha/H beta values. In 1968 I(lambda 4465) - I(lambda 5556) = .75
as opposed to 1.1 in 1966; if the star actually became hotter (to a K0),
it would have required no reddening correction (which is unlikely), and would
have become brighter, but I(lambda 5556) is 0.6 magnitudes fainter. It should be
noted that none of the continuum changes correlate with the changes in optical
depth in figure 1. Note also that I(lambda 5556) - I(lambda 6362) is redder in
1968 than on any previous date which implies a later spectral type than when the
star was brighter and reddening [from I(lambda 4465) - I(lambda 5556)] was greater.
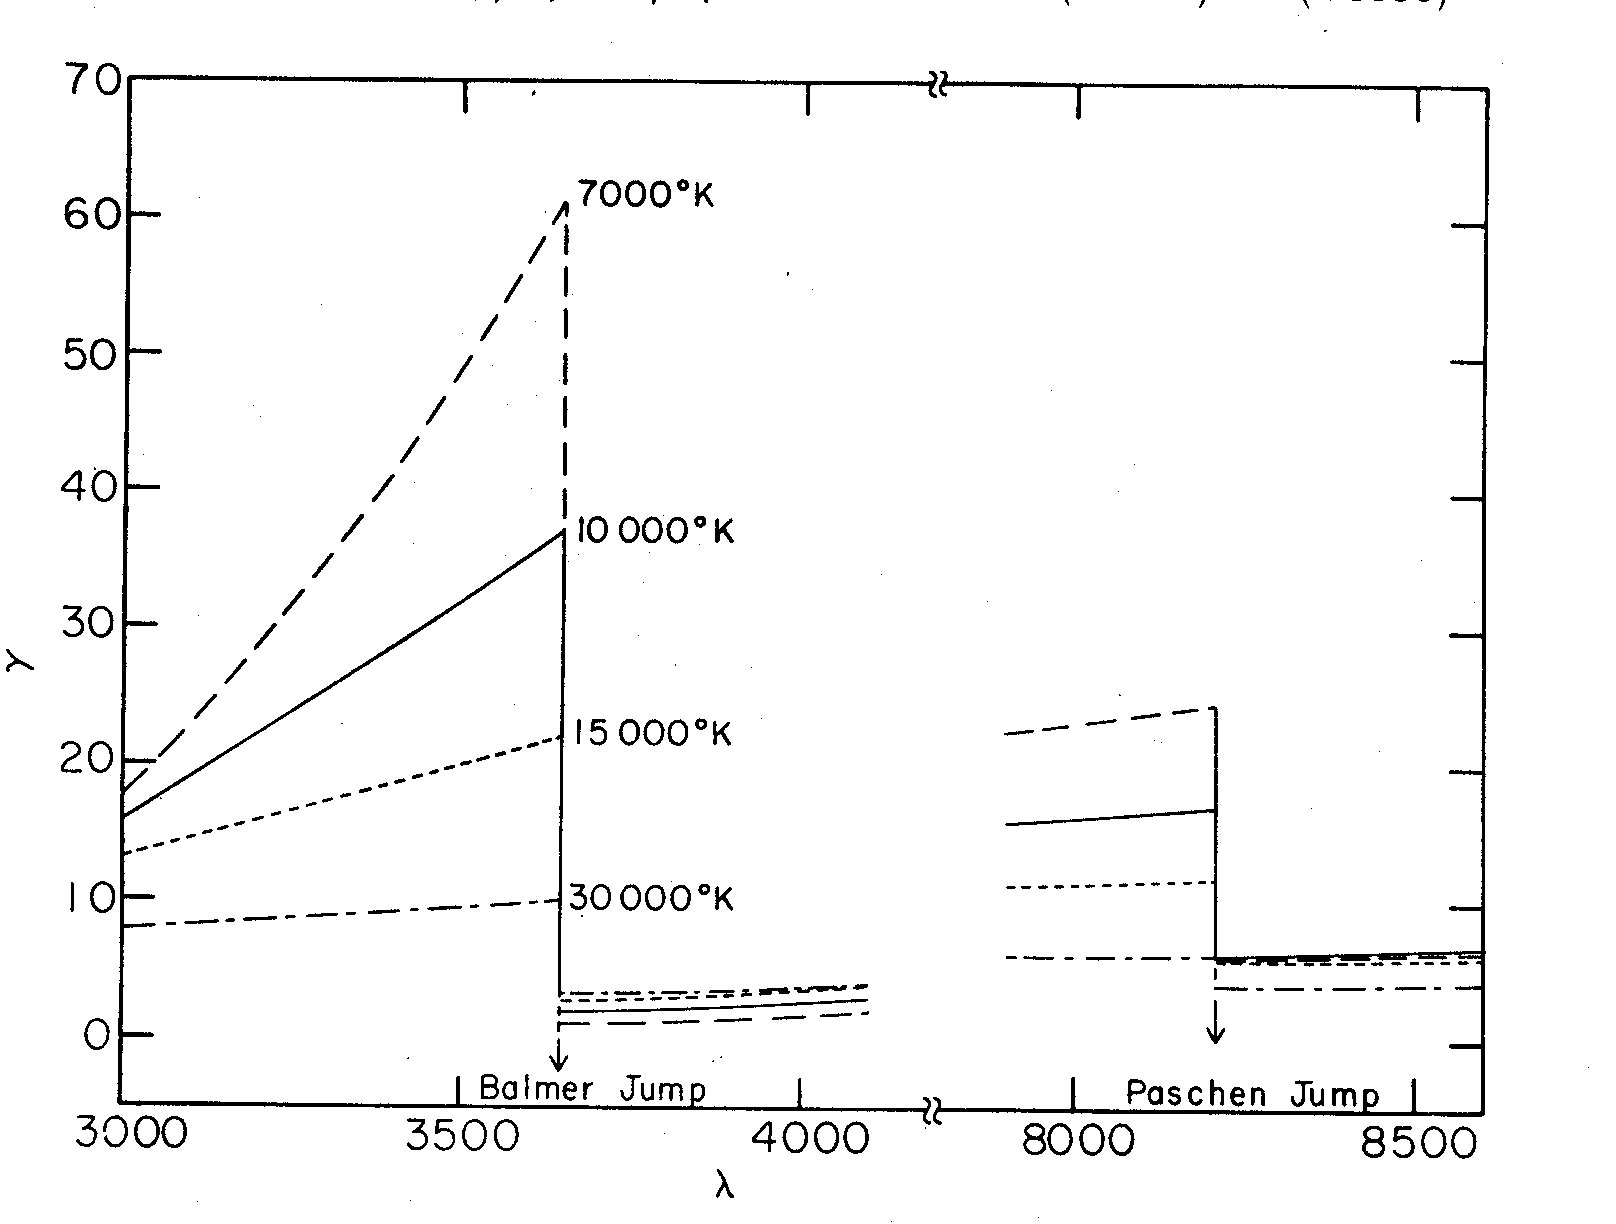 Fig. 4. Continuous emission of hydrogen (free-free and free-bound component)
for Case B. The energy emitted is N_p N_e gamma d(h nu). The units
of gamma are 10^-14 cm^3-sec^-1; lambda is in Angstroms
Fig. 4. Continuous emission of hydrogen (free-free and free-bound component)
for Case B. The energy emitted is N_p N_e gamma d(h nu). The units
of gamma are 10^-14 cm^3-sec^-1; lambda is in Angstroms
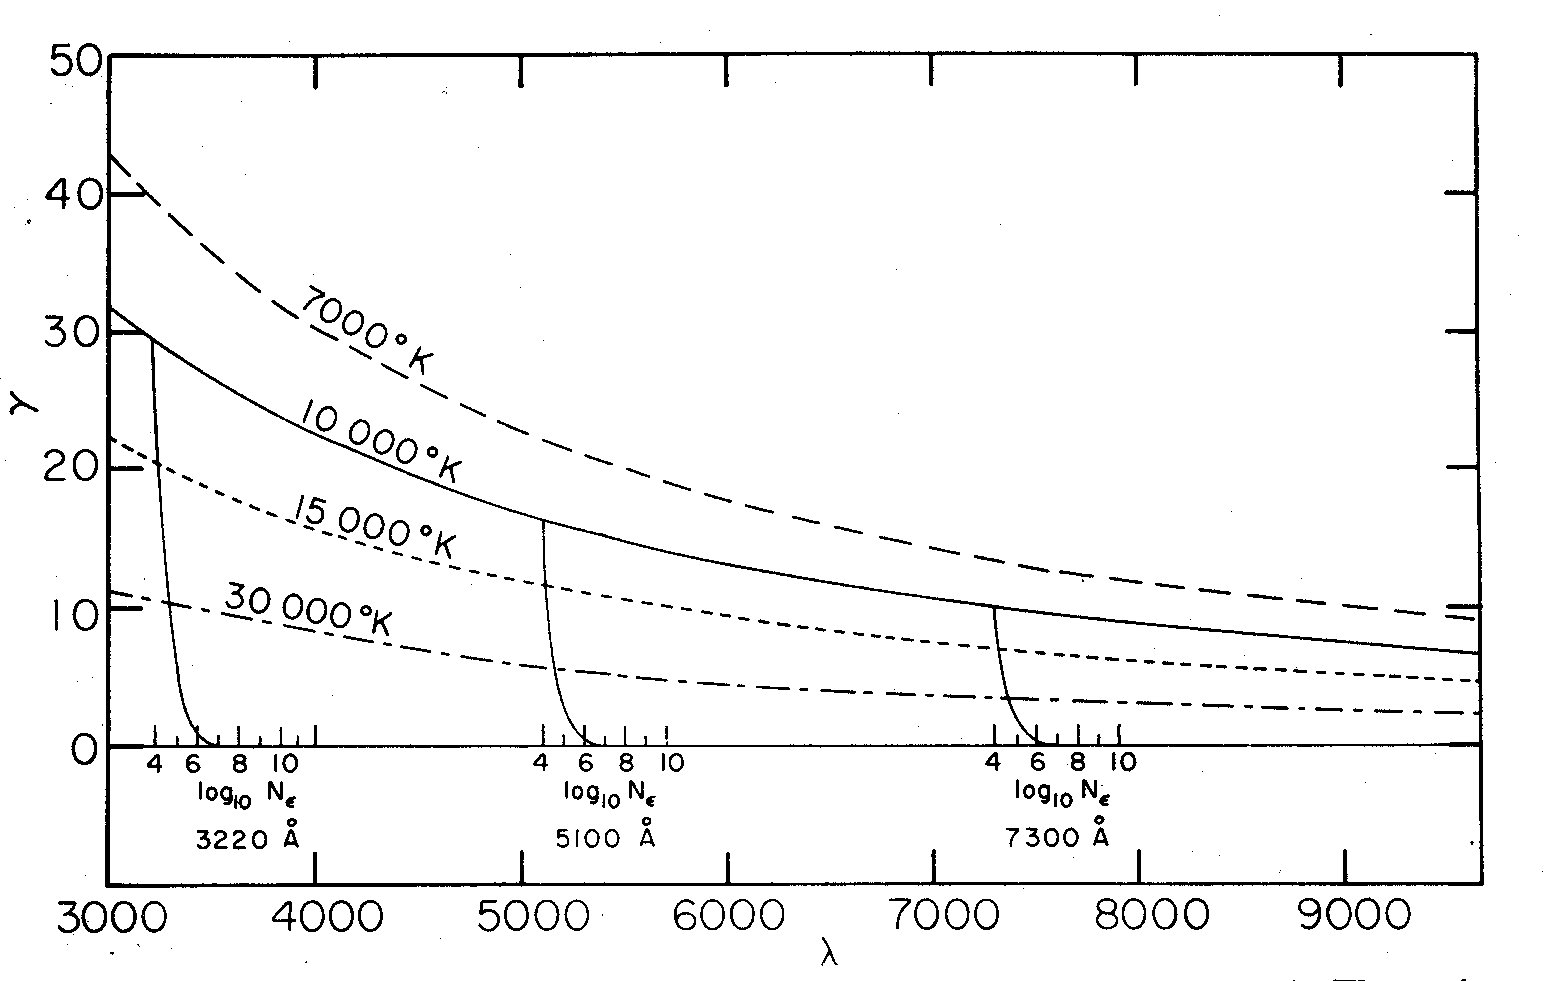 Fig. 5. Continuous emission of hydrogen (two-photon 2s -> 1s component).
The units of gamma are 10^-14 cm^3 sec^-1. The smaller graphs show
the dependence of gamma on electron density N_e at lambda 3220,
lambda 5100 and lambda 7300 for a temperature of 10000 deg K.
The data are from Spitzer and Greenstein (1951) and Seaton (1960).
Fig. 5. Continuous emission of hydrogen (two-photon 2s -> 1s component).
The units of gamma are 10^-14 cm^3 sec^-1. The smaller graphs show
the dependence of gamma on electron density N_e at lambda 3220,
lambda 5100 and lambda 7300 for a temperature of 10000 deg K.
The data are from Spitzer and Greenstein (1951) and Seaton (1960).
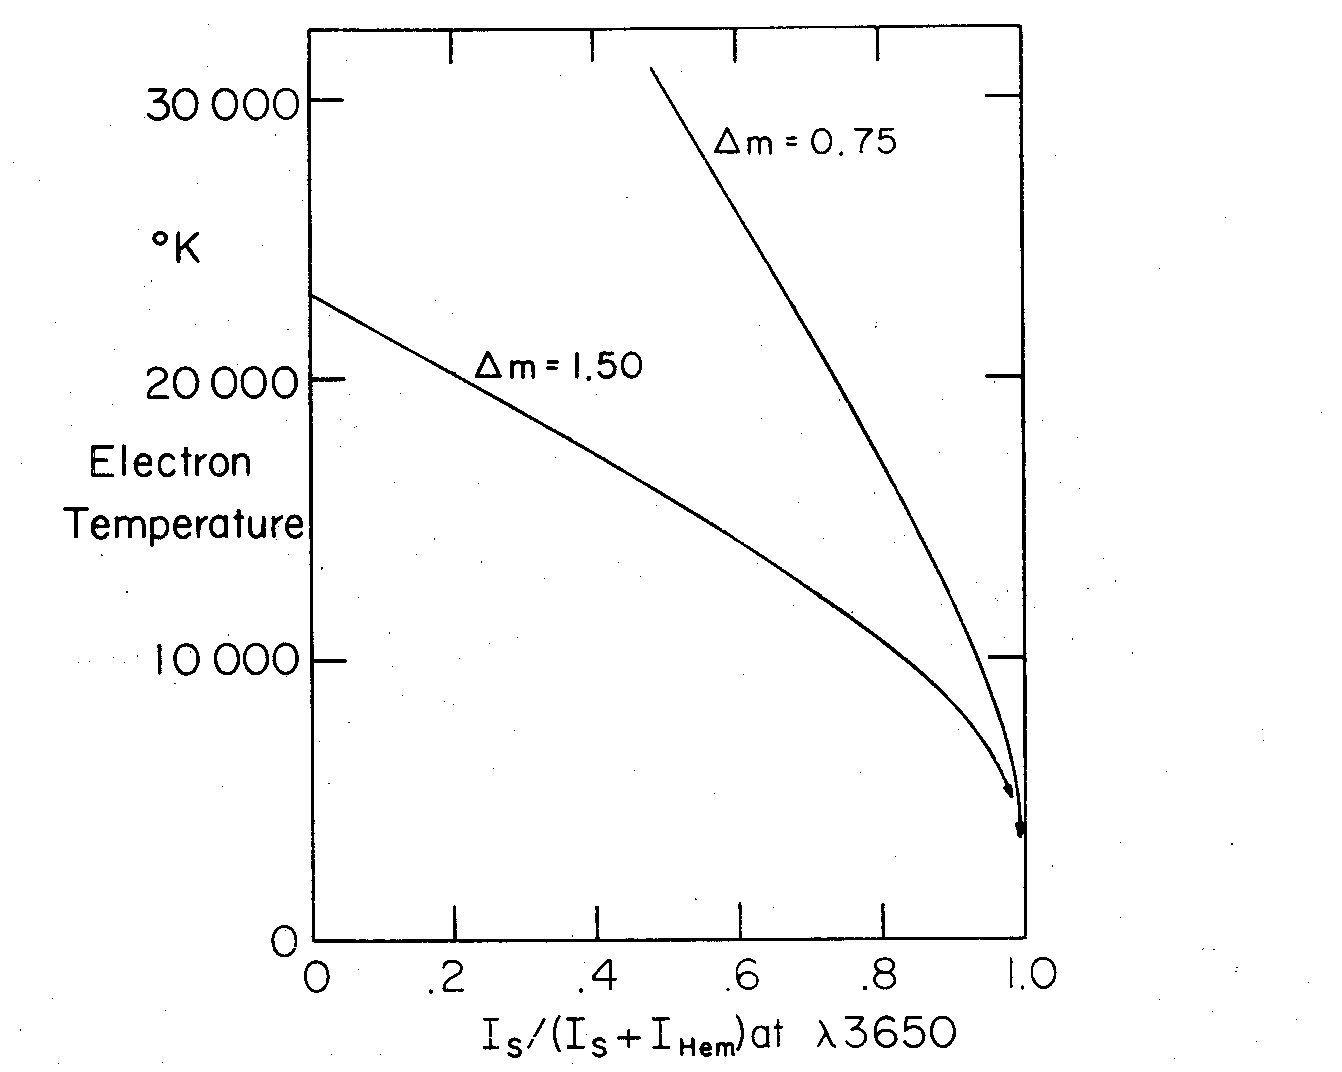 Fig. 6. Electron temperature versus the ratio of I_s to I_s + I_Hem at
lambda 3650 for Balmer discontinuities of Delta m = 0.75 and 1.50.
THE ULTRAVIOLET EXCESS
Figure 4 shows theoretical curves for the free-bound and free-free continuous
emission of hydrogen near the Balmer jump, in the case where the medium is
optically thick in the Lyman region of the spectrum (Menzel and Baker: Case B).
Figure 5 shows the hydrogen 2s -> 1s two-photon transition continuum; shown
are the wavelength dependence of the energy coefficient, gamma, for the density
N_e = 10^4 cm^-3, and the density dependence for the temperature
T_e = 10^4 deg K at three selected wavelengths. The formula for the two-photon
emission contains a factor, X, which varies from .32 to 1.0 depending on what
role 2s -> 2p collisions play in depopulating level 2s; X is assumed equal
to .32 in this paper.
Fig. 6. Electron temperature versus the ratio of I_s to I_s + I_Hem at
lambda 3650 for Balmer discontinuities of Delta m = 0.75 and 1.50.
THE ULTRAVIOLET EXCESS
Figure 4 shows theoretical curves for the free-bound and free-free continuous
emission of hydrogen near the Balmer jump, in the case where the medium is
optically thick in the Lyman region of the spectrum (Menzel and Baker: Case B).
Figure 5 shows the hydrogen 2s -> 1s two-photon transition continuum; shown
are the wavelength dependence of the energy coefficient, gamma, for the density
N_e = 10^4 cm^-3, and the density dependence for the temperature
T_e = 10^4 deg K at three selected wavelengths. The formula for the two-photon
emission contains a factor, X, which varies from .32 to 1.0 depending on what
role 2s -> 2p collisions play in depopulating level 2s; X is assumed equal
to .32 in this paper.
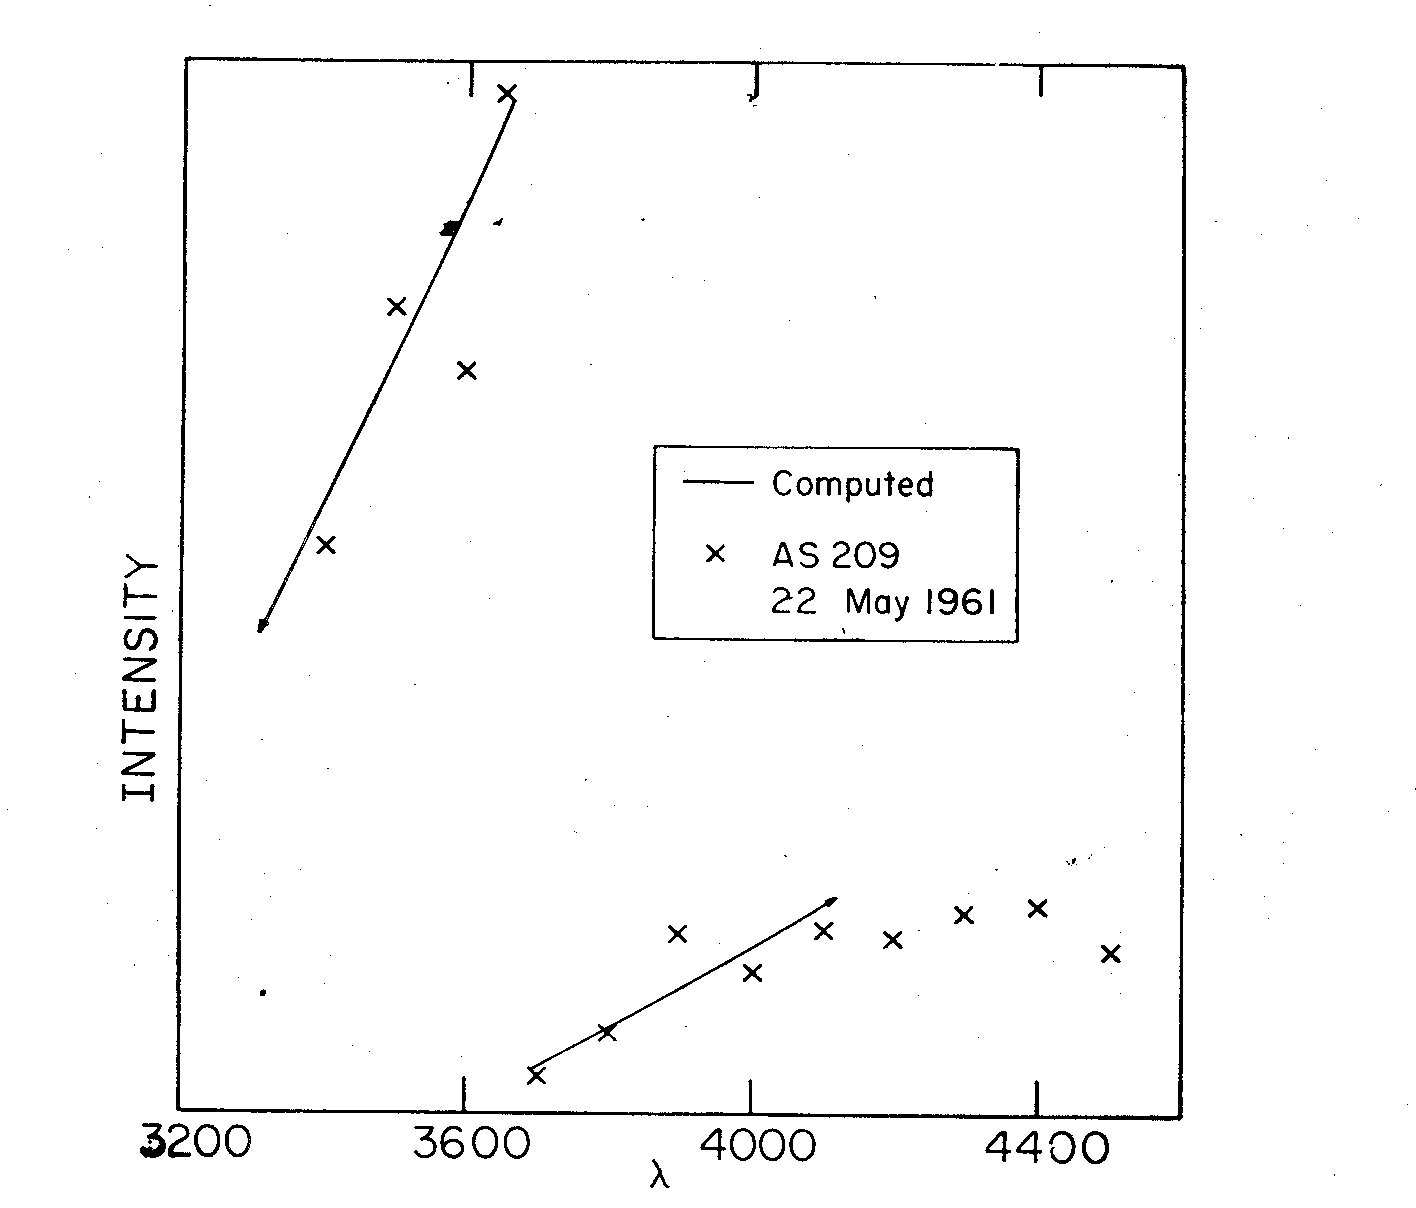 Fig. 7. Computed curve for an underlying star of 3500 deg K and an envelope of
7000 deg K. The ratio I_s to I_s + I_Hem = 0.94. The intensity is in
arbitrary units. The observed points were obtained from 16A/mm coudé
spectra of AS209.
Fig. 7. Computed curve for an underlying star of 3500 deg K and an envelope of
7000 deg K. The ratio I_s to I_s + I_Hem = 0.94. The intensity is in
arbitrary units. The observed points were obtained from 16A/mm coudé
spectra of AS209.
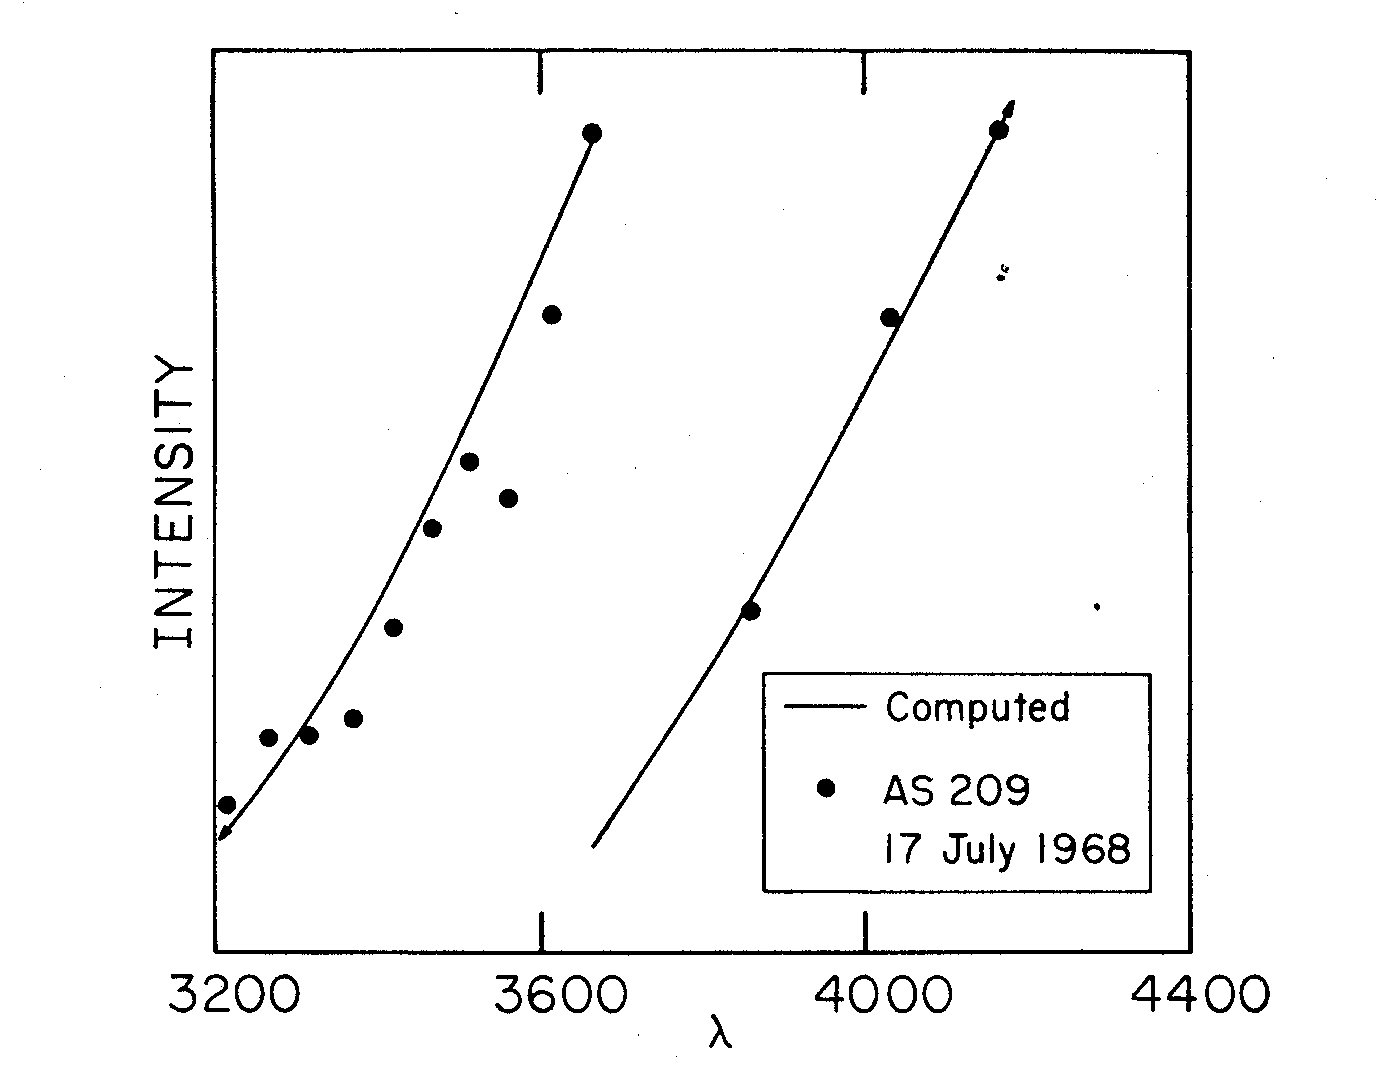 Fig. 8. Computed curve for an underlying star of 3500 deg K and an envelope of
10000 deg K. The ratio I_s to I_s + I_Hem = 0.94. The intensity units
are arbitrary. The observed points were obtained from photoelectric
spectral scans of AS209.
The difficulty with using the Balmer jump as an indication of the
temperature for stars is that one must know the jump relative to zero
intensity; if there is an underlying continuum of unknown intensity from
some other source, this relation is lost. Figure 6 shows the electron
temperature of the hydrogen emission (I_Hem) for two different Balmer
jumps as a function of the fraction of the contribution from other
sources (I_s) to the total intensity at lambda 3650.
Using this graph as a tool, and knowing the curves associated with
various black body temperatures, one can find a fairly unique fit to the
observed continua (figures 7 and 8). The temperature of the black body
which has the largest dI/d lambda at lambda 3650 is 3500 K; it is
found that this curve best fits the continuum just longward of lambda 3645.
Any other temperature, or the inclusion of two-photon emission, would result
in a slope less steep than that observed in this region. One may conclude
that the two-photon process plays no role, and hence the electron density
of the envelope must be greater than 5 X 10^5 cm^-3.
This research was supported by grant GP-6337 from the National Science
Foundation.
REFERENCES
Böhm, K. H., 1957, Z. Astrophys., 43, 245.
Gordon, I. M., 1957, Astr. Zu., 34, 739 (1957, Soviet Astr. 1, 719).
Gordon, I. M., 1958, Astr. Zu., 35, 458 (Soviet Astr. 2, 420).
Hayes, D., 1957, Dissertation, UCLA.
Kuhi, L. V., 1966, Publ. astr. Soc. Pacific, 78, 430.
Parker, R. A. R., 1964, Astrophys. J., 139, 208.
Seaton, M. J., 1955, Mon. Not. R. astr. Soc., 115, 279.
Seaton, M. J., 1960, Rep. Prog. Phys., 23, 313
Spitzer, L. and Greenstein, J. L., 1951, Astrophys. J., 114, 407.
Fig. 8. Computed curve for an underlying star of 3500 deg K and an envelope of
10000 deg K. The ratio I_s to I_s + I_Hem = 0.94. The intensity units
are arbitrary. The observed points were obtained from photoelectric
spectral scans of AS209.
The difficulty with using the Balmer jump as an indication of the
temperature for stars is that one must know the jump relative to zero
intensity; if there is an underlying continuum of unknown intensity from
some other source, this relation is lost. Figure 6 shows the electron
temperature of the hydrogen emission (I_Hem) for two different Balmer
jumps as a function of the fraction of the contribution from other
sources (I_s) to the total intensity at lambda 3650.
Using this graph as a tool, and knowing the curves associated with
various black body temperatures, one can find a fairly unique fit to the
observed continua (figures 7 and 8). The temperature of the black body
which has the largest dI/d lambda at lambda 3650 is 3500 K; it is
found that this curve best fits the continuum just longward of lambda 3645.
Any other temperature, or the inclusion of two-photon emission, would result
in a slope less steep than that observed in this region. One may conclude
that the two-photon process plays no role, and hence the electron density
of the envelope must be greater than 5 X 10^5 cm^-3.
This research was supported by grant GP-6337 from the National Science
Foundation.
REFERENCES
Böhm, K. H., 1957, Z. Astrophys., 43, 245.
Gordon, I. M., 1957, Astr. Zu., 34, 739 (1957, Soviet Astr. 1, 719).
Gordon, I. M., 1958, Astr. Zu., 35, 458 (Soviet Astr. 2, 420).
Hayes, D., 1957, Dissertation, UCLA.
Kuhi, L. V., 1966, Publ. astr. Soc. Pacific, 78, 430.
Parker, R. A. R., 1964, Astrophys. J., 139, 208.
Seaton, M. J., 1955, Mon. Not. R. astr. Soc., 115, 279.
Seaton, M. J., 1960, Rep. Prog. Phys., 23, 313
Spitzer, L. and Greenstein, J. L., 1951, Astrophys. J., 114, 407.