ABSTRACT Three colour photoelectric observations of the RR Lyrae variable TT Lyncis obtained at the Konkoly Observatory and Skalnate Pleso Observatory are discussed. The investigation shows a constant period of light changes and a stable light curve of the variable. A colour - colour diagram was constructed. For the distance of the variable 660 pc was obtained. 1. INTRODUCTION The variable TT Lyn is a relative bright RR Lyrae-type star. It was discovered by Hoffmeister /1949/. It was scarcely observed and very insufficiently studied. The first time the star was investigated by Tsesevich /1956/ and later on photographically and also visually by Ahnert /1959, 1960/ who found 0.597416d for the period. The light curves, both visual and photographic published by Ahnert /1959/ show an unusually great dispersion of individual observations which is evidently caused by the applied observational methods. There are only few photoelectric observations obtained by Jones /1966/ and by Sturch /1966/. The present study is based mainly on the photoelectric observations obtained at Konkoly Observatory in Budapest and at Skalnate Pleso Observatory. Spectral classification on the basis of objective prism spectra was made by Alania /1967, 1969/ from the intensities of absorption hydrogen and ionized calcium lines. He determined Preston's quantity Delta S which changed from the value Delta S = 7 in maximum to Delta S = 12 during the minimum light. The spectral type changes from F0 in maximum light to F8 in minimum light according to classification of the hydrogen lines. The radial velocity curve was obtained by Woolley and Aly /1966/ who found that the radial velocity relative to the Sun rho_0 = -62.7+-3.4 km/sec and the amplitude of radial velocity changes by Delta V_r = 60.9+-10.9 km/sec during the period of light variation. 2. OBSERVATIONAL MATERIAL AND REDUCTION In this paper mainly results of the interpretation of the observing material obtained at Konkoly Observatory Budapest and at Skalnate Pleso Observatory are presented. Photoelectric observations in Budapest were obtained at the 24-inch f/6 reflector with a photoelectric photometer equipped with colour filters for the UBV photometry. Variable TT Lyn was observed photographically at Skalnate Pleso Observatory in the years 1959 - 1961 and photoelectrically from 1961 onwards at the 24-inch f/5.5 reflector. The photographic observations were obtained on Agfa Astro-panchromatisch plates without colour filter by the method of multiple exposures. Twenty three plates yielded 395 exposures of sufficient quality for further investigation. The greatest part of the observations was obtained at the same telescope equipped with a photoelectric photometer. A short description of the photometer together with the method of observation and reduction was given in a previous paper Tremko /1964/. A detailed description of the photometer will be published later. In the period from 1961 until 1964 altogether 3692 photoelectric observations were obtained in yellow colour; 267 of them of insufficient accuracy were excluded from the treatment. The corrections for differential extinction were not applied since the angular distance between comparison star and the variable is small. The set of yellow observations was supplied with observations in blue and ultraviolet colour in the period 1966 - 1967. The last mentioned observations were used for the construction of light curves in three colours. The observations obtained in the instrumental ubv system were converted into the standard UBV system. THE PERIOD AND THE LIGHT CURVE The period due to the small extent of observations was earlier computed only with low accuracy. Thus the value published by Ahnert /1959/ is accurate only to five decimals. In the third edition of the General Catalogue of Variable Stars /Kukarkin et al. 1969/ the period was given with higher accuracy, but our computations have shown that even this period must be corrected. The great number of our observations gives us the possibility to study the stability or eventual changes of the period. As the accuracy of the visual observations is not sufficient, we decided to use for the computation of the period well defined photoelectric epochs of maxima only. The early photographic and mainly visual epochs of maxima deviate from the elements: Max_hel = J. D. 2436651.3570 + 0.59743398d. E obtained by us. These deviations could hardly be explained by a change of the period before J. D. 2436000. We may suppose that this difference is caused by the inaccuracy of the visual epochs before that date. The list of epochs of maxima together with O - C values and further informations are collected in Table I. The O - C diagram for the maxima from Table I. is on Fig. 1. As the scale on Fig. 1. is too small for the epochs determined photoelectrically, an O - C diagram with a greater scale was constructed for these maxima in Fig. 2. O - C differences for the epochs of maxima and also for the ascending branch at V = 9.936m were tested for Blazko effect. The phase shifts of the ascending branch amount to 0.0005d at most. As the mean error of observations on the ascending branch is +- 0.0008d, the observed oscillations are inside the limits of observational errors. Table I. Max. hel. E O-C Observer Note J.D.2430000+ 5599,33 - 1761 + 0,05 Tsesevich v 5601,25 - 1758 + 0,18 -"- v 5608,31 - 1746 + 0,07 -"- v 5722,50 - 1555 + 0,15 -"- v 5747,54 - 1513 + 0,10 -"- v 5753,45 - 1503 + 0,04 -"- v 6229,60 - 706 + 0,03 Ahnert pg 6232,58 - 701 + 0,02 -"- pg 6274,40 - 631 + 0,02 -"- pg 6287,53 - 609 + 0,01 -"- pg 6609,5275 - 70 - 0,0091 Tremko pg 6611,32 - 67 - 0,01 Ahnert v 6611,3307 - 67 + 0,0018 Tremko pg 6626,30 - 42 + 0,04 Ahnert v 6630,44 - 35 - 0,01 -"- v 6651,3586 0 + 0,0016 Detre pe 6663,32 + 20 + 0,01 Ahnert v 6679,4361 + 47 - 0,0003 Detre pe 6961,4210 + 519 - 0,0042 Tremko pg 7016,404 + 611 + 0,015 Ahnert v 7017,567 + 613 - 0,017 -"- v 7026,553 + 628 + 0,007 -"- v 7028,353 + 631 + 0,017 -"- v 7321,6797 + 1122 + 0,0018 Tremko pe 7327,6496 + 1132 - 0,0027 -"- pe 7669,3825 + 1704 - 0,0020 -"- pe 7673,5664 + 1711 - 0,0001 -"- pe 7696,2665 + 1749 - 0,0025 -"- pe 8378,5371 + 2891 - 0,0015 -"- pe 8381,5247 + 2896 - 0,0011 -"- pe 8400,6420 + 2928 - 0,0017 -"- pe 8406,6188 + 2938 + 0,0008 -"- pe 8408,4113 + 2941 + 0,0010 -"- pe 8414,3861 + 2951 + 0,0014 -"- pe 8415,5800 + 2953 + 0,0005 -"- pe 8418,5668 + 2958 + 0,0001 -"- pe 8458,5951 + 3025 + 0,0003 pe For the construction of the composed UBV light curves only the photoelectric observations obtained at the Skalnate Pleso Observatory were used. The V light curve is on Fig. 3. Dots represent the mean four observations, circles the mean of two observations. Fig. 4. and 5. represent individual B and U observations, respectively. Slight changes of the heights of maxima and brightness of minima were observed within some few hundredths of magnitude. The photoelectric observations show also slight changes in the form of the ascending branch and of the hump, but no periodicity resembling a Blazko effect was found. The variable TT Lyn has in maximum light the brightness 9.476m and in minimum light 10.161m in V, in excellent agreement with data obtained recently by Jones /1966/. The value of M - m derived from the mean yellow light curve is 0.180P, and the hump is placed at phase 0.95. The light curve is smooth on the descending branch. The colours at maximum and minimum light are as follow: U - B B - V maximum + 0.167m + 0.256m minimum + 0.039m + 0.424m COLOUR - COLOUR DIAGRAM AND THE DISTANCE OF THE VARIABLE On the basis of three-colour observations obtained at the Skalnate Pleso Observatory a colour - colour diagram of the variable was constructed. For its construction the data from Tab. II. were used. The shape of the obtained colour - colour diagram /Fig. 6/ is typical for this type of variables. Only the U - B value for the phase 0.2 should be higher by a few hundredths. The numbers at the different points of the curve on Fig. 6 denote the phases of the light changes. The photometric data give us the possibility to determine the distance of the variable if the absolute magnitude is known. The absolute magnitude can be derived from the period - absolute magnitude relation /Woolley et al. 1965/. M_v = 0.0m - 2.5m log P /1 / Table II. Phase U - B B - V 0,00 + 0,167 + 0,256 0,10 + 0,154 + 0,279 0,20 + 0,098 + 0,317 0,30 + 0,146 + 0,397 0,40 + 0,052 + 0,423 0,50 + 0,036 + 0,445 0,60 + 0,006 + 0,450 0,70 + 0,030 + 0,413 0,80 + 0,038 + 0,414 0,90 + 0,002 + 0,391 0,91 + 0,039 + 0,355 0,98 + 0,140 + 0,287 From this relation we obtain the following value for the absolute median magnitude : M_v = 0.56m. The distance of the variable can be computed from the well known relation: M_v = m_v + 5 - 5 log r - A_v /2/ The visual interstellar absorption can be determined from reddening. It is assumed that stars which are more than 100 pc above the galactic plane and have great galactic latitude b are reddened by 0.05 cosec b /Woolley et. al. 1965/. Thus the reddening for TT Lyn should be 0.075m and the total visual absorption A_v= 0.226m. We can compute the visual absorption also from the relation which was derived from the study of high latitude RR Lyrae type variable stars /Woolley et. al. 1965/: A_v = 3 [ /B/ - /V/ - 0.24] /3/ As the mean B - V value is + 0.381m for TT Lyn, the visual absorption should be 0.423m. We prefer the determination of the interstellar absorption by the first mentioned method, as TT Lyn can have an intrinsic colour which differs from the mean value + 0.24 for high galactic latitude RR Lyrae type variables. By assuming that the median visual magnitude of TT Lyn is 9.890m, we obtain for the distance the value r = 660 pc. CONCLUSION TT Lyn is a variable star of RRab type with constant period and stable light curve. Blazko effect is not present. The star belongs to the group of RR Lyrae type stars with high Delta S. Such stars are of low metal abundance, they are relatively old and have large motion relative to the Sun. For TT Lyn no proper motion data are available. On the basis of the period - luminosity relation the absolute magnitude of TT Lyn was determined and after applying the correction for the interstellar absorption a distance of r = 660 pc was derived. I would express my thanks to Prof. Dr. L. Detre for giving at my disposal the observational material of TT Lyn obtained at the Konkoly Observatory and for many advices and stimulating discussions. I thank members of the staff of the Skalnate Pleso Observatory, especially J. Petras and L. Petrik, for their help in the observations. REFERENCES Ahnert, P. 1959, MVS, Nr. 422. Ahnert, P. 1960, MVS, Nr. 518. Alania, I. F. 1967, AC, 443, 3. Alania, I. F. 1969, Bull. Abast. Astrophys. Obs., 37, 39. Jones, D.H.P. 1966, Roy. Obs. Bull., E 112, 241. Hoffmeister, C. 1949, Erg. An, 12, 1.22. Kukarkin, B. V., Kholopov, P. N., Efremov, Y. N., Kukarkina, N. P., Kurochkin, N. E., Medvedeva, G. I., Perova, N. R., Fedorovich, V. P., Frolov, M. S., General Catalogue of Variable Stars, 3rd Edition, Moscow Astronomical Council of U.S.S.R. Academy of Sciences. Sturch, C. 1966, Ap. J., 143, 774. Tremko, J. 1964, Mitt. Sternw. Budapest, Nr. 55. CoKon 55 Tsesevich, V.P. 1956, AC, 174, 16. Woolley Sir, R., Harding, G. A. Gassells, A. I., Saunders, J., 1965, Roy. Obs. Bull., E 97, 3. Woolley Sir, R., Aly Kh., 1966, Roy. Obs. Bull., E 114, 259.
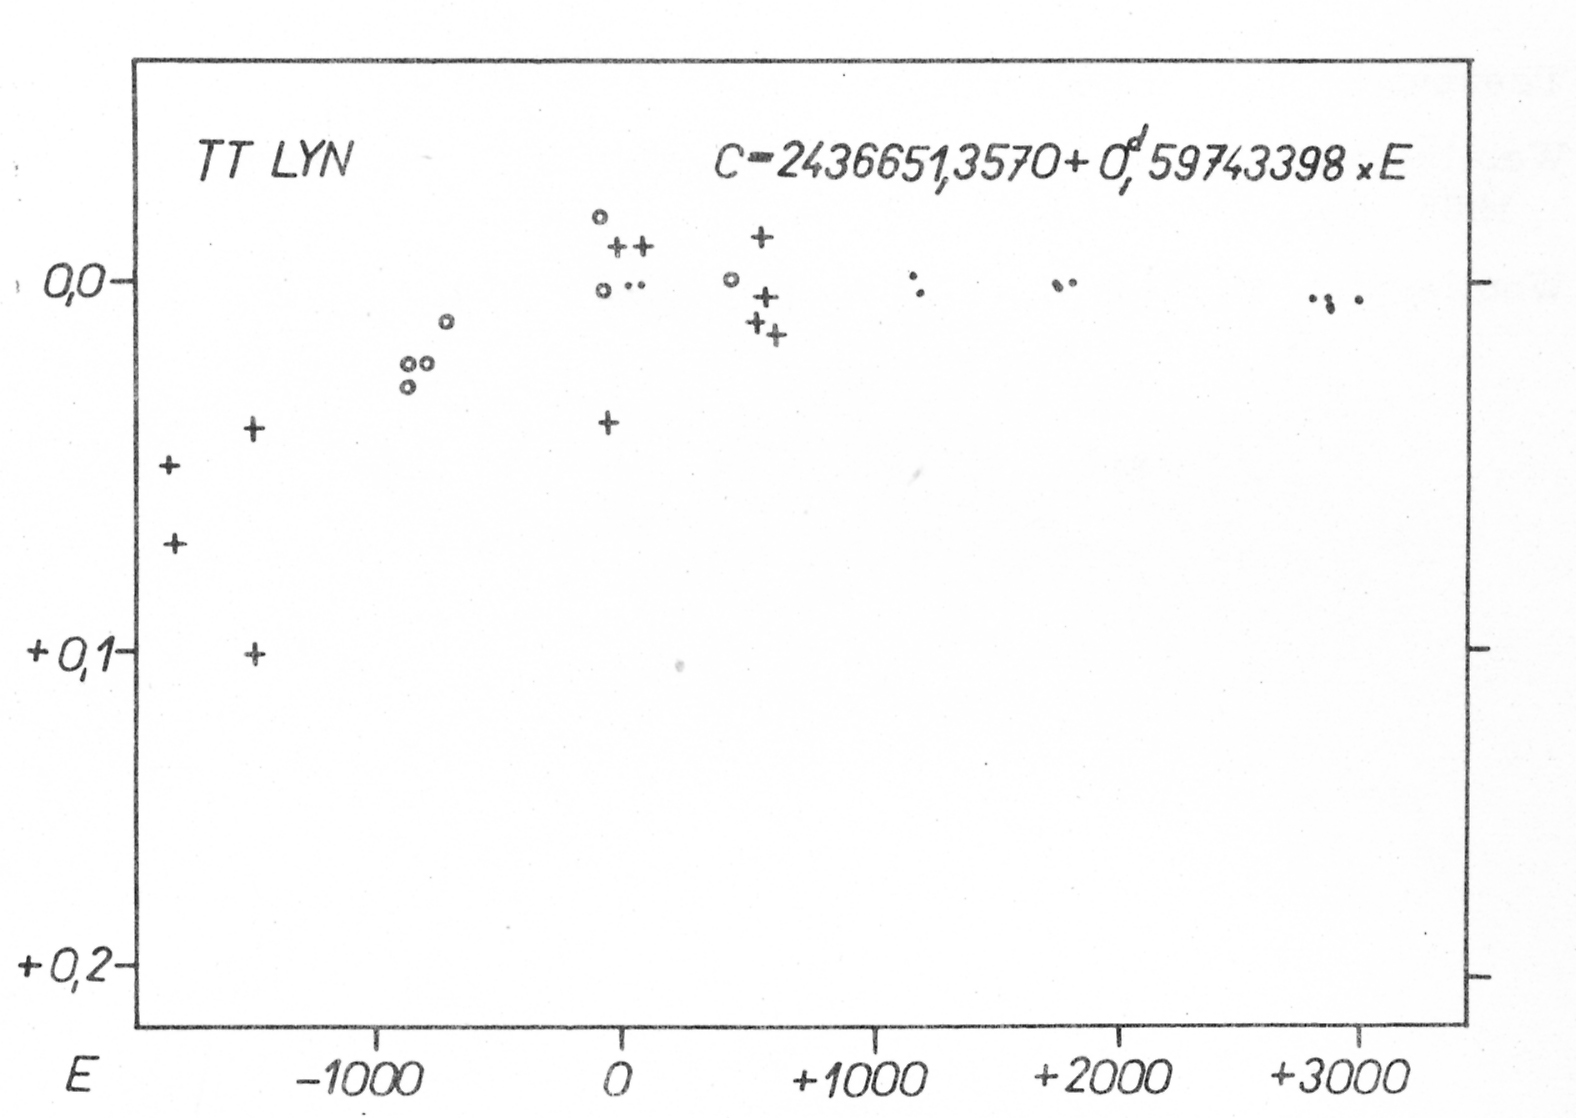 Fig. 1. O - C diagram for all epochs of maxima; crosses denote
visual epochs, circles photographic epochs and full dots
photoelectric epochs.
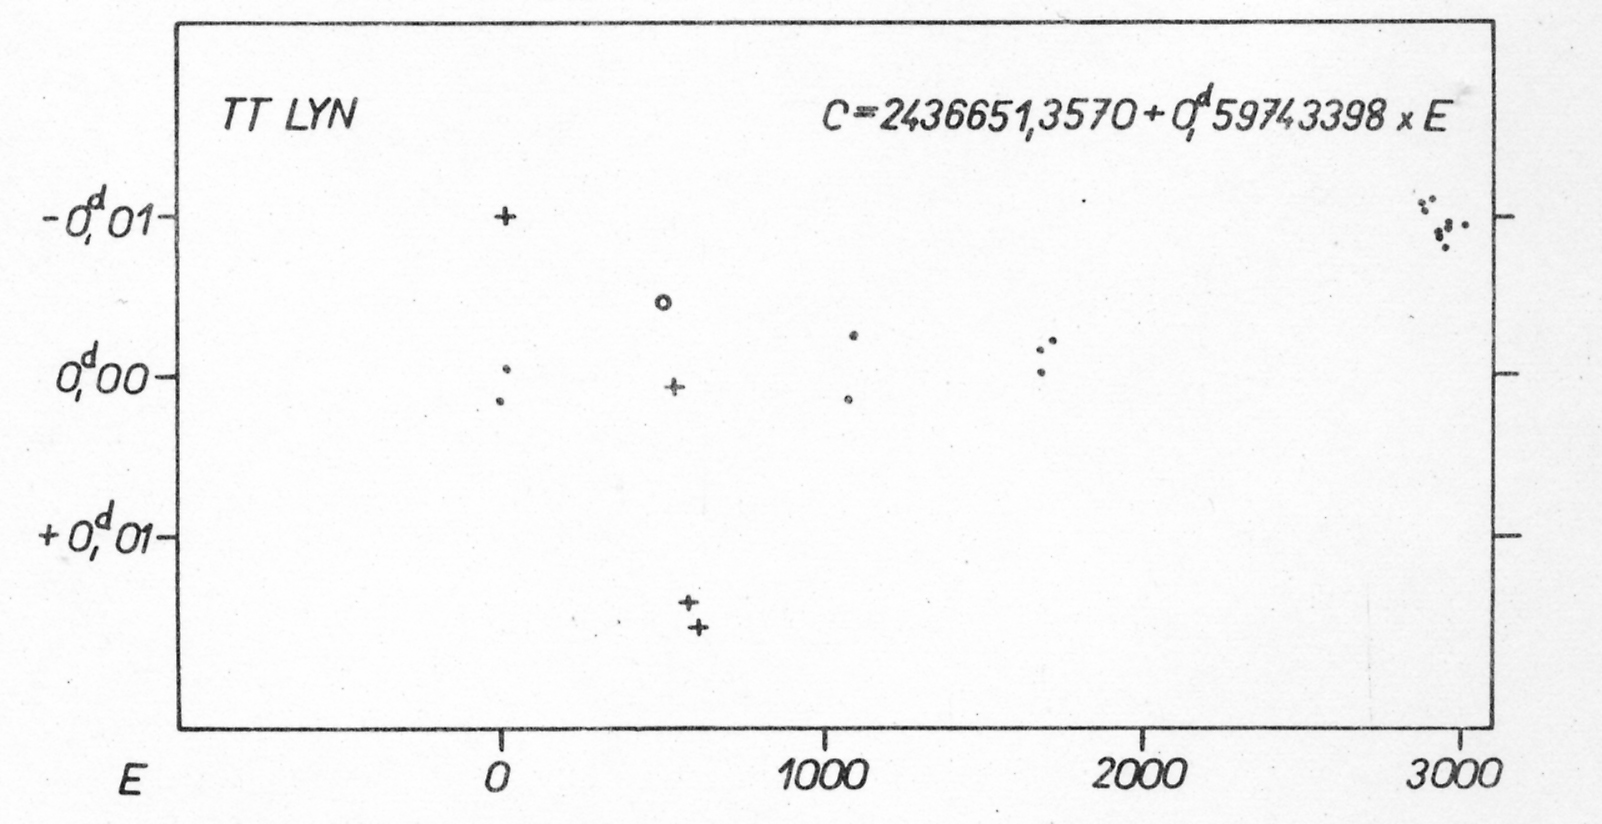 Fig. 2. O - C diagram for the epochs with E>O; crosses denote
visual epochs, circles photographic epochs and full dots
photoelectric epochs.
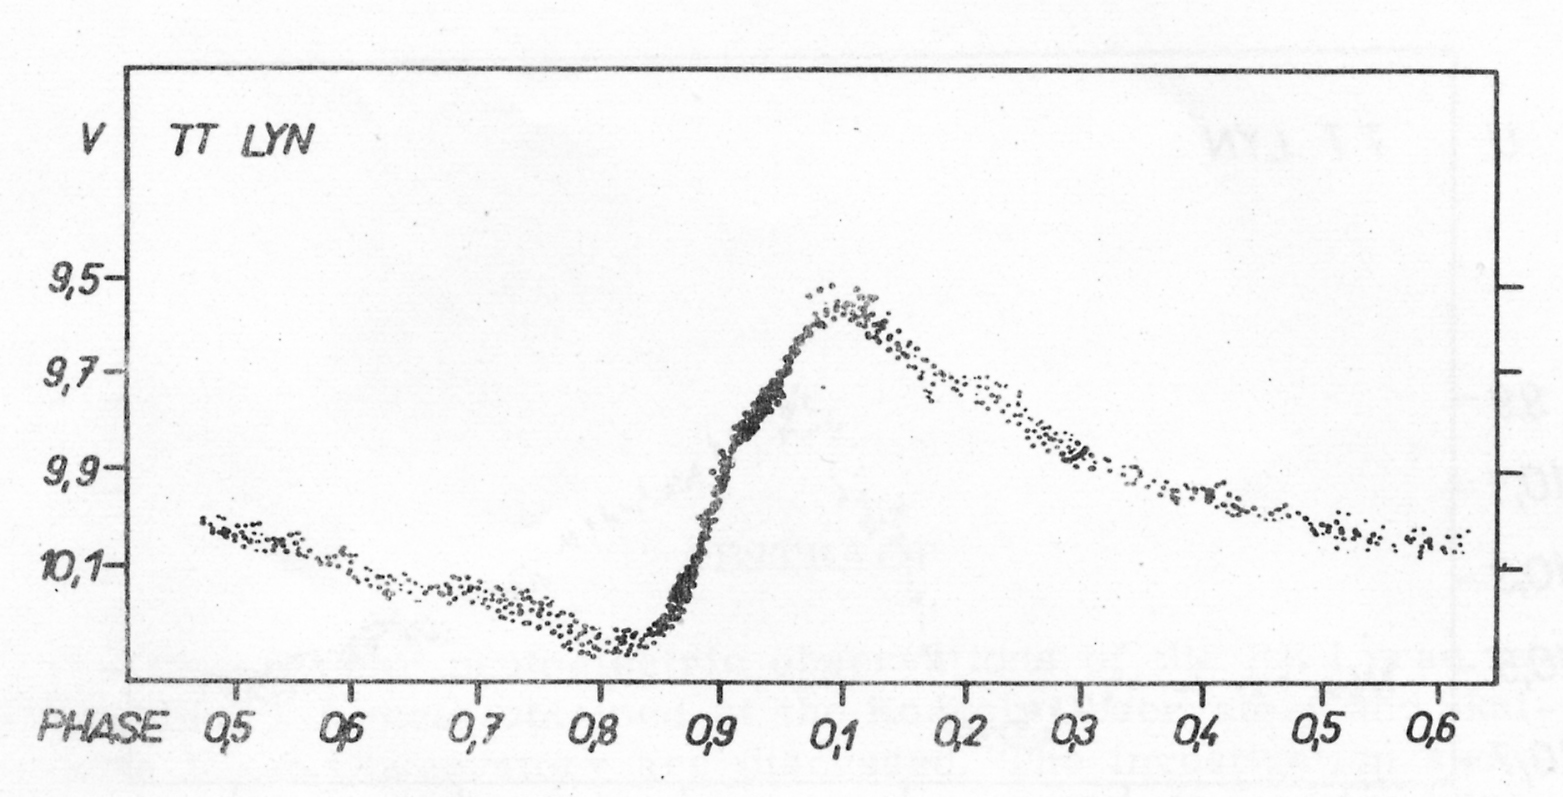 Fig. 3. V photoelectric light curve of TT Lyn. Full dots represent
four observations, open circles two observations.
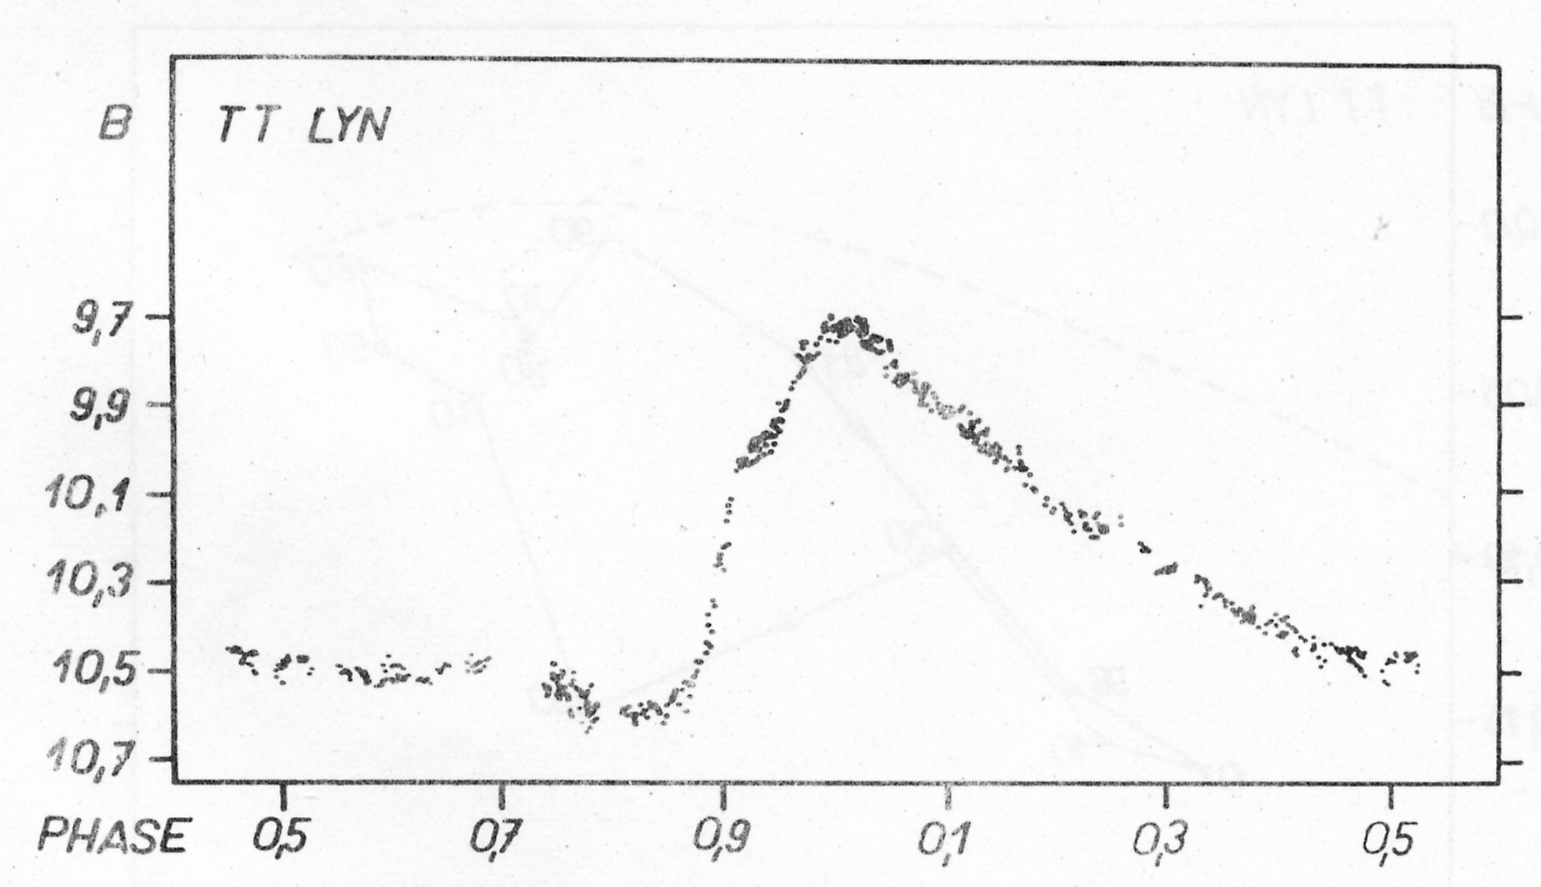 Fig. 4. B photoelectric light curve of TT Lyn.
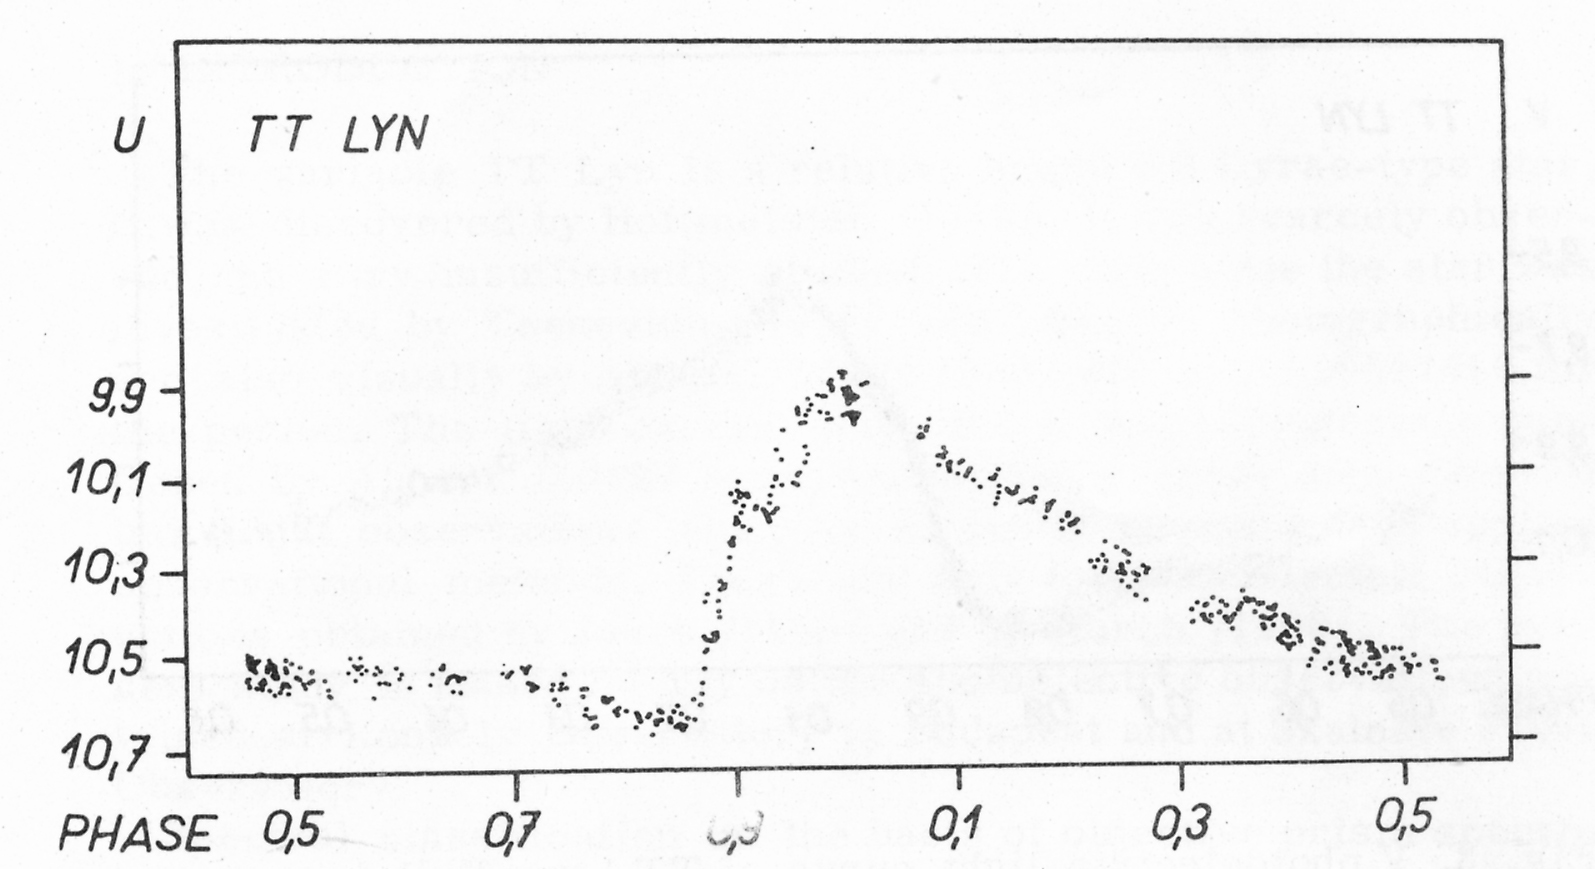 Fig. 5. U photoelectric light curve of TT Lyn.
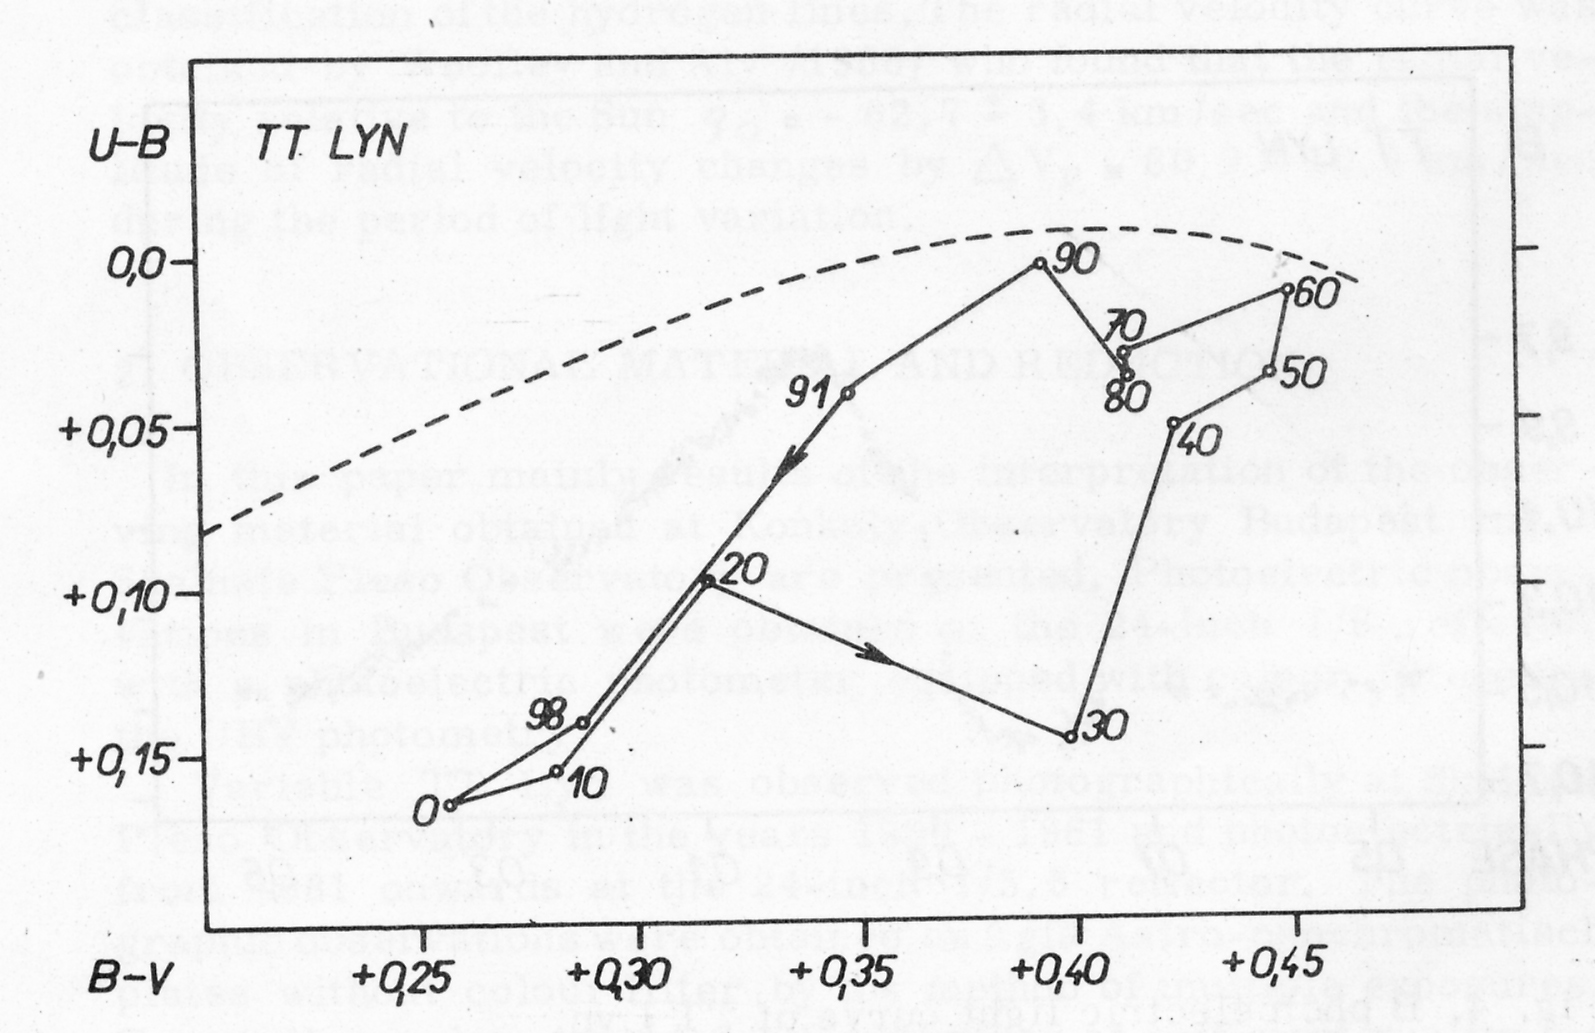 Fig. 6. Colour - colour diagram of TT Lyn. The numbers at the
curve denote the phase.