ABSTRACT Three colour photoelectric observations of the variable W CVn obtained at Konkoly Observatory and at Skalnaté Pleso Observatory were interpreted. The investigation shows secular change of the period and a stable light curve. The interstellar absorption in the direction of the variable is discussed and the absolute magnitude from the period - luminosity relation was derived. Colour - colour diagram was constructed and distance of 980 pc for the variable was determined. INTRODUCTION The variable star W CVn belongs to the group of short period RRab Lyrae-type variables. It was discovered by Ceraski in 1907 on plates made by Blazko /Ceraski 1907/. Later was investigated by Zinner /1912, 1916/, who discovered an increase in brightness near the minimum light. She discovered similar increasing in brightness on the ascending branch and at the phase 0.47P. The last however changed its place in various cycles. Bugoslawski /1927/ discovered secondary oscillations on the light curve which recurred with a period of 0.16057 days. The period of secondary oscillations was not constant but changed during a cycle of 43.53 days. Photographic observations obtained by Jordan /1929/ and Robinson /1930/ did not confirm Bugoslawski's conclusions on periodic secondary oscillations. The light curves derived by both authors show a conspicuous wave close to the minimum. Similarly Parenago /1930/ found light curve to be smooth but the brightening before minimum escaped his attention. In the years 1931 - 1933 Detre /1934/ observed the variable by a Graff wedge photometer and collected 369 observations. According to his observations the light curve was smooth and the amplitude of the wave close to minimum was only 0.02m which differed from the value 0.12m previously found by Jordan /1929/. Later the star was observed visually or photographically by several observers /Radlova 1934/, /Kleissen 1938/, /Nachapkin 1940/, /Alania 1954/, /Strelkova 1960/, /Ahnert 1961/, /Satanova 1961/. Photoelectric observations are scarce with exception of those obtained at Konkoly Observatory and Skalnaté Pleso Observatory. Geyer /1961/ obtained UBV photoelectric observations in the range of the phase 0.8P - 0.1P and determined some photometric parameters of the variable. Sturch /1966/ obtained few UBV photoelectric observations for the program of colour indices of RR Lyrae-type stars near minimum light. The latest photoelectric observations are those obtained by Fitch et al. /1966/. Radial velocity was measured by Joy /1938/ who found a mean value of RV = + 26 km/sec. The spectrum of the variable is changing from A6 to F6 and Preston's quantity Delta S reaches a value of 7 /Woolley et al. 1965/. OBSERVATIONAL MATERIAL AND REDUCTION The variable was observed photographically at Konkoly Observatory in Budapest with 16-inch astrograph by the method of multiple exposures. Together 288 observations were obtained on the emulsion "Guilleminot superfulgur". No colour filter was used in the observations. The photographic material was measured and reduced by a method widely used also at other observatories. The brightnesses of the comparison stars were determined by the comparison with those from North Polar Sequence. The list of the photographic plates together with further data are given in Table I. Table I. J. D. Date Plate N 2429373 20. Apr 1939 H 1106 43 2429401 17. May 1939 H 1147 25 2429401 17. May 1939 H 1148 40 2429401 17/18. May 1939 H 1149 30 2429425 10. June 1939 H 1164 8 2429456 11/12. July 1939 H 1182 60 2429461 16. July 1939 H 1187 27 2433453 20. June 1950 H 2124 25 2434457 21. March 1953 H 2639 30 On the basis of the photographic observations obtained at Konkoly Observatory four epochs of maxima were derived. They are included in the Table II. The variable starting from 1959 was intensively observed photoelectrically at Konkoly Observatory and at Skalnaté Pleso Observatory. Photoelectric observations in Budapest were obtained at 24-inch, f/6 reflector with a photoelectric photometer equipped with 1 P 21 photomultiplier and colour filters for the photometry in B and V region. Photoelectric observations of the variable at Skalnaté Pleso Observatory were obtained in two observational seasons in the years 1963 and 1964 with a photoelectric photometer attached at 24-inch, f/5.5 reflector. The optical part of the photometer is equipped with quart Fabry lens which images the entrance pupil of the telescope into a form of disc of 4.3 mm in diameter on the photocathode of 1 P 21 photomultiplier. The photomultiplier was supplied from high voltage stabilizer NBZ 411 type and an electronic recorder EZ 4 type was used. The detailed description of the photometer will be done in forthcoming paper. The set of yellow observations obtained in the years 1963 - 1964 was supplied with the observations in B and U colours in the years 1967 and 1968. The standard filters for the UBV photometry were used. The observations obtained in the instrumental ubv system were converted into the standard UBV system. THE PERIOD AND THE LIGHT CURVE The long series of the observations over 40000 periods made possible the study of secular changes of the period. In our study we used the epochs of the maxima published by Detre /1934/ and mainly observations obtained by Detre and Tremko /this paper/. From Detre's list /Detre 1934/ we omitted two epochs derived by Jordan and we computed from Jordan's observations new epochs of maxima. We omitted from newer observations the epoch of the maximum derived by Strelkova /1960/, as it shows a very great residual from the calculated epoch. Probably there is a printing error in the original paper. It is remarkable that the elements published by Prager /1930/ include parabolic term for the secular change of the period: Max_phg = J.D. 2421077.977 + 0.5517622xE - 0.468 10^-9xE^2 /1/ Later Detre /1934/ derived following elements: Max_hel = J.D. 2421402.4206 + 0.55175981xE /2/ The last computation is that provided by Tsesevich /1966/: Max_hel = J.D. 2421077.9868 + 0.551758775xE /3/ It is noteworthy the deviation of - 0.008d of the photoelectric epoch of maximum obtained by Geyer /1961/ from the elements /3/. Our computations give following elements: Max_hel = J.D. 2421402.4270 + 0.55175834xE /4/ From the O - C values which are presented in the Table II. and also from the Fig. 1. it is clearly seen that the period is not constant. We did not compute the numerical value of the secular change as it is not clear whether the observed shortening is continuous or not. The latest observed epoch of the maximum /Fitch et al. 1966/ confirms our results about secular change of the period and it is shown that the statement put by Tsesevich /1966/ is not valid. Table II. Max. hel. E O - C Observer Notes J.D. 2400000+ 15804.828 - 10145 - 0.011 Payne-Gaposchkin pg 20251.450 - 2086 - 0.009 Zinner v 21077.980 - 588 - 0.013 Robinson pg 21402.427 0 000 Blazko v 22081.6350 + 1231 - 0.0065 Jordan pg 22839.7576 + 2605 + 0.0002 Jordan pg 24621.380 + 5834 - 0.005 Parenago pg 26477.504 + 9198 + 0.004 Detre phm 26483.575 + 9209 + 0.005 Detre phm 26488.542 + 9218 + 0.007 Detre phm 26509.508 + 9256 + 0.006 Detre phm 26520.545 + 9276 + 0.008 Detre phm 26540.406 + 9312 + 0.006 Detre phm 26556.407 + 9341 + 0.005 Detre phm 26908.437 + 9979 + 0.013 Detre phm 27260.457 + 10617 + 0.012 Detre phm 27281.426 + 10655 + 0.014 Detre phm 27311.200 + 10709 - 0.007 Radlova v 27543.4939 + 11130 - 0.0034 Kleissen pg Table II cont. Max. hel. E O - C Observer Notes J.D.2400000+ 27558.390 + 11157 - 0.005 Soloviev v 27628.468 + 11284 0.000 Soloviev v 27927.516 + 11826 - 0.005 Soloviev v 27955.663 + 11877 + 0.002 Soloviev v 28305.4779 + 12511 + 0.0023 Kleissen pg 29360.431 + 14423 - 0.007 Nachapkin v 29456.447 + 14597 + 0.003 Tremko pg 29461.422 + 14606 + 0.013 Tremko pg 33453.391 + 21841 + 0.010 Tremko pg 34130.377 + 23068 - 0.011 Alania pg 34457.580 + 23661 - 0.001 Tremko pg 35244.3875 + 25087 - 0.0010 Detre pe 35601.394 + 25734 + 0.018 Geyer pg 36232.5813 + 26878 - 0.0024 Geyer pe 36305.4155 + 27010 - 0.0053 Detre pe 36343.4895 + 27079 - 0.0016 Detre pe 36348.4570 + 27088 + 0.0001 Detre pe 36573.5685 + 27496 - 0.0058 Detre pe 36574.6705 + 27498 - 0.0073 Detre pe 36648.6094 + 27632 - 0.0004 Detre pe 36877.601 + 28047 - 0.008 Satanova pg 37025.458 + 28315 - 0.006 Ahnert v 38085.3844 + 30236 - 0.0078 Tremko pe 38448.4414 + 30894 - 0.0078 Tremko pe 38450.6447 + 30898 - 0.0115 Tremko pe 38464.4427 + 30923 - 0.0074 Tremko pe 38497.5455 + 30983 - 0.0101 Tremko pe 38789.977 + 31513 - 0.011 Fitch pe The period for the interval J.D. 2436305 - J.D. 2438497 was derived from the photoelectric epochs of the mean light, obtained by Detre and Tremko /this paper/: Mean light_hel = J.D. 2436305.3669 + 0.55175735xE /5/ The value of the period is lower as given by the equation /4/. The epochs of the mean light on the ascending branch were tested for Blazko effect. The oscillation of the ascending branch is very small and lies within the limits of the observational errors. The heights of the maxima, the depths of the minima and the heights of the hump at the ascending branch also do not show substantial variation. The presence or the absence of the brightening short before minimum in the observations of the different observers can be partly explained by the fact that the range of the brightening depends on wavelength. The other cause can be longer exposures of some photographic observations. The list of the epochs of the maxima, O - C differences and further data are collected in the Table II. The photoelectric epochs of the mean light which were used for the computation of the elements /5/ are in the Table III. and corresponding O - C differences are plotted on the Fig. 2. The photoelectric observations obtained at the Skalnaté Pleso Observatory were used for the construction of the U, B, V, light curves. The variable W CVn reaches in the V region the maximum brightness 10.065m and in the minimum light 10.921m. Thus the amplitude of the light changes is 0.856m which is in good agreement with the value derived from the photoelectric observations obtained by Detre in Budapest. M - m value derived from the V light curve is 0.153m and the hump at the ascending branch is placed at the phase 0.93P. The hump on the descending branch is located at the phase 0.704P and it is the most conspicuous in the B colour. Table III. Mean light. hel. E O - C Observer Notes J. D. 2430000 + 6305.3657 0 - 0.0012 Detre pe 6348.4012 78 - 0.0028 Detre pe 6574.6278 488 + 0.0033 Detre pe 6648.5609 622 + 0.0009 Detre pe 8085.3366 3226 + 0.0005 Tremko pe 8448.3925 3884 + 0.0001 Tremko pe 8450.5987 3888 - 0.0008 Tremko pe 8497.4985 3973 - 0.0004 Tremko pe The colours in the maximum and in the minimum light are as follows: U - B B - V maximum + 0.071 + 0.217 minimum + 0.070 + 0.431 The U - B and B - V data for the minimum light differ only by 0.001 from those published by Sturch /1966/. The our observations confirm the supposition raised by Sturch /1966/ about the bluishing of the RR Lyrae-type variables with the P > 0.5d around the phase 0.7P. The U, B, V light curves are on the Figures 3, 4 and 5. COLOUR - COLOUR DIAGRAM Three colour observations of the variable make possible to construct U - B/B - V diagram. For the construction of the two colour diagram the data from the Table IV. were used. Two co- lour diagram for the variable W CVn is rather complicated mainly owing to the bluer colour around the phase 0.70P. The numbers at the different points of the two colour diagram on Fig. 6. denote the phase of the light changes. From the absolute magnitude and from the photometric data we can determine the distance of the variable if the interstellar absorption is known. The absolute magnitude can be derived on the basis of the period - absolute magnitude relation for the RR Lyrae-type variable with a period greater than 0.45 days /Woolley et al. 1965/: M = - 0.10m - 2.5 log P /6/ The distance r then can be derived from the well known equa- tion: M_v = m_v + 5 - 5 log r - A_v /7/ The value A_v can be computed from the reddening. According to Woolley et al. /1965/ the stars with z coordinate higher as 100 parsecs above the galactic plane and in higher galactic latitudes are reddened by 0.05 x cosec b. The investigation performed by Sturch /1966/ has shown that the value for the reddening term for the stars with b > 56 deg is 0.02 x cosec b only, if the excessively reddened regions in Taurus and Ophiuchus are omitted but the stars with b > 70 deg are kept. Thus the reddening for the variable is very low and reaches 0.034m and then the total visual absorption A_v = 0.103m if we accept the numerical value 3.03 for the ratio of total to selective absorption /Wickramasinghe N. C. 1967/. The ratio of total to selective absorption depends on the position of the star in the Galaxy relative to the Sun and can reach considerable higher value. Thus the derived total absorption can be considered as the lowest value. Woolley et al. /1965/ on the basis of the study of high galactic latitude RR Lyrae-type variables derived following relation for the determination of the visual absorption: A_v = 3 [/B/ - /V/ - 0.24] /8/ The mean B - V value for W CVn is 0.374m and according to relation /8/ the visual absorption reaches 0.402m. Geyer /1961/ has found that W CVn is reddened by 0.08m which leads to the visual absorption of 0.244m. The determination of the absorption according to the method derived by Woolley et al. /1965/ is very sensitive to the intrinsic colour of the variable. The last term in the equation /8/ seems to be underestimated and the scatter in the B - V and mainly in U - B shows /Sturch 1966/ that even this high latitude sample of RR Lyrae-type variables is in this sense inhomogeneous. For these reasons we prefer the value of the visual absorption derived by the first method. As the median visual brightness V = 10.606m and the absolute visual magnitude computed from the equation /6/ M_v = + 0.54m, the resulting distance of the variable derived with the aid of the equation /7/ is 980 pc. Table IV. Phase U-B B-V 0.00 +0.071 +0.217 0.10 +0.099 +0.272 0.20 +0.104 +0.334 0.30 +0.155 +0.322 0.40 +0.113 +0.399 0.50 +0.122 +0.420 0.60 +0.022 +0.447 0.65 +0.007 +0.474 0.70 +0.143 +0.367 0.71 +0.157 +0.331 0.73 +0.186 +0.361 0.75 +0.150 +0.409 0.77 +0.113 +0.423 0.87 +0.044 +0.457 0.93 -0.025 +0.254 0.95 +0.012 +0.257 CONCLUSION The variable star W CVn is RRab type with stable and smooth light curve excluding the hump on the ascending branch which is most pronounced in B colour. The period is not constant and the secular shortening from the earliest observations was found but Blazko effect is not present. Two colour diagram has a rather complicated form due to the brightening at the phase 0.7P. Due to high galactic latitude of the variable the interstellar absorption is low and the adopted value is 0.10m. We determined the absolute magnitude which is M_v = + 0.54m from the period - luminosity relation and after removing the interstellar absorption the distance of the variable r = 980 pc was found. The author wishes to thank Prof. Dr. L. Detre for the opportunity to use the observing material of W CVn obtained at Konkoly Observatory and for many advices and stimulating discussions. He is indebted to the members of the staff of the Skalnaté Pleso observatory mainly to Messrs. L. Petrík, J. Petras and P. Zimmermann for assistance with 24-inch observing and for the help with the reductions of the photoelectric observations. REFERENCES Ahnert, P., 1961, MVS. 546. Alania, I. F., 1954, Soviet Astron. Circ. 146. Bugoslawski, N., 1927, Astron. Nachr. 229, 203. Ceraski, W., 1907, Astron. Nachr. 176, 109. Detre, L., 1934, Astron. Nachr. 254, 21. Fitch, W.S., Wisniewski, V.Z., Johnson, H.L., 1966, Commun. Lunar and Planet. Obs. 5, 71, 3. Geyer, E., 1961, Z. Astrophys. 52, 229. Jordan, F., 1929, Publ. Allegh. Obs., VII, 44. Joy, A., 1938, Astrophys. J. 88, 108. Kleissen, E., 1939, Astron. Nachr. 267, 139. Nachapkin, V.A., 1940, Tadzh. Observ. Circ. 44. Parenago, P., 1930, Astron. Nachr. 240, 324. Radlova, L.N., 1934, Len. Bull. 4. 28. Robinson, V., 1930, Harv. Bull. 876. Satanova, Eh. A., 1961, Soviet Astron. Circ. 218. Strelkova, E.P., 1960, Soviet Astron. Circ, 209. Sturch, C., 1966, Astrophys. J. 143, 774. Tsesevich, V. P., 1966, Zvezdy Tipa RR Liry, Naukova Dumka, Kijev. Wickramasinghe, N.C., 1967, Interstellar grains, Chapman and Hall, London. Woolley Sir, R., Harding, G. A., Gassells A. I., Saunders, J., 1965, Roy. Observ. Bull, 97. Zinner, E., 1912, Astron. Nachr. 190, 379. Zinner, E., 1916, Astron. Nachr. 202, 233.
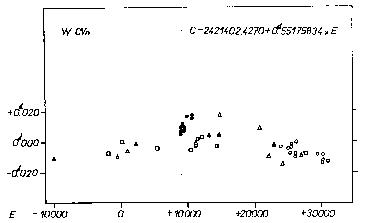 Fig. 1. O - C diagram for the epochs of maxima; squares denote
visual observations, triangles photographic observations,
full dots photometric observations and open circles
photoelectric observations.
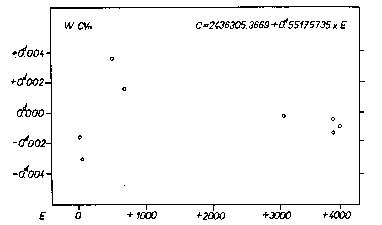 Fig. 2. O - C diagram for the epochs of the mean light from the
Table III.
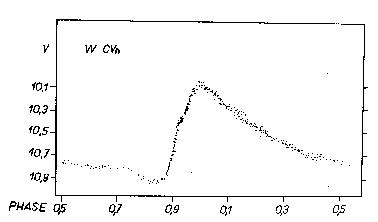 Fig. 3. V photoelectric light curve of W CVn. Full dots represent
four observations, open circles represent two observations.
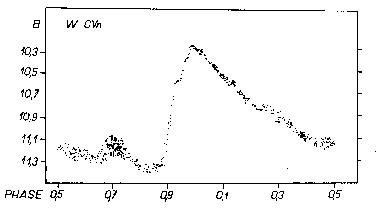 Fig. 4. B photoelectric light curve of W CVn.
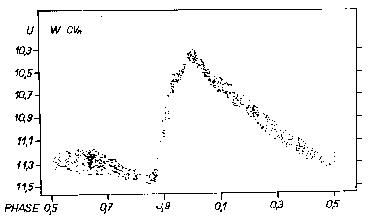 Fig. 5. U photoelectric light curve of W CVn.
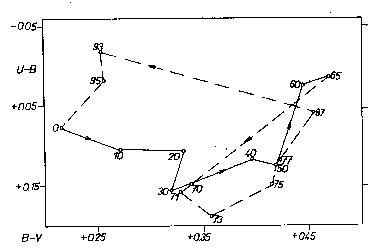 Fig. 6. Colour - colour diagram of W CVn. The numbers at the
curve denote the phase.