A MAGYAR MITTEILUNGEN
TUDOMANYOS AKADEMIA DER
CSILLAGVIZSGALO STERNWARTE
INTEZETENEK DER UNGARISCHEN AKADEMIE
KOZLEMENYEI DER WISSENSCHAFTEN
BUDAPEST-SZABADSAGHEGY
Nr. 68.
L. G. BALAZS
DISTRIBUTION OF STARS OF SPECTRAL
TYPES F7 AND
EARLIER IN A LYRA REGION
BUDAPEST, 1975
DISTRIBUTION OF STARS OF SPECTRAL TYPES F7 AND
EARLIER IN A LYRA REGION
SUMMARY
A study has been made of the spatial distribution of early type stars in
a region of intermediate galactic latitude. Objective prism plates were
used to survey an area of 19.5 sq.deg in Lyra for all stars of spectral type
F7 and earlier down to 13^th photographic magnitude. 524 stars were
detected, for which spectral types and photographic UBV colours were
obtained. The stars were separated into four groups - spectral class A1
and earlier, A2-A7, A8-F2, and F3-F7 - and the space densities
determined for each group. The space density curves show that the first
two groups both appear to be composed of two kinematically distinct
subsystems, each having a Gaussian velocity distribution but with a
ratio of the velocity dispersions of 1.8:1. These two subsystems
probably differ in age and it may be significant that the derived age
difference, about 3x10^8 years, is close to the time-difference between
two consecutive periods of star formation predicted by the density wave
theory of spiral structure. Further observations, however, are needed to
rule out other birth mechanisms having the same characteristic time.
INTRODUCTION
The distribution of the stars off the galactic plane is of considerable
interest in order to understand some of the dynamical properties of our
stellar system. To derive the three-dimensional distribution, we must
analyse data concerning the apparent surface distribution in those
galactic latitudes that are usually called "high" (|b| approx.>=40deg)
and "intermediate" (approx. 40deg>=|b|>=10deg). The overwhelming
majority of objects recognisable in high and intermediate galactic
latitudes belongs to mean main-sequence stars and ordinary giants of
spectral types A - K. In this paper we analyse stars F7 and earlier in
an area of 19.5 sq.deg in Lyra.
OBSERVATIONAL MATERIAL
An area of 19.5 square degrees centred on l = 62.69deg, b = +15.99deg
(alpha = 18h 42m, delta = +33deg 20') was chosen for investigation.
The observations were carried out with the 60/90/180 cm Schmidt telescope of
the mountain station of the Konkoly Observatory. Spectral types and UBV
colours were derived for 524 stars brighter than 13^th photographic
magnitude. The spectral classes are based on three objective prism
plates taken with a 5deg UBK7 (uv transmitting) prism that gives a
dispersion of 580 A/mm at Hgamma. Kodak OaO emulsions were used, and the
widening was 18", equivalent to 0.16 mm on the plate. The classification
criteria were those given. by STOCK and SLETTEBAK (1959) and STOCK (1971).
The plates were made with double exposures of 6m and 24m so that any
systematic variations in the classification with photographic density could be
estimated.
The UBV photometry is based on four plates taken in each colour. The filters,
emulsion types, and exposure times used are given in the following table:
U: Kodak OaO + Schott UG1 2 mm filter exp. time: 10m
B: Kodak OaO + Schott GG13 2 mm filter " 5m
V: Kodak OaD + Schott GG14 2 mm filter " 4m
The international system is connected with the instrumental system
according to the equations:
V_instr = V - 0.05(B-V) - 0.01
(B-V)_instr = 1.08(B-V) + 0.04
(U-B)_instr = 1.11(U-B) - 0.04(B-V) + 0.02
The plates were measured with the Becker-type iris photometer of the
Konkoly Observatory, using a photoelectric sequence obtained with the
Konkoly Observatory 60 cm photometric telescope. The mean errors of the
photographically determined colours are +- 0.08m, 0.07m and 0.06m for
U, B, and V, respectively.
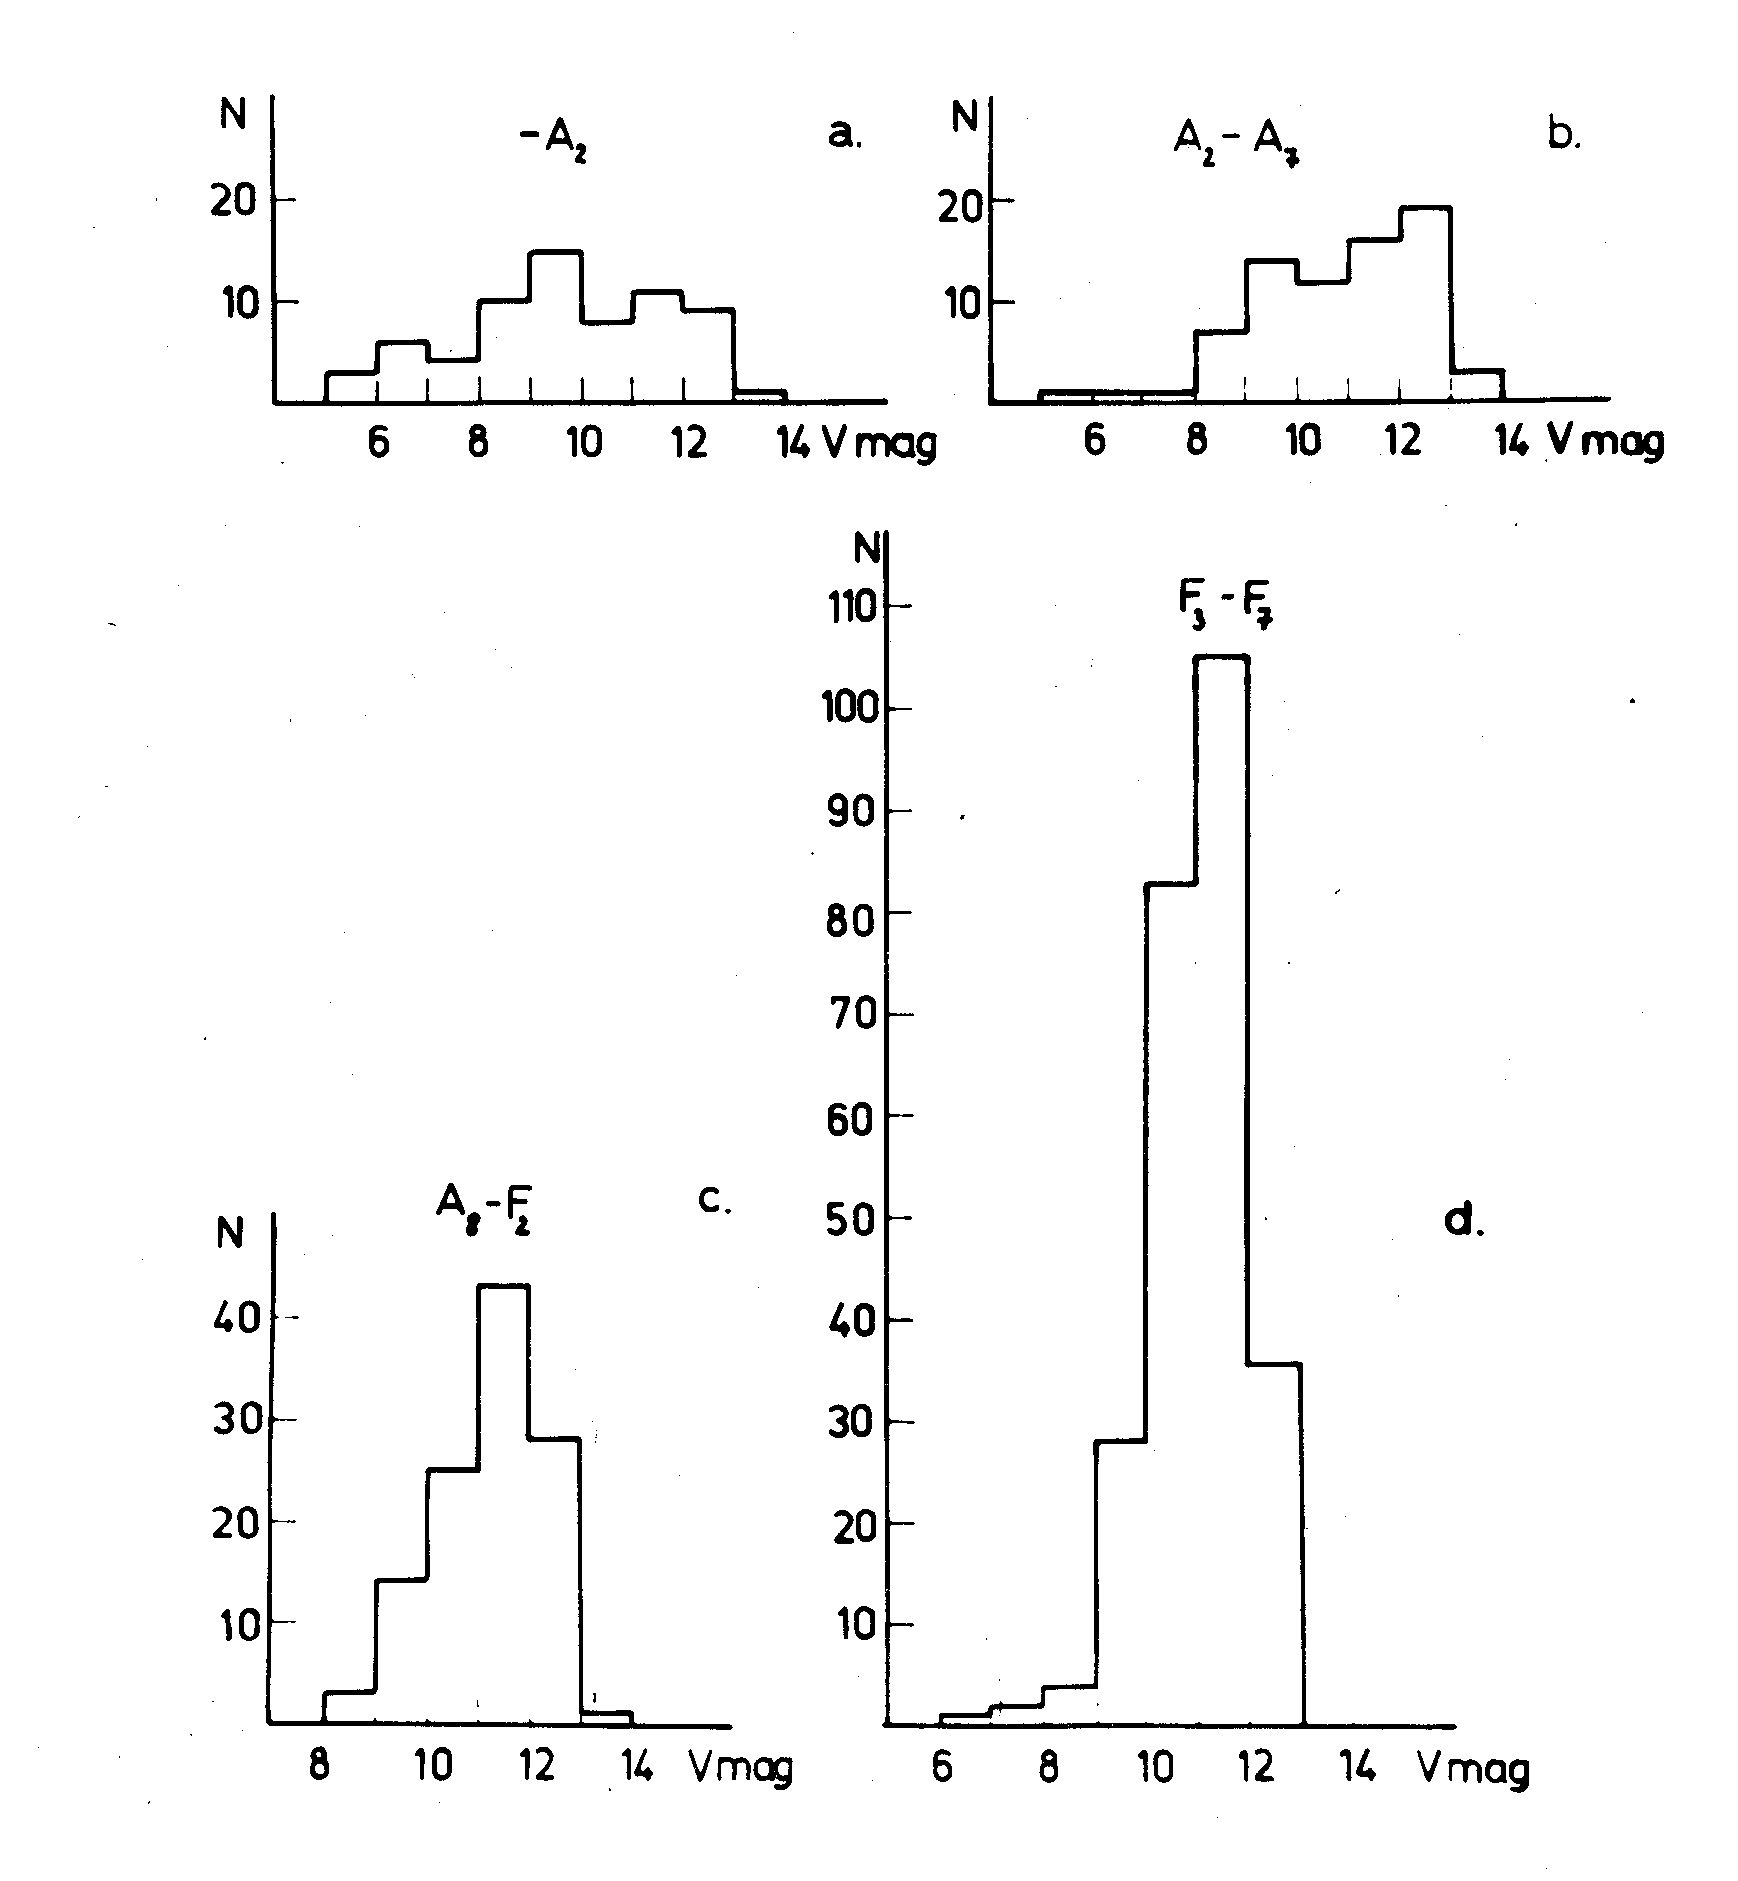 Figure 1.a-d. The distribution of the stars
against V magnitude.
THE SPACE DISTRIBUTION OF THE STARS
According to the sharpness of the classificational criteria and to the
number of stars in each subclass four subgroups were determined: Stars
earlier than A2, A2-A7, A8-F2, and F3-F7. The distribution of the stars
against the V magnitude, in the subgroups defined, are demonstrated in
Figs. 1a-1d. For determining the interstellar absorption the stars in each
subgroup were divided into five groups according to their visual brightness:
<7; 7-9; 9-11; 11-12; and >12. For each subgroup mean spectral types and
colour indices were determined. Adopting JOHNSON's (1963) relation between
intrinsic colour indices and spectral types the E_B-V and E_U-B colour excesses
were obtained. The colour excesses determined by this method are plotted in
Fig. 2, as a function of the distance modulus obtained by subtracting from
the mean V magnitude of each subgroup the absolute magnitude belonging to
the mean spectral type. Adopting a ratio of total to selective absorption
R = A_V/E_B-V = 3 for the total absorption a value A_V = 0.06 rho could be
obtained, where rho = V-M_V. According to this formula the absorption in
the observed direction at a distance of 300 pc amounts to 75% of the
absorption at 1000 pc indicating that the interstellar dust is concentrated in
a 80 pc half thick layer along the galactic plane for this galactic longitude.
Our determination is in good agreement with FITZGERALD's (1968) data
( 0.1<=E_y<0.2 ) for this area.
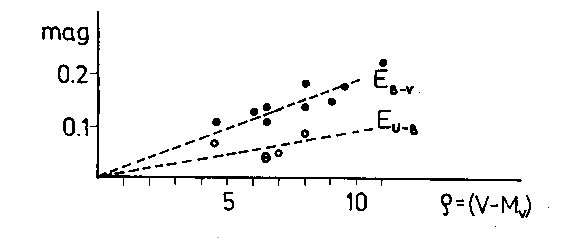 Figure 2. The colour excesses (E_B-V and E_U-B) as
functions of uncorrected distance modulus.
The space densities were derived by grouping the stars in order of the
distance modulus, obtained from the measured V magnitude and the mean absolute
magnitude of the spectral type, corrected for the absorption and dividing the
number of stars by the volume containing them. Assuming a Gaussian distribution
of absolute magnitudes at a given spectral type the mean absolute magnitude at
a given visual brightness can be obtained using the basic convolution equation
of stellar statistics. The computation results the formula (MALMQUIST 1936)
mean(M(m)) = M_0 - sigma^2/A(m) dA(m)/dm
where M_0, sigma, and A(m) are the intrinsic absolute magnitude, the standard
deviation of the Gaussian distribution, and the number of stars in a m +-1/2
interval, respectively.
The densities derived by this method are plotted in Figs. 3a-3d. The dashed
lines show the limit of the completeness of the sample caused by the limiting
magnitude of classification. We shall discuss in the following section the
spatial-distribution of the stars of each subclass separately and in more
detail.
DISCUSSION OF THE SPACE DENSITIES
The density-gradients ( delta nu/delta r ) of the different subgroups are
nearly the same up to 600 pc, except for the break-down caused by the plate
limit. At about 600pc the density-gradient of the A2-A7 stars changes and
becomes smaller. A similar change is visible in the distribution of stars
younger than A2 at 1000 pc but it is based on a small number of stars and
therefore its significance is questionable. Other authors ( VAN RHIJN 1955,
KUROCHKIN 1958, PERRY 1969, WOOLLEY and STEWARD 1967), however, derived a
similar change in the density gradient at stars younger than A2 so this effect
in our case seems to be realistic. The spatial distribution of the A stars near
the galactic poles shows a similar space density curve as those stars in our
case. The similarity between this distributions and those obtained by the
present investigation suggests that the observed density gradients of stars
younger than A2, and A2-A7, in our case, are mainly due to the contributions
of the gradients perpendicular to the galactic plane to the gradient in the
line of sight.
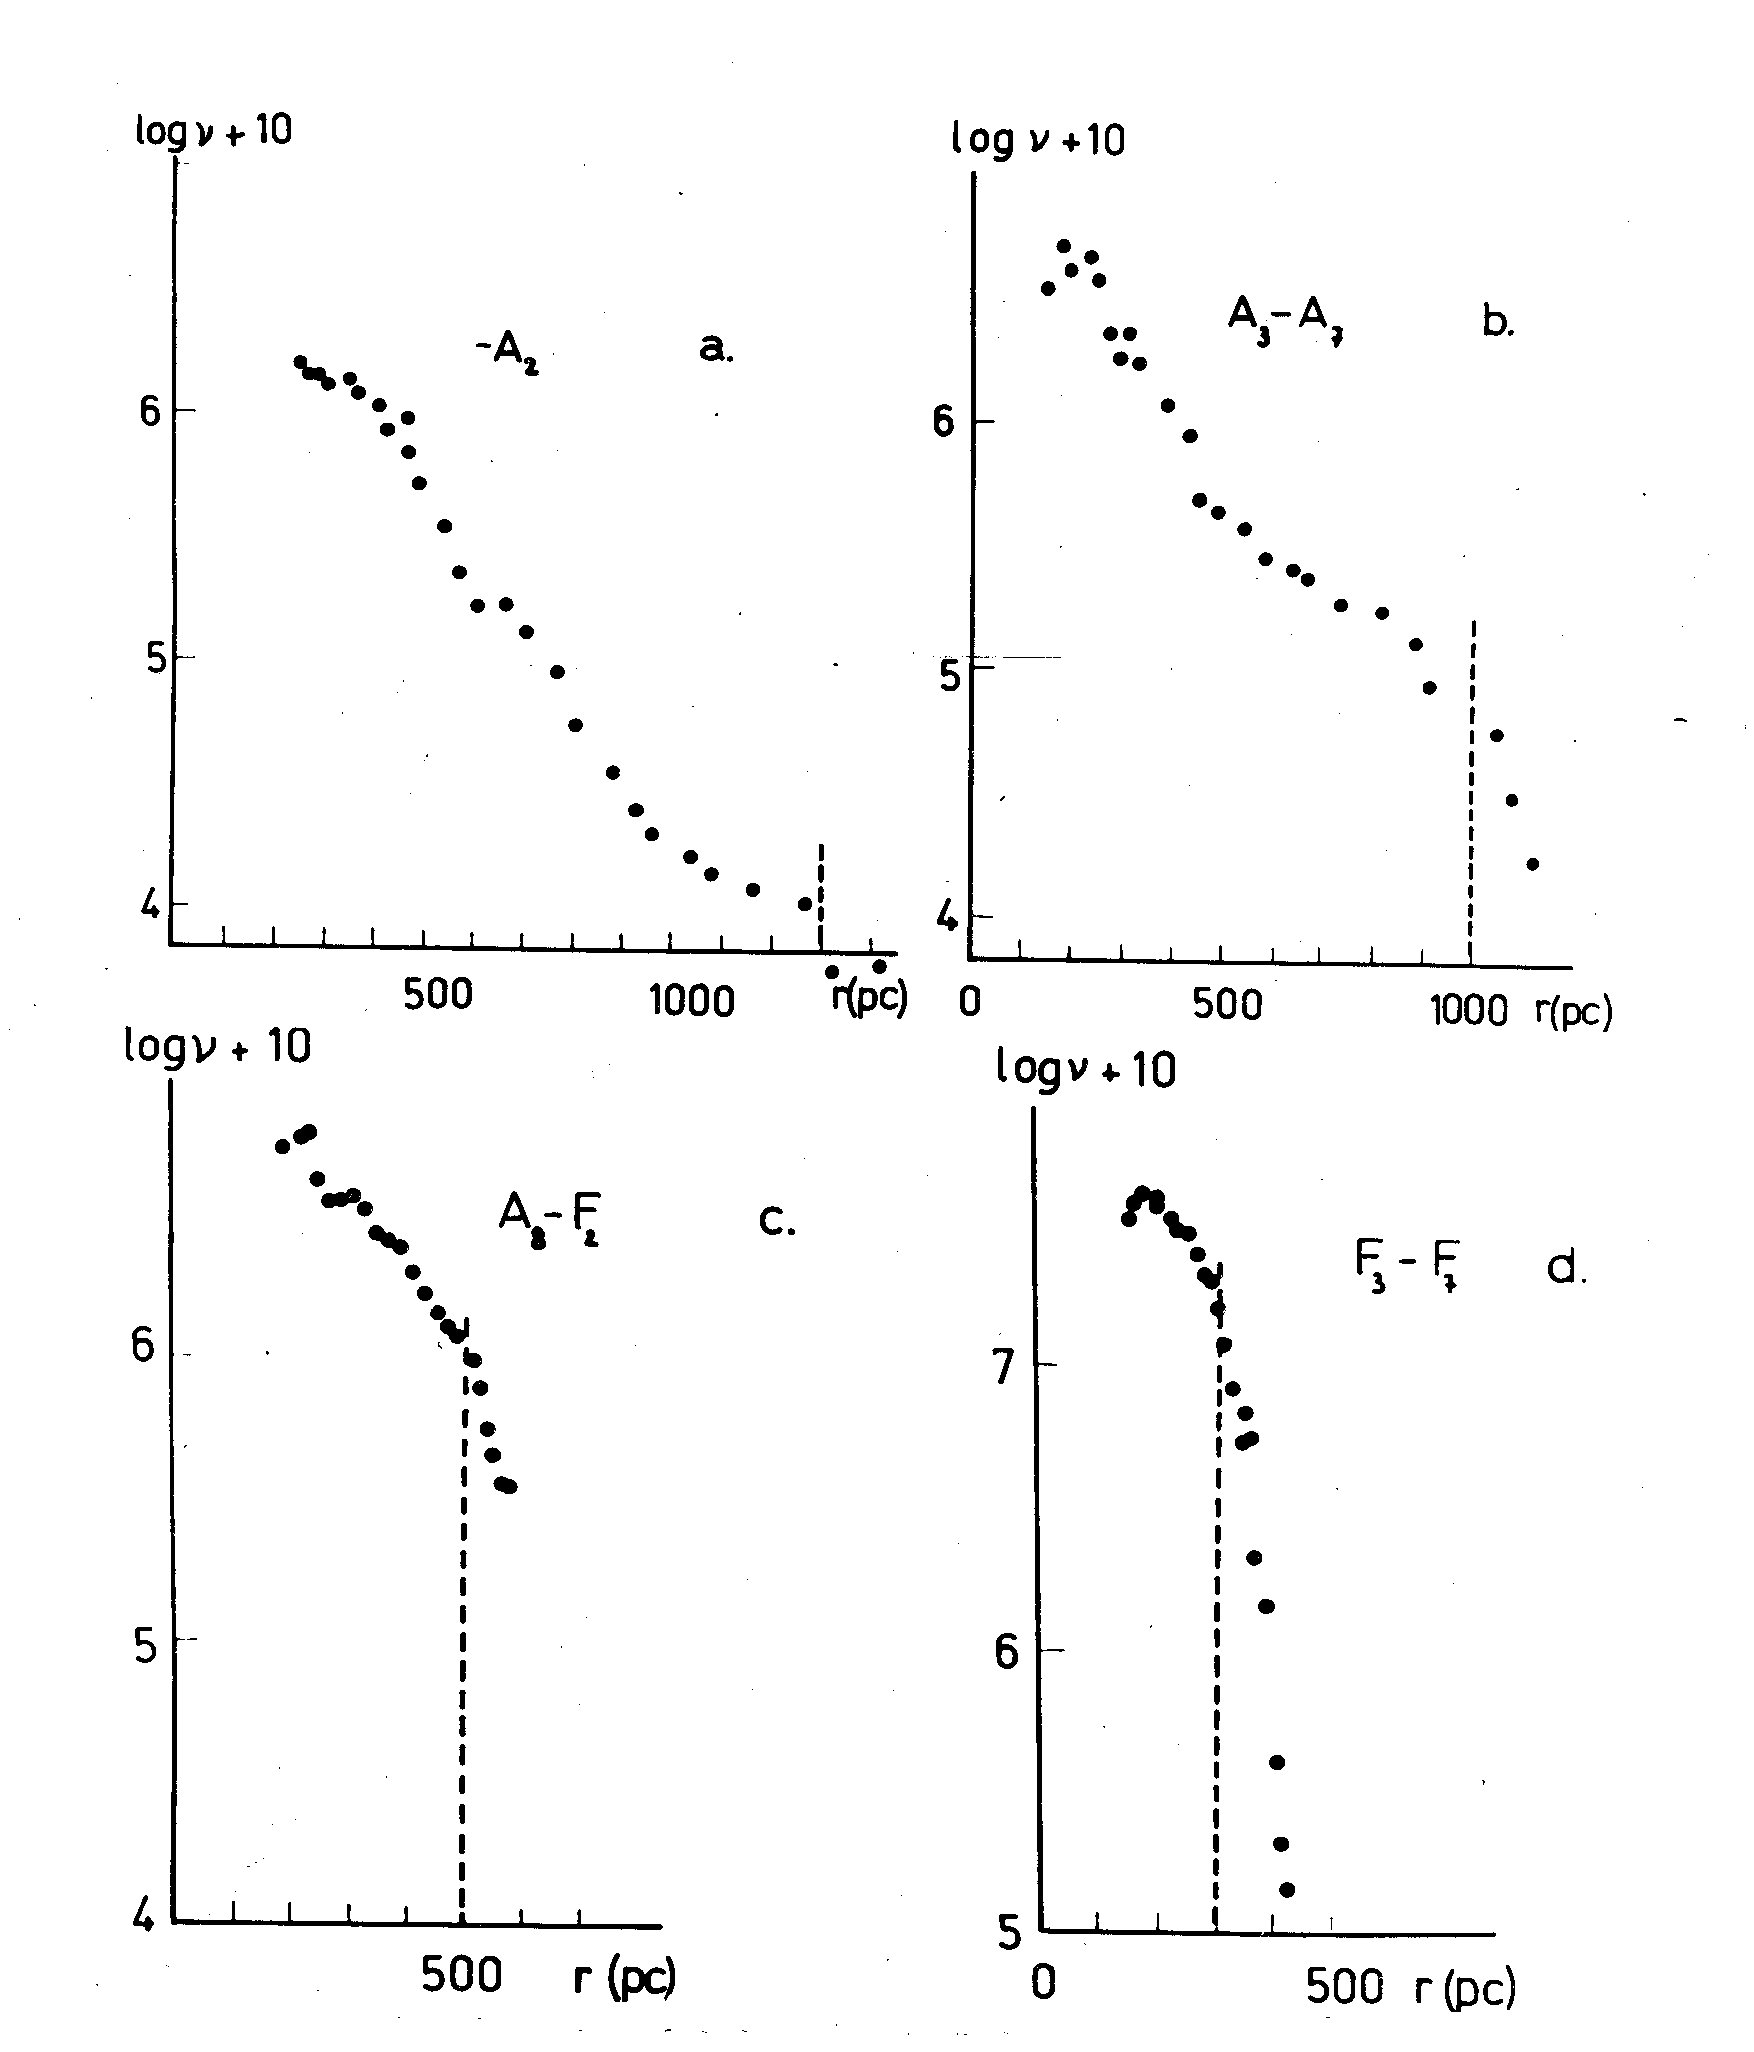 Figure 3.a.-d. The derived space densities of the
different subgroups. (The dashed lines show the
limit of the completness of the sample.)
Supposing that the distribution of stars in the phase space is an even
function of the Z velocity component we can derive the following relation
connecting the spatial density, the standard deviation of the Z velocity
component and the gravitational potential (OGORODNIKOV 1965):
 After integration and elementary computations we obtain:
 In our case we can take nu from our observations making the assumption that nu
depends mainly on the z coordinate. We assume that the same holds for
delta Phi / delta z in the direction observed and take it from the observations
in the galactic caps (reviewed by OORT 1965). sigma_z(0) may be varied inside
reasonable limits according to the observed data. If the formula given above
has resulted a horizontal straight line in the sigma_z(z);z diagram we should
assume that the velocity distribution, in the area observed, is Gaussian, since
in that case sigma_z(z) is independent of z. Using the eye-estimated density
curve of the stars A2-A7 derived from our observations and substituting
sigma_z(0)=6.8 km/sec we get the curve plotted in Fig.4. The curve runs
approximately horizontally up to 70 pc and above 180 pc, and the ratio of the
velocity dispersions characterising the two horizontal parts of the curve
equals to 1:1.8. Nearly the same ratio ( 1:2 ) was observed by WOOLLEY et al.
( 1969 ) and HARDING et al. ( 1971 ) for A0 stars in the south galactic cap.
For sigma_z (0) they obtained 9 km/sec. Therefore the shape of the density
curve may be explained as a superposition of two Gaussian velocity
distributions having the above ratio of the velocity dispersions. At z = 0
the ratio of the densities of the two subsystems equals to about 1:7, and 1:70
in the case of stars younger than A2 if we adopt the change of the density
gradient at r = 1.000 pc as a real effect. It is to be mentioned that
JONES ( 1972 ) found that the M giants in the south galactic cap had a similar
dispersion dependence to those plotted in Fig.4. His sigma_z(0)= 7 km/sec
agrees very well with our value but the increase of velocity dispersion is
stronger than in our case.
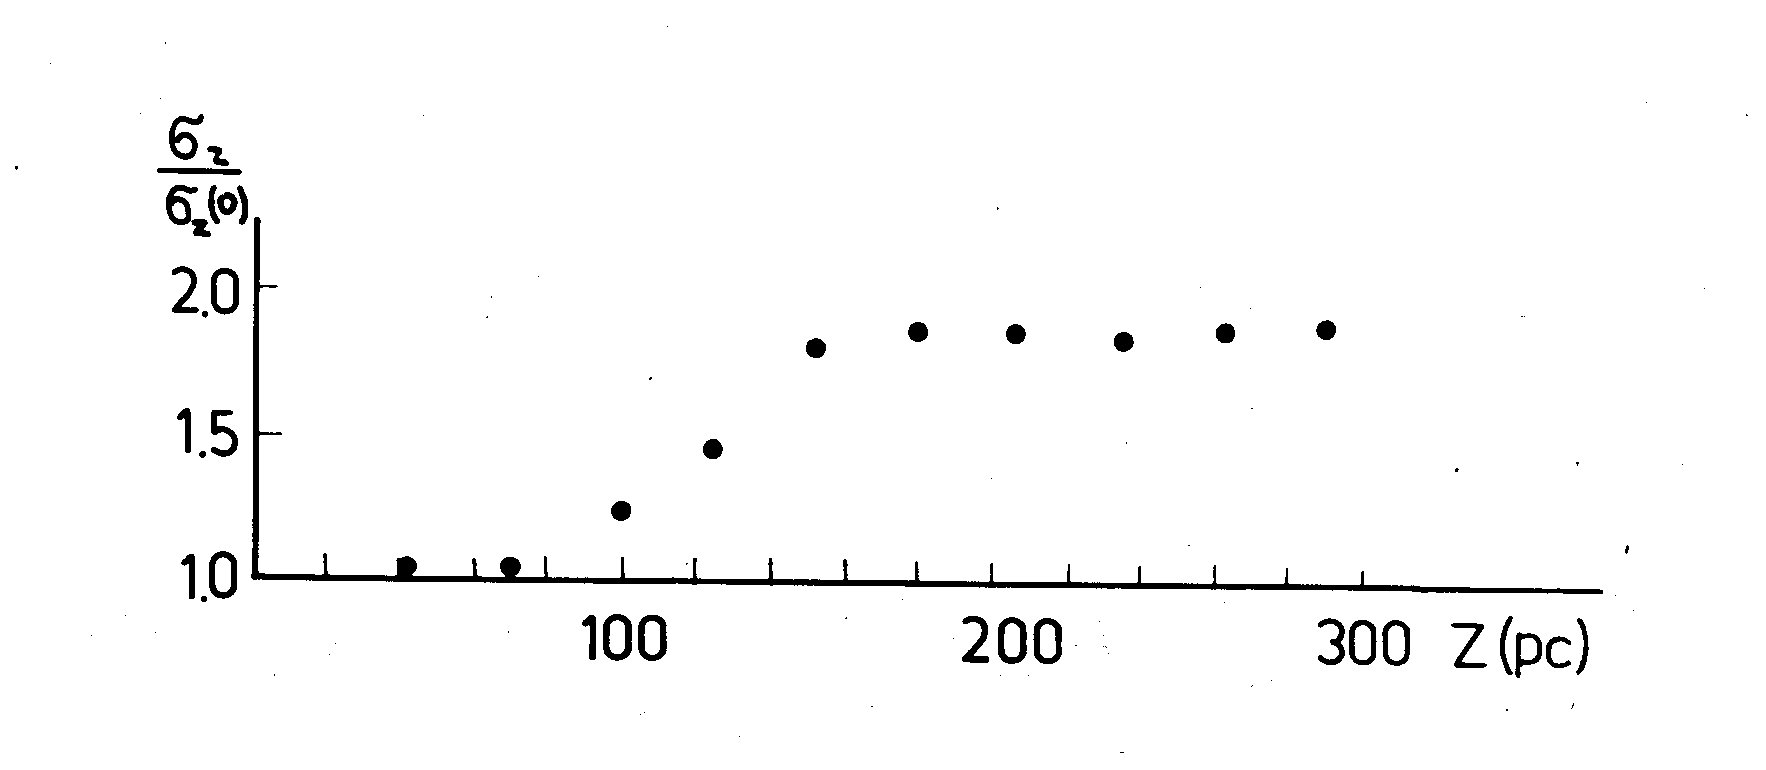 Figure 4. The sigma_z(z)/sigma_z(0) ratio computed from the density
curve of A2-A7 stars plotted against the height (z) above
the galactic plane.
The explanation that the shape of the density curve and the z dependence of
the velocity dispersion of the A type stars caused by a condensation of those
stars around the sun seems to be improbable, because the search for determining
the spatial density of these stars, reported by McCUSKEY (1965), does not show
significant condensation in the direction of our observed area projected onto
the galactic plane. Moreover the condensations are different at different
spectral types but in our case the density gradients are nearly independent of
the spectral type at the first part of the density curves.
The less compact subsystem is more prominent among the A2-A7 stars than
among stars earlier than A2, which have mostly a spectral type B8 or later.
Fig. 5 shows the logarithmic ratio of the density of the less compact component
to the total density at z=0 using the data of different investigators.
The most prominent feature in this figure is the "break" at A0 in the values
of the ratios.
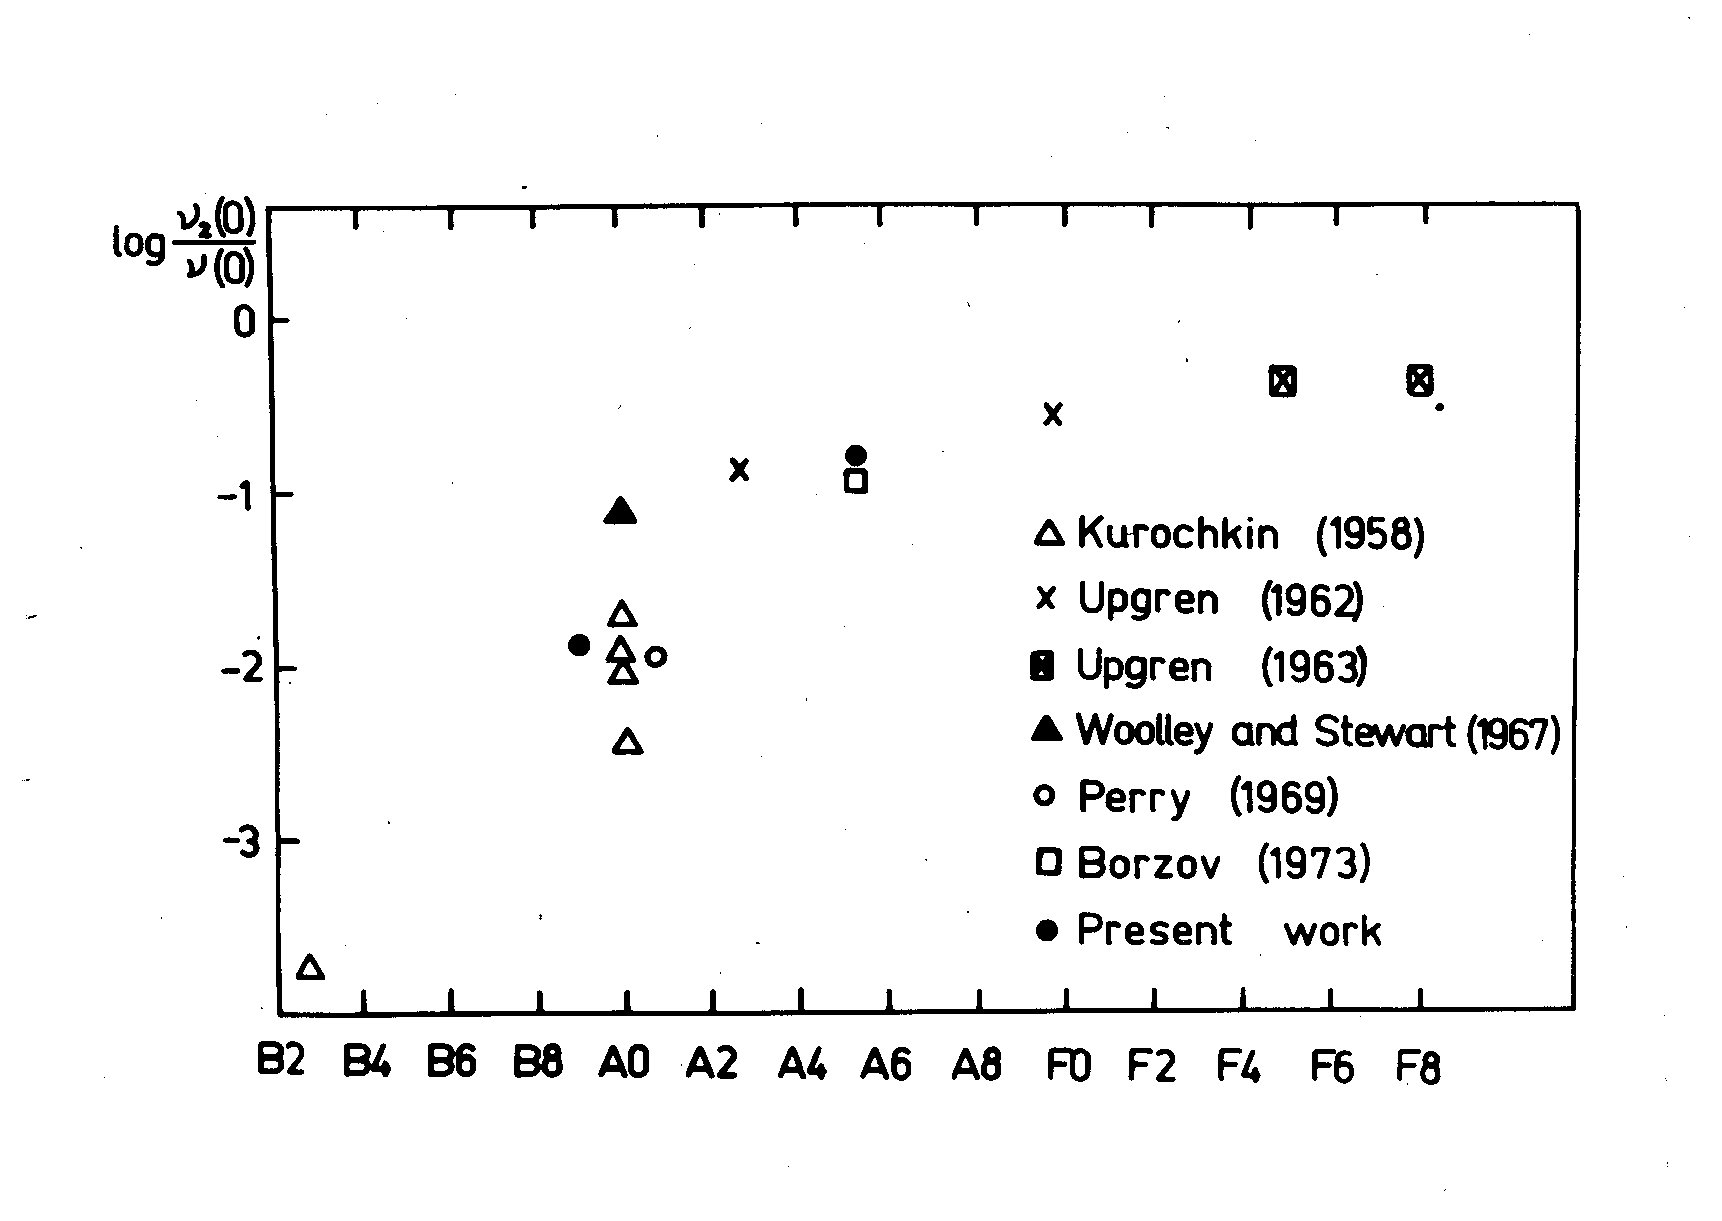 Figure 5. The logarithm of the ratio of the density of the less compact
component to the total density at z=0 using the data of different
investigators.
If stars are born continuously the existence of two kinematically
different subsystems would be difficult to explain. This supports the
idea of steplike birth. Taking into account that the young stars are more
concentrated to the galactic plane than the older stars and that the less
compact subsystem increases in its prominence towards stars having longer
lifetimes it is reasonable to suppose that the two kinematically different
subsystems differ in age, too. The time difference between two "birth events"
may be estimated by the lifetime of the stars at which the "break" appears in
Fig. 5. Using the theoretical lifetimes published by IBEN ( 1967 ) and the
empirical bolometric absolute magnitudes of DAVIS and WEBB ( 1970 ) and the
absolute visual magnitudes of JUNG ( 1970, 1971 ) the lifetimes of the A0 stars
are about 3x10^8 years. The uncertainties of the spectral classification of the
late type B and early type A stars on spectrograms of small scale determine a
confidence interval around A0 in Fig. 5. The edges of this interval are the
spectral types B8 and A2. The lifetime tau of the stars at which the "break"
appears lies therefore in the interval: 1.5x10^8yrs
Finding chart of the survey stars. North is at the
top and East is at the left.
TABLE
Spectra and UBV data of the survey stars
No. Sp. V B-V U-B remarks
1. A1 10.86 -0.19 0.01 BD +31deg 3341
2. F5 9.97 0.39 -0.05 BD +31deg 3334
3. A2 9.86 -0.07 0.15 BD +31deg 3338
4. A1 9.76 -0.15 0.06 BD +31deg 3346
5. F5 11.92 0.19 0.06
6. F4 12.32 0.38 -0.05
7. F7 10.18 0.45 0.02 BD +31deg 3333
*8. A1 6.39 -0.04 -0.26 BD +31deg 3332
9. F5 11.30 0.56 -0.03
*10. A2 7.37 0.28 0.05 BD +31deg 3327
11. F7 9.94 0.44 -0.02 BD +31deg 3326
12. F6 11.45 0.51 -0.12
*13. A3 9.17 0.16 0.05 BD +31deg 3317
14. F5 10.50 0.49 -0.07
15. F5 12.09 0.54 -0.06
16. A2 11.84 0.27 0.18
17. F6 10.67 0.32 0.07
18. A3 11.69 0.20 0.06
*19. A1 9.88 0.30 0.03 BD +32deg 3177
20. F2 12.03 0.43 -0.08
*21. A7 11.50 0.39 0.07
22. B2 11.36 -0.14 0.16
*23. F0 10.70 0.29 0.04
24. F5 10.67 0.57 -0.11 BD +32deg 3184
*25. F5 11.59 0.65 -0.11
26. F5 11.44 0.52 -0.07
*27. F2 10.36 0.37 0.00 BD +32deg 3186
28. F4 12.84 0.85 -
29. A9 9.78 0.34 -0.07 BD +32deg 3178
*30. F3 11.04 0.35 -0.05
*31. F1 10.80 0.27 -0.03
*32. A7 11.65 0.27 0.01 BD +32deg 3199
*33. F2 10.34 0.53 0.05
34. F7 10.26 0.60 -0.09 BD +32deg 3191
35. A7 11.91 0.20 0.02
36. B9 9.22 -0.06 -0.08
37. F3 12.35 0.46 -0.20 BD +32deg 3199
38. F5 12.10 - - blend
39. F7 9.10 - - BD +32deg 3198, blend
40. A2 8.91 -0.01 0.10 BD +32deg 3203
41. A3 11.43 0.11 -0.09
42. A6 11.99 0.40 -0.14
43. A2 10.83 0.36 -0.01
44. A3 8.55 0.30 0.13 BD +32deg 3210
45. B9 8.89 -0.05 -0.20 BD +32deg 3212
46. F4 12.03 0.50 -0.21
47. F2 11.38 0.38 -0.06
48. A7 11.54 0.48 -0.25
49. A8 9.30 0.16 -0.02 BD +32deg 3204
50. F7 9.80 0.57 0.00 BD +31deg 3360
51. F6 9.92 0.69 0.18
52. A5 12.64 0.49 -0.26
53. A9 10.30 0.29 -0.07 BD +31deg 3358
54. F6 10.91 0.57 -0.20
*55. A3 12.79 0.33 -0.02
*56. A9 5.68 0.35 0.00 BD +31deg 3348
57. A7 12.59 0.36 -0.22
58. A7 11.81 0.24 -0.16
59. A4 12.41 0.16 -0.13
60. F6 10.04 0.42 -0.06 BD +31deg 3349
61. F5 10.47 0.35 -0.15
62. A5 10.91 0.28 -0.07
63. F5 10.68 0.37 -0.25
64. F6 9.31 0.40 -0.15 BD +31deg 3350
65. F3 12.27 0.43 -0.06
66. F5 12.75 0.30 -0.27
67. A5 12.03 0.14 -0.07
68. A6 13.00 0.29 -0.22
69. F6 11.61 0.43 -0.20
70. A7 12.50 0.35 -0.16
71. A7 10.62 -0.17 -0.39 BD +31deg 3354
72. F0 12.47 0.44 -0.25
73. F5 10.01 0.34 -0.02 BD +31deg 3352
74. F5 11.45 0.53 -0.05 BD +31deg 3357
75. F5 11.65 0.36 -0.14
76. F4 10.96 0.19 -0.01
77. F0 11.57 0.31 0.01
78. F0 9.27 0.26 0.03 BD +31deg 3362
79. A7 10.21 0.08 0.09 BD +31deg 3363
80. F0 11.75 0.25 -0.12
81. F5 10.62 0.37 0.01
82. F2 11.79 0.22 0.03
83. F5 11.82 0.33 -0.15
84. A9 11.02 0.14 0.19
85. F2 12.54 0.43 -0.05
86. F4 11.50 0.18 -0.02
87. A6 9.58 0.09 0.10 BD +31deg 3368
88. F5 11.08 0.40 -0.07
*89. B4 6.04 -0.14 -0.61 BD +31deg 3369
90. F1 11.42 0.25 -0.09
91. A5 11.88 0.21 0.00
92. A0 10.86 0.00 0.03 BD +31deg 3372
93. F0 10.89 0.14 -0.02
94. F2 11.87 0.36 -0.27
95. F2 11.28 0.26 -0.10
96. A0 8.48 -0.05 -0.09 BD +31deg 3371
*97. B6 6.62 -0.01 -0.11 BD +31deg 3373
98. A2 9.44 -0.08 0.05 BD +31deg 3374
99. F1 10.95 0.28 -0.06
100. F5 10.56 0.47 -0.06
101. F2 11.28 0.31 0.05
102. F6 12.21 0.86 -0.20
103. F4 10.62 0.36 -0.02
104. F0 12.43 0.44 -0.32
105. F6 11.8 - - blend
106. F4 12.24 0.45 -0.27
107. A9 13.03 0.52 -0.10
108. F1 12.01 0.34 -0.10
109. F1 11.53 0.28 -0.19
110. A9 10.71 0.07 0.16 BD +31deg 3379
111. F7 10.81 0.76 0.24
112. F5 9.82 0.37 0.08 BD +32deg 3238
113. F4 9.87 0.30 0.06 BD +32deg 3233
114. B9 9.83 -0.05 0.17 BD +32deg 3230
115. A7 10.58 0.19 0.04 BD +32deg 3229
116. F5 11.0 - -
117. A3 8.56 0.14 0.10 BD +32deg 3221
*118. A3 5.22 0.11 0.03 BD +32deg 3228
119. F5 11.10 0.56 -0.13
120. A9 11.62 0.24 -0.09
121. F5 10.64 0.40 0.01
122. F4 11.50 0.47 -0.19
123. F3 10.14 0.34 0.09 BD +32deg 3235
124. F5 12.14 0.42 -0.14
125. F4 11.96 0.50 -0.19
126. F2 12.75 0.59 -0.07
127. A2 9.70 -0.01 0.19 BD +32deg 3242
128. F6 12.41 0.57 -0.18
129. F5 12.29 0.57 -0.30
130. F5 11.31 0.34 -0.02
131. A4 12.34 0.29 -0.06
132. F3 12.39 0.85 -0.10
133. F4 12.46 0.58 -0.21
134. F4 11.20 0.36 0.04
135. A0 8.83 0.03 0.26 BD +33deg 3245
136. F4 12.21 0.61 -0.18
137. F5 12.54 0.73 -0.23
138. F3 10.94 0.26 0.11
139. F5 11.02 0.37 -0.03
140. F3 12.83 0.64 -
141. F5 12.44 0.54 -0.21
142. A5 11.87 0.25 0.01
143. A5 10.50 0.11 0.18
144. F5 11.15 0.54 -0.04
145. A3 12.83 0.61 -
146. A 12.92 0.76 -
147. F2 11.01 0.48 0.13 BD +33deg 3239
148. F2 10.39 0.36 0.08 BD +33deg 3238
149. F4 12.46 0.57 -0.24
150. A4 12.07 0.37 -0.07
151. F2 11.8 - - blend
152. B8 8.65 0.08 0.04 BD +33deg 3241
153. F6 12.38 0.62 -0.18
154. A8 12.24 0.41 0.05
155. F1 10.74 0.35 0.14 BD +33deg 3244
156. F6 10.99 0.42 0.03
157. A6 12.72 0.51 -0.21
158. A1 11.63 0.03 -0.10
159. F3 9.89 0.54 0.10 BD +32deg 3234
160. F1 10.17 0.29 0.14 BD +32deg 3232
161. A4 9.75 0.14 0.33 BD +33deg 3232
162. F2 9.09 0.51 -0.01 BD +33deg 3236
163. A8 12.17 0.57 -0.16
164. A6 11.69 0.30 0.03
165. F3 12.43 0.58 -0.19
166. F0 12.15 0.51 -0.09
167. F6 10.8 - - BD +33deg 3228, blend
168. F4 11.03 0.47 0.07
169. F3 10.1 - - blend
170. B2 7.0 - - blend
171. A1 BD +33deg 3223, beta Lyrae
172. A7 9.79 0.23 0.43
173. A9 10.97 0.65 0.08
174. F6 11.44 0.56 -0.02
175. F1 11.58 0.59 0.00
176. A2 11.38 0.31 0.19
*177. B2 5.89 -0.16 -0.65 BD +32deg 3227
178. F6 8.66 0.56 0.10 BD +32deg 3223
179. A8 10.86 0.29 0.23
180. F5 11.98 0.59 -0.19
181. F3 11.01 0.51 -0.03
182. F6 10.67 0.41 0.37
183. F6 11.77 0.59 -0.16
184. F5 11.11 0.46 0.09
185. F3 11.92 0.43 0.07
186. F5 11.16 0.50 -0.01
187. F0 11.42 0.64 0.06
188. F0 12.50 0.61 -
189. F2 10.24 0.44 0.06
190. A2 6.84 0.37 0.09 BD +33deg 3215
191. F7 10.61 0.52 0.14 BD +33deg 3219
192. F0 10.44 0.35 0.18
193. F0 11.6 - - blend
194. F5 9.9 - - BD +33deg 3204, blend
195. F3 11.08 0.45 0.01
196. A5 9.00 0.19 0.25 BD +32deg 3214
197. F4 10.93 0.45 0.05
198. F2 10.12 0.43 0.00
199. F4 12.19 0.64 -0.28
200. F2. 10.80 0.37 0.03
201. F0 11.48 0.48 -0.03
202. F6 11.92 0.58 -0.19
203. F6 11.41 0.55 -0.19
204. F6 10.28 0.51 0.04 BD +32deg 3208
205. A5 11.98 0.13 0.16
206. F5 10.01 0.40 0.09 BD +32deg 3207
207. F2 9.89 0.38 0.18 BD +32deg 3200
208. F5 12.06 0.65 -0.28
209. F5 11.67 0.59 -0.15
210. A4 9.77 0.19 0.15 BD +32deg 3195
211. F3 11.54 0.52 -0.19
212. F2 10.13 0.40 0.00
213. F6 10.43 0.56 -0.03 BD +32deg 3194
214. F0 12.27 0.42 -0.04
215. F5 10.54 0.58 0.00
216. F2 11.62 0.50 -0.10
217. F1 11.18 0.16 0.02
218. F2 10.68 0.43 0.02
219. A1 9.76 0.13 0.16 BD +32deg 3193
220. A7 11.23 0.44 0.19
221. A3 11.76 0.27 0.13
222. F5 10.97 0.58 0.03
223. F1 10.77 0.66 0.15
224. F5 10.90 0.49 -0.02
225. F6 12.25 0.61 -0.19
226. A6 10.21 0.13 0.19 BD +33deg 3193
227. F0 11.01 0.27 0.09 BD +33deg 3196
228. A4 9.57 0.19 0.17 BD +33deg 3200
229. F6 11.87 0.75 -0.22
230. F6 9.35 0.47 -0.06 BD +33deg 3194
231. F5 11.03 0.40 0.15
232. B9 11.62 0.07 0.07
233. F5 11.92 0.17 0.02
234. A3 12.70 0.30 -0.16
235. A5 8.99 0.21 0.20 BD +33deg 3188
236. F4 11.08 0.38 0.09
237. F0 11.48 0.40 -0.03
238. F3 12.49 0.61 -0.28
239. F4 9.71 0.48 0.19 BD +33deg 3187
240. A3 11.5 - -
241. F0 11.33 0.27 0.17
242. F5 11.14 0.58 -0.26
243. F5 11.04 0.51 -0.17
244. F6 10.29 0.47 0.14
245. F5 11.97 0.45 -0.26
246. F7 7.56 0.83 0.14 BD +33deg 3190
247. F5 11.3 - -
248. A9 12.23 0.61 -0.08
249. F5 10.15 0.69 0.16 BD +33deg 3185
250. F5 11.57 0.58 0.05
251. F5 11.63 0.61 0.11 BD +33deg 3186
252. F4 11.44 0.70 -0.06
253. A0 12.50 0.32 -0.23
254. F6 11.13 0.70 0.06
255. F6 10.69 0.73 0.08
256. F6 11.42 0.91 -0.05
257. A7 10.33 1.56 1.28
258. A0 9.45 0.10 0.20 BD +33deg 3195
259. F6 11.90 0.68 -0.18
260. A1 12.43 0.40 -0.02
261. F6 9.59 0.55 0.18 BD +34deg 3313
262. F6 9.52 0.61 0.13 BD +34deg 3314
263. F1 10.34 0.36 0.10
264. F7 8.17 0.57 0.06 BD +34deg 3317
265. F0 12.25 0.53 -0.21
266. F5 12.19 0.53 -0.24
267. F0 10.35 0.30 0.19 BD +33deg 3210
268. F4 11.52 0.40 0.08
269. B5 11.25 -0.04 -0.38
270. F6 8.78 0.54 0.10 BD +33deg 3212
271. F1 11.85 0.45 0.05
272. A8 12.36 0.41 -0.11
273. F5 10.78 0.65 0.09
274. A4 8.81 0.29 0.21 BD +34deg 3325
275. F5 12.46 0.58 -0.17
276. A0 7.82 0.25 0.26 BD +34deg 3729
277. F4 11.89 0.36 0.07
278. F7 8.35 0.58 0.20 BD +33deg 3214
279. F5 10.18 0.44 0.14 BD +33deg 3221
280. F6 11.59 0.55 -
281. F3 11.19 0.44 -0.06
282. F6 10.00 0.44 0.17 BD +33deg 3231
283. A4 10.10 0.13 0.24 BD +33deg 3233
284. A3 9.55 0.36 0.30 BD +34deg 3333
285. F2 10.89 0.33 0.09 BD +34deg 3338
286. F5 12.09 0.51 -0.11
287. F4 11.58 0.42 -0.06
288. F5 12.60 0.59 -0.19
289. F3 12.0 - -
290. F5 11.60 0.49 0.04
291. F3 11.12 0.23 0.13
292. F6 11.76 0.76 -0.02
293. F5 12.52 0.68 -0.30
294. A3 11.53 0.29 0.12
295. F6 11.16 0.61 -0.15
296. F4 12.27 0.70 -0.36
297. F2 10.49 0.21 0.76 BD +34deg 3340
298. A4 13.09 0.41 -0.31
299. A0 12.02 0.00 -0.16
300. A7 10.51 0.34 0.23
301. A3 6.94 0.32 0.37 BD +34deg 3334
302. A3 8.54 0.74 0.18 BD +34deg 3337
303. F5 11.78 0.57 -0.20
304. F2 9.62 0.41 0.13 BD +34deg 3339
305. A2 11.83 0.41 0.17
306. F4 10.91 0.59 -0.04
307. F4 11.84 0.61 -0.17
308. F2 10.96 0.52 0.01
309. A4 12.00 0.47 -0.03
310. F7 7.40 0.79 0.20 BD +34deg 3326
311. B9 8.15 0.25 -0.01 BD +34deg 3319
312. F4 11.44 0.66 -0.06
313. F0 11.10 0.43 0.11
314. F5 10.38 0.65 0.08
315. A0 11.68 0.27 -0.11
316. F5 11.66 0.65 -0.03
317. F5 11.40 0.67 -0.20
318. F2 9.70 0.47 0.24 BD +34deg 3321
319. F6 11.94 0.80 -0.26
320. A1 11.14 0.39 0.10
321. A2 6.64 0.40 0.18 BD +34deg 3310
322. F5 10.53 0.67 0.02 BD +34deg 3309
323. A0 13.43 0.31 -
324. A8 9.19 0.49 0.16 BD +34deg 3303
325. F6 11.21 0.65 0.03
326. F5 11.71 0.79 -0.19
327. F3 9.44 0.58 0.00 BD +34deg 3299
328. A3 7.51 0.44 0.19 BD +34deg 3297
329. F6 10.47 0.64 0.08 BD +34deg 3300
330. A8 8.98 0.49 0.15 BD +34deg 3301
331. B3 12.58 0.60 -0.20
332. F5 10.98 0.80 -0.01
333. F7 11.29 0.76 -0.08
334. A2 8.7 - - BD +34deg 3312, blend
335. F0 10.51 0.61 0.18
336. A3 9.70 0.31 0.18 BD +34deg 3305
337. B7 6.86 0.40 -0.18 BD +34deg 3302
338. F5 11.21 0.75 -0.06
339. F0 11.58 0.50 -0.03
340. F0 11.97 0.73 -0.16
341. F3 11.58 0.74 -0.16
342. F5 11.29 0.77 -0.10
343. F4 10.42 0.63 0.07
344. A9 11.11 0.62 -
345. F6 10.14 0.76 0.11 BD +35deg 3359
346. F2 9.45 0.51 0.13 BD +35deg 3353
347. F1 11.31 0.72 -0.07
348. B9 9.13 0.42 0.11 BD +35deg 3349
349. A7 8.76 0.36 0.22 BD +35deg 3346
350. A2 12.17 0.36 -0.09
351. F1 8.5 - - BD +35deg 3342, blend
352. F4 11.80 0.74 -0.21
353. F1 11.31 0.61 0.00
354. F5 11.40 0.89 -0.26
355. B8 9.09 0.31 0.00 BD +35deg 3341
356. F4 9.54 0.68 0.02 BD +34deg 3295
357. A7 9.92 0.64 0.14 BD +34deg 3294
358. A9 12.16 0.54 -0.08
359. A5 10.04 0.44 0.16 BD +34deg 3292
360. F6 10.27 0.76 0.22 BD +34deg 3291
361. A9 9.51 0.40 0.23 BD +34deg 3290
362. F2 11.89 0.54 0.11
363. A0 7.8 - - blend
364. B3 6.2 - - BD +34deg 3285, blend
365. F6 10.70 0.69 0.10
366. A0 9.88 0.25 0.28 BD +35deg 3284
367. A0 9.77 0.24 0.15 BD +34deg 3281
368. F5 10.41 0.67 0.10 BD +34deg 3277
369. F5 11.61 0.70 -0.15
370. F6 10.36 0.78 0.19 BD +34deg 3278
371. F3 9.99 0.46 0.02 BD +35deg 3331
372. A6 13.63 - -
373. F5 9.84 0.69 0.10 BD +35deg 3333
374. A2 12.16 0.41 -0.10
375. F4 - - - on the edge of the
plate
376. A2 8.81 0.48 0.16 BD +35deg 3324
377. F4 10.21 0.77 0.11 BD +35deg 3313
378. A9 11.43 0.80 0.23
379. A5 12.33 0.59 0.01
380. F2 10.87 0.68 0.01
381. F5 10.45 0.87 0.13 BD +34deg 3268
382. A9 12.54 0.50 0.09
383. F5 12.19 0.75 -
384. F4 9.19 0.73 0.11 BD +34deg 3263
385. F5 10.03 0.63 0.15 BD +34deg 3261
386. A7 10.35 0.56 0.15
387. A5 11.30 0.54 -0.12 BD +34deg 3272
388. F0 11.3 - - blend
389. F2 12.41 0.64 -0.23
390. A4 12.44 0.46 0.00
391. F5 11.26 0.63 -0.03
392. F6 10.03 0.72 0.16 BD +34deg 3276
393. F4 12.36 0.66 -0.03
394. F5 10.94 0.62 0.05
395. A0 8.83 0.24 -0.05 BD +34deg 3289
396. F6 10.41 0.65 0.29
397. F5 11.74 0.58 0.31
398. F2 9.86 0.59 0.12 BD +34deg 3283
399. F2 11.78 0.72 -0.16
400. A9 11.40 0.54 0.11
401. B4 7.20 0.11 -0.41 BD +33deg 3180
402. F6 9.73 0.60 0.20 BD +33deg 3172
403. A1 11.26 0.56 0.25
404. F5 11.66 0.60 0.05
405. F6 11.35 0.53 0.03
406. F5 10.49 0.63 0.12
407. A8 11.94 0.42 0.11
408. F5 10.86 0.56 0.12 BD +34deg 3260
409. F5 10.97 0.55 0.05
410. F5 11.43 0.69 -0.01
411. B9 10.60 0.10 -0.07 BD +34deg 3252
412. F5 11.16 0.62 0.11
413. F4 12.35 0.69 -0.19
414. F1 11.52 0.52 -0.02
415. F2 11.21 0.50 0.19
416. A0 5.80 -0.09 0.24 BD +34deg 3245
417. A3 10.42 0.31 0.26 BD +34deg 3250
418. F0 12.37 0.65 -0.02
419. A2 11.32 0.29 0.22
420. F5 10.59 0.75 -0.02
421. F1 11.56 0.52 0.06
422. A0 8.61 0.28 0.13 BD +34deg 3247
423. F5 10.04 0.68 0.18 BD +34deg 3249
424. A1 12.63 0.11 -0.46
425. A5 9.34 0.34 0.24 BD +33deg 3138
426. A7 11.27 0.49 -0.01
427. F4 11.71 0.79 -0.19
428. F3 11.73 0.43 0.06
429. F3 10.20 0.35 0.21
430. A3 10.68 0.28 0.12
431. F5 10.92 0.64 -0.10 BD +33deg 3144
432. F5 10.23 0.88 -0.06 BD +33deg 3149
433. F5 11.20 0.70 -0.14
*434. A1 5.38 -0.10 -0.49 BD +33deg 3212
435. F0 12.15 0.70 -0.20
436. A3 9.70 0.36 -0.01 BD +33deg 3152
437. F4 11.91 0.63 -0.26
438. F5 11.85 0.67 -0.07
439. F5 10.73 0.59 0.00
440. F0 10.94 0.47 -0.03
441. F0 11.55 0.46 -0.01
442. A8 11.94 0.58 -0.13
443. F5 10.52 0.81 -0.12
444. A7 9.32 0.30 0.11 BD +32deg 3155
445. A0 11.17 0.15 -0.12
446. F1 11.14 0.63 0.02
447. A5 12.41 0.78 -0.36
448. A6 12.25 0.51 -0.11
449. F6 10.69 0.69 0.03
450. F4 10.57 0.67 -0.10
451. F7 9.30 0.76 -0.01 BD +32deg 3169
452. F5 11.62 1.00 -0.27
453. F6 11.04 0.91 -0.20
454. F6 11.16 0.81 -0.28
455. A0 12.96 0.50 -
456. F5 11.80 0.66 -0.27
457. A5 11.54 0.58 -0.01
458. F6 11.54 0.60 -0.07
459. F5 10.15 0.70 -0.11 BD +32deg 3166
460. F4 11.20 0.78 -0.20
461. F7 11.52 0.81 -0.19
462. F6 10.39 0.81 -0.17 BD +33deg 3169
463. F5 11.78 0.68 -0.22
464. F3 11.57 0.68 -0.20
465. F5 10.56 0.70 -0.11
466. F6 10.67 0.69 -0.10
467. F6 6.90 0.83 0.08 BD +33deg 3171
468. F0 11.47 0.64 -0.09
469. F3 9.84 0.64 0.07 BD +33deg 3167
470. B8 8.51 0.40 -0.10 BD +33deg 3165
471. F3 9.06 0.62 0.08 BD +33deg 3163
472. F5 10.50 0.77 -0.17
473. F5 10.77 0.75 -0.03
474. F6 9.94 0.84 0.01 BD +33deg 3159
475. B9 9.24 0.34 0.01 BD +33deg 3173
476. F7 9.55 0.74 -0.05 BD +33deg 3174
477. F5 9.53 0.86 0.01 BD +33deg 3179
478. A2 10.99 0.44 0.12
479. A9 11.46 0.73 -0.14
480. F5 11.06 0.76 -0.14
481. A0 10.38 0.30 -0.01 BD +33deg 3178
482. F7 9.51 0.90 0.30 BD +33deg 3181
483. F6 10.92 0.75 -0.09
484. F5 11.86 0.67 -0.11
485. F2 12.13 0.65 -0.11
486. F0 10.93 0.59 -0.07
487. F0 12.64 0.62 -0.27
488. A4 9.32 0.67 0.03 BD +32deg 3183
489. F5 11.49 0.77 -0.21
490. F5 11.45 0.87 -0.29
491. F4 11.13 0.70 -0.32 BD +32deg 3170
492. F4 11.67 0.78 -0.23
493. F7 9.4 - - BD +32deg 3175, blend
494. F4 10.68 0.56 -0.11
495. F5 11.61 0.64 -0.19
496. F6 10.98 0.79 0.05
497. B8 10.03 -0.02 -0.39 BD +32deg 3165
498. A8 9.45 0.34 0.02 BD +32deg 3162
499. A9 9.35 0.43 0.01 BD +32deg 3161
500. A3 9.77 0.27 0.00 BD +32deg 3159
501. F4 12.02 0.52 -0.31
502. A2 12.08 0.29 -0.06
503. F6 9.96 0.77 -0.11
504. F3 9.62 0.46 -0.11 BD +32deg 3157
505. F5 11.35 0.58 -0.17
506. F4 11.89 0.49 -0.18
507. F6 10.29 0.58 -0.14 BD +32deg 3154
508. F2 11.14 0.30 -0.12
509. F3 11.12 0.16 -0.03
510. F6 10.51 0.55 -0.06 BD +31deg 3301
511. F6 9.37 0.54 -0.05 BD +31deg 3305
512. A8 12.37 0.51 -0.11
513. A1 9.51 0.01 -0.08 BD +32deg 3164
514. F6 10.81 0.55 0.03
515. A4 12.62 0.30 -0.18
516. A8 12.32 0.53 -0.20
517. A8 12.47 0.48 -0.07
518. F5 10.49 0.54 -0.10
519. A6 12.03 0.72 -0.27
520. F5 10.38 0.47 -0.07 BD +31deg 3310
521. F3 10.65 0.38 -0.03 BD +31deg 3312
522. A5 8.94 0.32 0.07 BD +31deg 3311
523. A3 13.03 0.54 -0.13
524. F6 10.10 0.45 -0.03
Notes to the table:
An asterisk at the left upper side of the running number denotes
photoelectrically measured colours.
Blend is remarked if the photographic image of the measured star is
distorted by a neighbouring star.