A MAGYAR MITTEILUNGEN
TUDOMÁNYOS AKADÉMIA DER
CSILLAGVIZSGÁLÓ STERNWARTE
INTÉZETÉNEK DER UNGARISCHEN AKADEMIE
KÖZLEMÉNYEI DER WISSENSCHAFTEN
BUDAPEST - SZABADSÁGHEGY
NR. 69.
S. KANYÓ
U, B, V PHOTOMETRY OF THE MULTIPLE
PERIODIC RR LYRAE STAR RV URSAE
MAIORIS
BUDAPEST, 1976.
U,B,V PHOTOMETRY OF THE MULTIPLE PERIODIC RR LYRAE STAR
RV URSAE MAIORIS
SUMMARY
Three-colour photoelectric photometry of the RRab variable star RV Ursae
Maioris, is presented. Period and total light curve changes of the star
during the Blazhko period and O-C diagrams of both the main and the
secondary periods are investigated. It was found that a certain phase
point / phi_s=0,94/ of the ascending branches of the light curves showed
no oscillation during the Blazhko period, which is hardly compatible with the
assumption of the superposition of beat periods. A long cycle of 6-8 years
in the O-C variations of the ascending branch was also found. Similar long
cycle variations are shown by other RR Lyrae stars exhibiting the Blazhko
effect, this variation being reminiscent of the solar magnetic cycle.
INTRODUCTION
RV Ursae Maioris is an RRab Lyrae variable star whose light
variation was among the firsts discovered. The variability of RV UMa was
announced by Cerasky in 1907 /Cerasky 1907/, and its light elements were
derived by Blazhko /1908/. According to the properties of the observed
light curve and the period /P=0.4684d/ Blazhko classified the star as a
short periodic delta Ceph variable. In 1920, Jordan and Subbotin pointed
out independently the strong variation of the light curve of RV UMa
/Jordan, 1920; Subbotin, 1927/
Photographic observations of RV UMa were initiated at the Konkoly
Observatory by Julia Balázs and Detre with a 16 cm astrograph in 1936. A
great number of observations were made in Budapest confirming the
existence of a Blazhko effect, however, the secondary period could not be
determined until photoelectric observations were made by Balázs and Detre
in 1956-1957. Using all published observations they derived for the
secondary period P_s=90.8d. They constructed O-C diagrams for both the
fundamental and the secondary period over a time interval of 50 years.
According to Preston the spectral type of RV UMa at minimum
light is F4 from H-lines and A6 from the CaII-line giving Delta S=8
/Preston, 1959/. On 34 nights in 1959 and 1960 Preston obtained a total of 113
spectrograms of the star; with the X-spectrograph of the Mount Wilson
60-inch reflector concurrently Spinrad carried out photoelectric
observations on the UBV system with the 20-inch reflector of the Leushner
Observatory in Berkeley. In addition four light rises were observed by
Preston with the 60-inch reflector in 1960. They used these series of
photoelectric and spectroscopic observations to point out some
peculiarities in the 90-day cycle /Preston and Spinrad, 1967/.
THE PHOTOELECTRIC OBSERVATIONS
The present author observed RV UMa photoelectrically during the period
1961-1969, at first in yellow and blue, later also in ultraviolet light.
Additional measurements were obtained by Csank, Gefferth and Lovas on the
B, V system in 1958-59. The observations ranged over all phases of the
primary and secondary periods. In this way it was possible to study the
variations of complete light- and colour-curves in the 90-day cycle.
The distribution of the observations is listed in Table I.
Table I
Number of observations
Year Number
of nights
Yellow Blue Ultra- Total
violet
1958 6 69 69 - 138
1959 10 138 138 - 276
1976 50 1356 1356 - 2712
1962 47 593 593 562 1748
1963 17 26 275 275 576
1964 15 110 110 110 330
1965 1 16 16 - 32
1968 2 33 33 14 80
1969 2 37 37 - 74
Total 150 2378 2627 961 5966
All observations were made with the 24-inch reflector of the Konkoly
Observatory. The unrefrigerated photometer employed was equipped with an RCA
1P21 photomultiplier up to 1961, after that time with an EMI 9502B phototube.
The following filters were used
Colour Type lambda eff
yellow Schott GG 11 5600 A
blue " BG 12+GG 13 4300 A
ultraviolet " UG 1 3950 A
The photomultiplier output was amplified by a d.c. amplifier. The
linearity of the instrument seemed to be warranted within the mesauring
interval.
The comparison star for our observations was the visual double
star BD +55 1616. Spinrad used the same comparison star while BD +54 1610,
used by Preston as a comparison star, was chosen as the check star. Both
stars are within 20' to the variable. The photoelectric data for these
stars were adopted from the measurements of Preston and Spinrad /Table II/.
Table II
V B-V U-B
BD +55 1616 9.963 + 0.507 - 0.114
BD +54 1610 9.62 + 0.580 + 0.095
Observations of standard stars published by Johnson and Morgan /1953/ were
used to transfer the differential magnitudes and colours from the
instrumental system u,b,v to the international U, B, V system by the formulae:
Delta V = Delta v + epsilon Delta/B-V/ /1/
Delta/B-V/ = mu Delta/b-v/ /2/
Delta/U-B/ = psi Delta/u-b/ /3/
The values of the coefficients were determined from time to time, though
not frequently enough to be able to trace small variations caused by
variability of sky transparency. Therefore, only the most significant
variations of the coefficients were taken into account - specially that
due to a transition from a silvered mirror to an aluminized one in 1961.
Beginning with 1963 we have obtained sufficient data for the coefficients.
The different sets of these coefficients are given in Table III, while the
reduced observations are listed in Table IV.
Table III
Time interval epsilon mu psi
From Feb. 1958
to May 1963 - 0,132 1,05 1,08
1964 - 0,14 1,12 1,16
Apr. 1965 - 0,136 1,17 1,09
January 1968 - 0,166 1,208 1,10
March 1968 - 0,156 1,152 1,00
January 1969 - 0,130 1,194 1,02
May 1969 - 0,177 1,181 0,955
LIGHT-CURVE VARIATIONS
The main purpose of this investigation was to study the
variations of the light curve in V and the B-V and U-B colour curves
in the 90-day cycle for all phases / phi / of the 0.468d period.
However the observations were concentrated on the phases phi = 0,85 - 0,05,
i. e. on the minimum ascending branch and maximum of the light curve. Some
individual V, B-V and U-B curves for these phases are represented in Fig.
1. To obtain complete light curves for all phases /the phase of highest
maximum being taken as psi=0/ of the 90d secondary period the same procedure
was applied as by Julia Balázs and Detre /1939/ for AR Herculis. From the
observed light curves the magnitudes were read off for a set of phi -
phases and these magnitudes were then plotted versus psi. In this way we
obtained a sequence of curves representing the variation in the light
curve for definite phi-phases as a function of psi.
For derivation of proper phi and psi-values the O-C diagrams must
first be constructed for both the fundamental and secondary periods. For C, the
elements of Balázs and Detre /1957/ were used, viz.
/J.D. /maximum light/ = 2417861,4292+0,468063203d E /I/
and
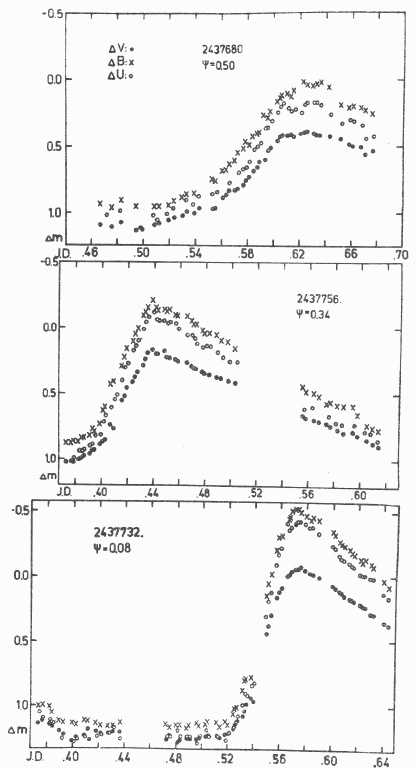 Figure 1 The observed light curves in UBV according to different
phase points of Blazhko period.
J. D. /brightest maximum/ = 2418060 + 90,12 x N. /II/ where E
and N are epoch counts in the respective periods. For each year the actual
fundamental and secondary periods were determined by using the O-C /I/ and
O-C /II/ curves. For instance the fundamental period obtained for 1961
/when the greatest number of observations were collected/ was
P = 2437327,692 + 0,468061103d E
and the secondary period
P_s = 2437359 + 92,12d . N.
The brightest maxima were chosen from every observational season and are
given in Table V. The O-C diagrams constructed for these maxima are shown
in Fig 2. They are typical for RR Lyrae stars having a secondary period and
their structure can be considered as resulting from the cumulative
effects of random period changes. Even so, the comparison of O-C/II/
reveals two important characteristics:
1. The long cycles resulting from cumulative effects of
random period changes are opposite in phase in the two diagrams. That is a
change in the secondary period is accompanied by an opposite change in the
fundamental period.
2. The changes expressed in units of the respective
period are much larger for the secondary period than for the main one.
These characteristics are especially conspicuous for RW Draconis and in
some respect also for RR Lyrae /see Detre, 1970/. They are considered to
be of fundamental importance for the interpretation of the secondary
period.
A few V = V /psi/_(phi =const) - diagrams are represented in
Fig. 3a.
The scatter in V is largely due to the random variations in the periods
which makes an exact determination of phi and psi impossible. This is proved
by the fact that the scatter is largest in the ascending branch, between
phases phi = 0,85 to 0,975, which part of the light curve is especially
sensitive to random phase variations.
Table V.
Observed maxima
J.D.
Year 2430000+ Delta Mv Delta Mb Delta Muv
1958 6229,6 +0,420 +0,120
6245,5 +0,290 -0,005
6282,5 +0,015 -0,390
1959 6655,6 +0,085 -0,300
6680,4 +0,385 +0,105
6684,6 +0,428 +0,100
6692,5 +0,372 +0,080
6724,4 -0,050 -0,460
1961 7327,7 +0,335 -0,015
7331,4 +0,295 -0,055
7339,- - -
7344,5 +0,060 -0,415
7345,5 +0,020 -0,435
7360,5 -0,060 -0,640
7365,6 -0,045 -0,525
7376,4 +0,010 -0,430
7395,6 +0,226 -0,175
7396,5 +0,255 -0,140
7397,4 +0,260 -0,130
7404,5 +0,365 -0,025
7411,5 +0,410 +0,045
7418,5 +0,345 0,00
7424,5 +0,260: -0,150
7456.- - -
7463,4 0,000 -0,470
1962 7652,5 -0,010 -0,375 -0,380
7680,6 -0,395 +0,035 +0,175
7702,6 +0,185 -0,250 -0,125
7732,6 -0,065 -0,510 -0,420
7756,4 +0,170 -0,190 -0,110
7769,5 +0,360 +0,050 -
7780,3 +0,365: -0,025 +0,040
7806,5 -0,010 -0,385 -0,280:
7808,4 -0,050 -0,445 -0,410
7815,4 -0,090 -0,500 -0,470
7829,5 -0,170 -0,560 -0,520:
1963 8003,6 -0,070 -0,500 -0,475
8019,5 +0,125 -0,265 -0,175
8047,6 - +0,130 +0,220
8085,5 - -0,450 -0,350
8086,4 - -0,445 -0,380
8090,6 - -0,400 -0,370
8114,5 - -0,138 -0,050
1964 8415,5 +0,325 -0,040 +0,100
8457,6 -0,090 -0,500 -0,360
8496,4 +0,350 0,000 +0,135
8503,5 +0,300 -0,055 +0,115
8548,4 -0,030 -0,520 -0,340
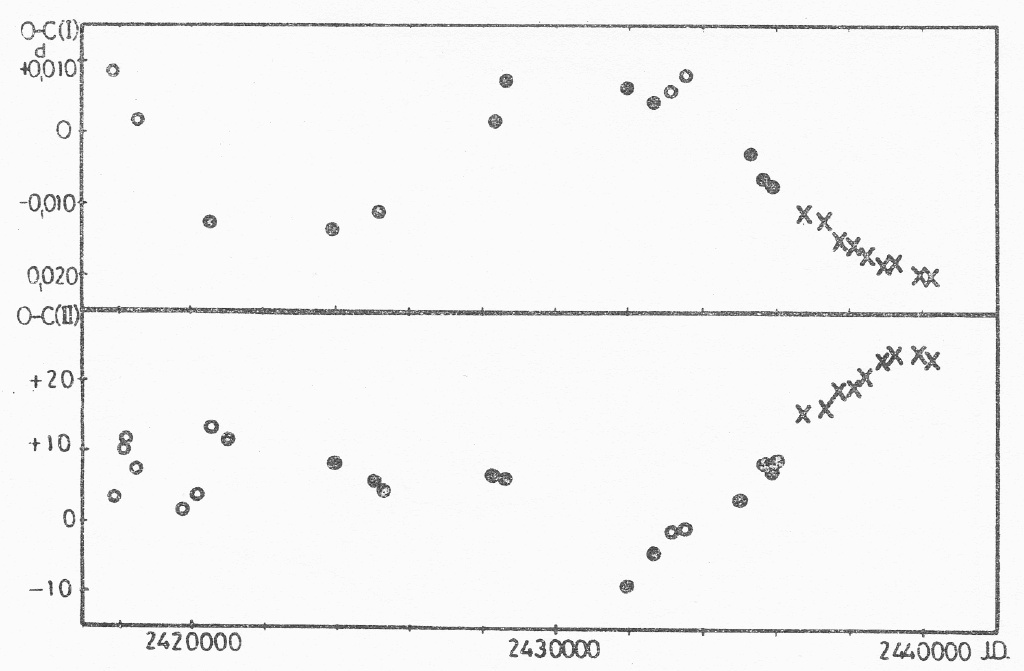 Figure 2
The O-C values for the fundamental O-C/I/ and for the secondary
periods O-C/II/
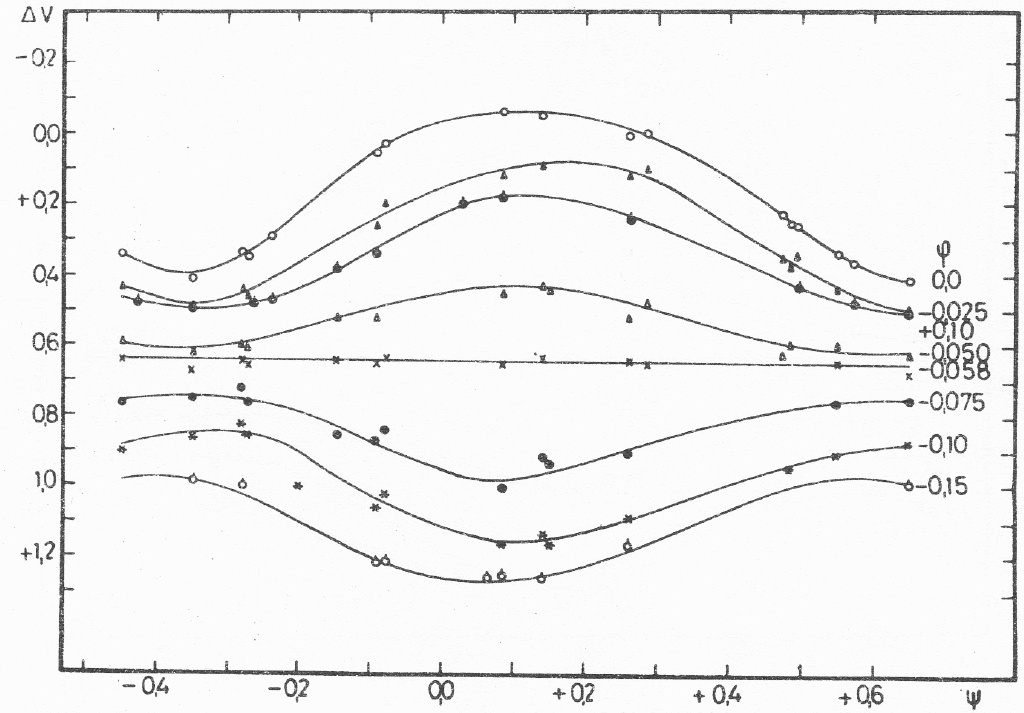 Figure 3a
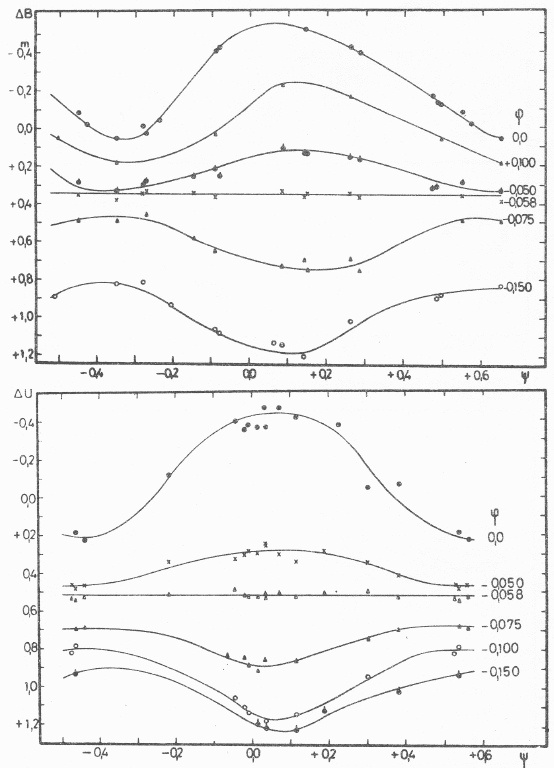 Figure 3
Similar marks on the diagram represent a certain phi phase value of
the fundamental period obtained from the light curves of different
Blazhko phase psi. Figures 3a,b,c are in Delta V, Delta B and
Delta U respectively.
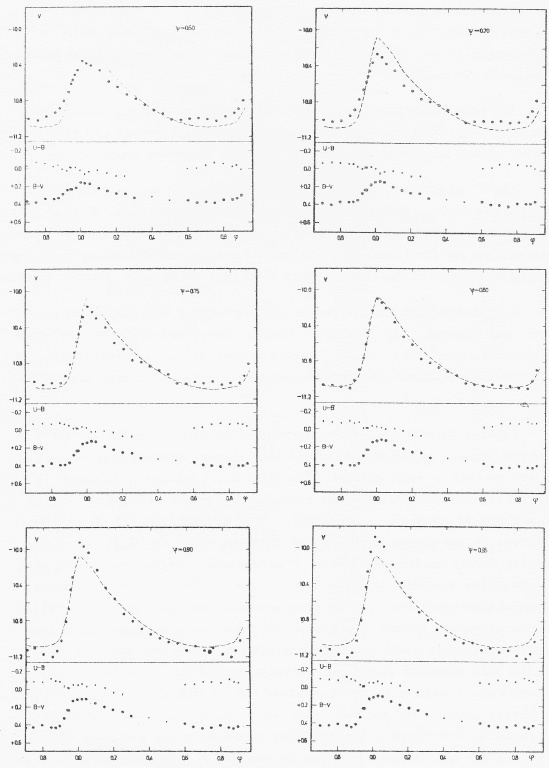 Figure 4
The diagram shows the flattened light curves of different secondary
period phase psi constructed from figures 3a,b,c.
The same procedure was carried out in B and U, as well /Fig.3b, 3c/
Using these curves the V /phi/_(psi=const') B-V /phi/_(psi=const) and
U-B /phi/_(psi=const) diagrams /Figs. 4a and b/ were constructed on which
all the following discussions are based.
The two-colour diagrams at different phases of the secondary
period are shown in Fig. 5. On the loops the phases of the main period
are also indicated. The dashed line is the relation for the main sequence
stars.
The V magnitudes and B-V colour indices at minimum light and maximum
light and the U-B ranges delta_2/ defined by Preston, Ann. Rev. of Astr.
and Astroph. Vol. 2, 1964/ are plotted versus psi in Fig. 6.
The V and B-V ranges are correlated and the values of V are more
strongly variable at maximum light than at minimum light as in the
case of other RR Lyrae stars with Blazhko effect.
Our photometric results are in good agreement with those obtained
by Preston and Spinrad /Ap. J. 147, 1025, 1967/. Nevertheless there are some
slight differences especially in the delta_2 values because accurate
observations in U-B could not be made under the unsatisfactory
observing conditions near Budapest.
Figures 7a and b show the amplitude variation Delta A of the m/psi/
curves and the phase psi of the maxima of the same curves plotted
against phi. Delta A have two maxima in each colour.
The first of the maxima is at phase phi = 0,90 on the ascending
branch and the second one - which is higher, is at the phase of the light
maximum / phi=0,00/. It is evident from the figure that the light curves do
not change significantly between the phi = 0,35 - 0,55 phase interval during
the Blazhko cycle, It is however, rather surprising that there is a very
deep minimum at phase 0,94 on the ascending branch between the two maxima
mentioned above. This deep minimum indicates that there exists a point on
the ascending branch which does not show any significant oscillation
during the Blazhko cycle while the ascending branch before and after it
and especially the light maximum shows considerable oscillation. It is
very interesting to compare our results with those obtained for AR
Herculis by Almár /1961/. The same curves obtained for AR Her, also show
double maxima but at other phases. The essential difference is that the
first maximum of AR Her, is higher than the second one and the deep
minimum is situated at the phase of light maximum.
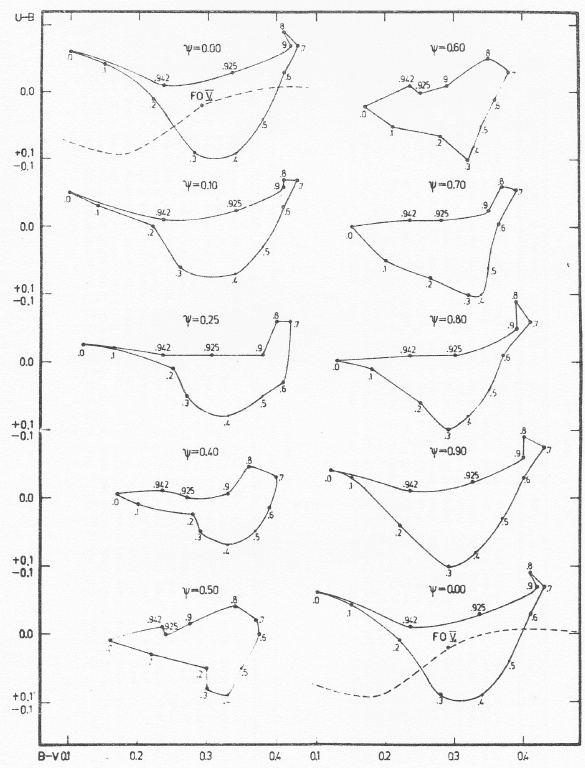 Figure 5
The two-colour diagrams at different phases of the secondary period.
The dashed line represents the main sequence.
Table VI./1
\phi 0,00 0,025 0,05 0,10 0,15 0,20 0,25 0,60 0,65 0,70 0,75 0,80 0,85 0,875 0,90 0,925 0,942 0,950 0,975
psi\
0,00 -0,050 -0,070 -0,050 -0,045 -0,025 0,020 0,040 -0,050 -0,040 -0,090 -0,080 -0,070 -0,100 -0,085 -0,075 -0,030 -0,010 -0,010 -0,50 0,00
0,05 -0,050 -0,065 -0,050 -0,035 -0,025 0,000 0,030 0,050 -0,025 -0,090 -0,080 -0,070 -0,090 -0,075 -0,075 -0,025 -0,010 -0,010 -0,050 0,05
0,10 -0,045 -0,060 -0,050 -0,030 -0,020 0,000 0,015 -0,040 -0,010 -0,085 -0,080 -0,070 -0,065 -0,070 -0,025 -0,010 -0,010 -0,050 0,10
0,25 -0,020 -0,030 -0,035 -0,010 0,010 0,020 0,000 0,000 0,025 -0,070 -0,075 -0,065 -0,020 -0,025 -0,030 -0,010 -0,010 -0,010 -0,030 0,25
0,40 0,000 0,000 0,000 0,000 0,040 0,040 0,010 0,010 0,020 -0,040 -0,060 -0,060 -0,010 -0,025 0,010 -0,010 -0,010 -0,015 0,40
0,50 0,020 0,030 0,020 0,005 0,050 0,060 0,060 0,000 0,010 -0,020 -0,050 -0,040 -0,020 -0,025 0,025 -0,010 -0,010 -0,005 0,50
0,60 0,020 0,065 0,040 0,025 0,050 0,080 0,080 0,000 0,000 -0,030 -0,060 -0,050 -0,020 -0,035 0,010 0,025 -0,010 -0,010 -0,010 0,60
0,70 0,000 0,050 0,035 0,030 0,040 0,080 0,080 -0,010 -0,015 -0,060 -0,065 -0,055 -0,050 -0,050 -0,020 0,000 -0,010 -0,010 -0,020 0,70
0,75 -0,015 0,020 0,020 0,015 0,030 0,075 0,075 -0,020 0,025 -0,060 -0,070 -0,60 -0,070 -0,060 -0,040 -0,010 -0,010 -0,010 -0,030 0,75
0,80 -0,025 -0,010 0,000 -0,005 0,015 0,070 0,070 -0,030 -0,035 -0,070 -0,075 -0,065 -0,090 -0,070 -0,070 -0,010 -0,010 -0,035 0,80
0,90 -0,040 -0,050 -0,030 -0,045 -0,010 0,040 0,060 -0,050 -0,050 -0,085 -0,080 -0,070 -0,110 -0,085 -0,075 -0,025 -0,010 -0,010 -0,045 0,90
0,95 -0,050 -0,065 -0,040 -0,045 -0,020 0,030 0,050 -0,060 -0,050 -0,090 -0,085 -0,075 -0,110 -0,090 -0,075 -0,025 -0,010 -0,010 -0,050 0,95
Table VI./2
\phi 0,00 0,025 0,05 0,10 0,15 0,20 0,25 0,30 0,40 0,50 0,60 0,65 0,70 0,75 0,80 0,85 0,875 0,90 0,925 0,942 0,950 0,975
psi\
0,00 0,100 0,100 0,090 0,150 0,185 0,220 0,240 0,280 0,339 0,387 0,395 0,420 0,430 0,435 0,410 0,430 0,440 0,420 0,335 0,235 0,235 0,125 0,00
0,05 0,90 0,095 0,085 0,150 0,185 0,220 0,240 0,275 0,345 0,384 0,400 0,420 0,435 0,440 0,415 0,430 0,435 0,420 0,340 0,235 0,235 0,125 0,05
0,10 0,090 0,095 0,080 0,150 0,180 0,220 0,240 0,260 0,345 0,382 0,400 0,420 0,435 0,400 0,415 0,430 0,430 0,415 0,340 0,235 0,235 0,125 0,10
0,25 0,120 0,115 0,125 0,165 0,205 0,250 0,270 0,270 0,353 0,360 0,410 0,410 0,425 0,425 0,400 0,415 0,395 0,380 0,305 0,235 0,235 0,150 0,25
0,40 0,160 0,160 0,180 0,200 0,260 0,315 0,300 0,285 0,366 0,344 0,390 0,400 0,390 0,400 0,360 0,375 0,350 0,330 0,250 0,235 0,235 0,205 0,40
0,50 0,170 0,175 0,185 0,225 0,260 0,300 0,300 0,310 0,338 0,350 0,375 0,370 0,360 0,380 0,340 0,340 0,315 0,275 0,230 0,235 0,235 0,240 0,50
0,60 0,160 0,165 0,170 0,220 0,250 0,280 0,280 0,325 0,313 0,355 0,350 0,380 0,370 0,385 0,345 0,345 0,330 0,290 0,245 0,235 0,235 0,215 0,60
0,70 0,150 0,140 0,150 0,200 0,235 0,265 0,270 0,325 0,324 0,348 0,355 0,390 0,390 0,405 0,370 0,375 0,370 0,350 0,275 0,235 0,235 0,180 0,70
0,75 0,145 0,130 0,135 0,190 0,225 0,255 0,260 0,320 0,326 0,337 0,360 0,390 0,400 0,410 0,380 0,395 0,395 0,370 0,285 0,235 0,235 0,160 0,75
0,80 0,135 0,120 0,125 0,180 0,215 0,250 0,260 0,310 0,314 0,340 0,370 0,400 0,415 0,415 0,390 0,410 0,410 0,390 0,300 0,235 0,235 0,150 0,80
0,90 0,120 0,110 0,110 0,160 0,200 0,230 0,250 0,300 0,322 0,360 0,380 0,415 0,435 0,425 0,400 0,425 0,435 0,410 0,325 0,235 0,235 0,130 0,90
0,95 0,110 0,100 0,100 0,155 0,195 0,225 0,250 0,290 0,340 0,367 0,390 0,420 0,430 0,430 0,410 0,430 0,445 0,415 0,335 0,235 0,235 0,125 0,95
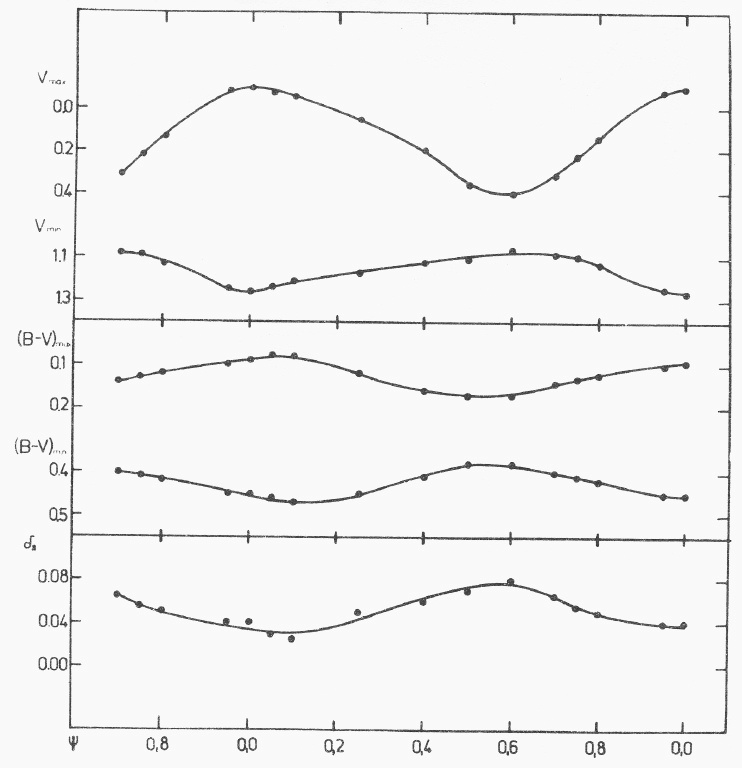 Figure 6
The curves show typical variation of V_max, V_min, /B-V/_max,
/B-V/_min and delta_2 Preston index, during the secondary period.
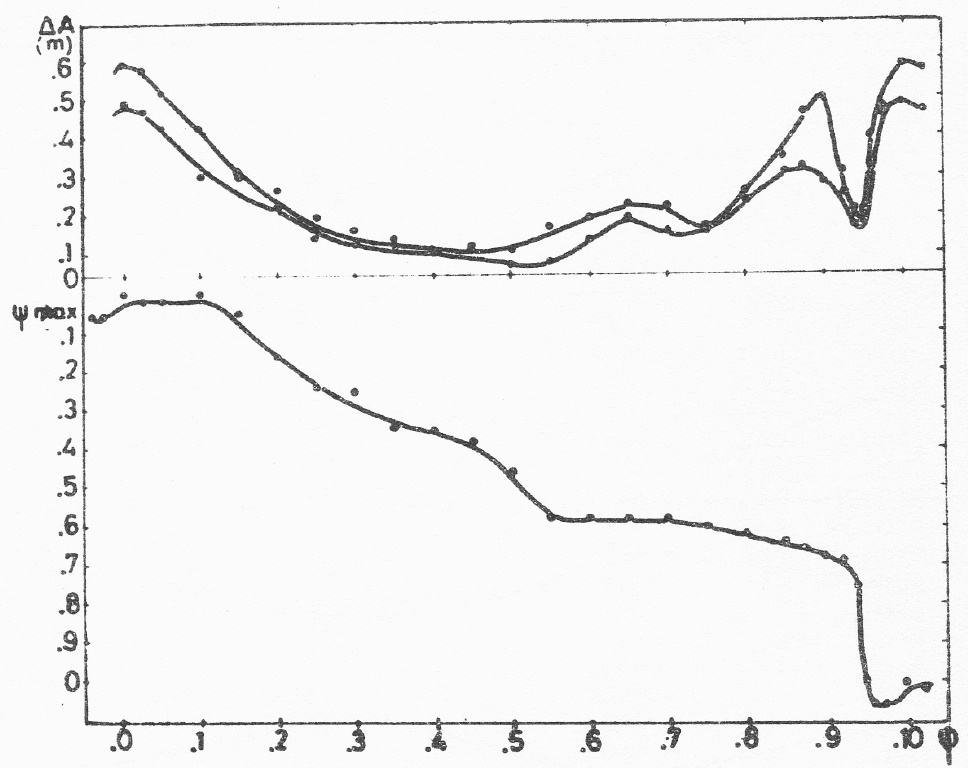 Figure 7a
 shows the amplitudes of light curves belonging to different
phases phi of figures 3a and 3b.
Figure 7b
Psi_max points show the psi secondary phase of maxima of phi phase
curves in the figure 3.
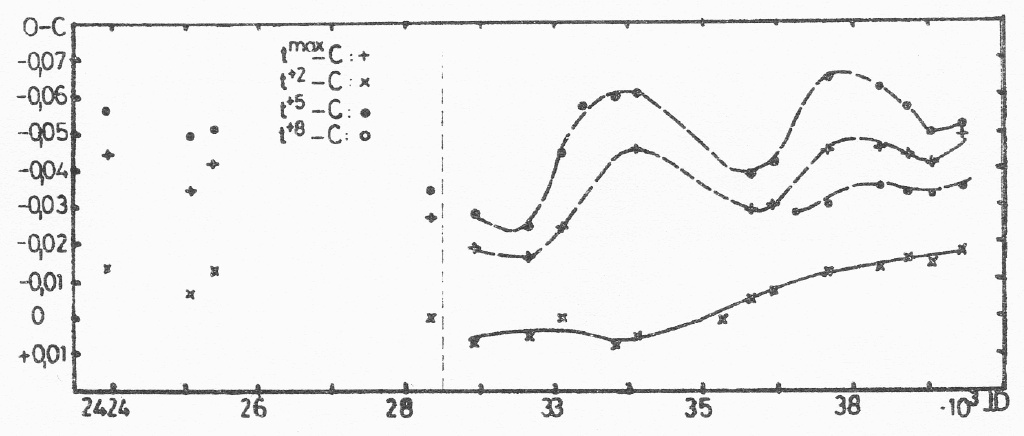 Figure 8
The O-C secular variations of three magnitude levels of the ascending
branch of the main period.
This may be connected with the behaviour of the double light maximum
of AR Her which appears at certain phases of the secondary period while no
double maximum can be observed for RV UMa. The most important theoretical
consequence of the fact that there is no oscillation on a certain phase
point of the ascending branch of RV UMa during the Blashko period suggests
that the fundamental and the secondary period can not arise due to two
beat periods. That is to say in the case of superposition of beat periods
the ascending branch of the main period would need to oscillate to produce
the required effect in each of its phase points during the Blazhko period.
Figure 8 shows the /O-C/ secular variation of three magnitude levels
of the ascending branch of the main period. The /O-C/ variations of the
magnitude levels m:0,8, 0,5, 0,3 are cyclic and coincident with each
other. The length of the cycle is approximately 6-8 years. The cyclic
variation of these fixed magnitude points of the ascending branch is due
to the secular cyclic variation of the light curve form. When the /O-C/ is
more positive, the rising branch of the light curve is always steeper
during the secondary period and vice versa; the less positive the /O-C/
variation the more sinusoidal in form the light curve.
Whatever the cause of the cyclic variation of the light curve form,
the length of this cyclic variation of RV UMa is commensurable with that of
RR Lyrae. However, this length of cyclic variation corresponds to
the magnitude of the magnetic solar cycle therefore the suspicion that
the cyclic variation is a magnetic variation of the variable star,
as suggested by Detre, seems reasonable.
TABLE VII.
Year E t^max t^max-C t^+2-C t^+5-C
243 ...
1958 39243 6229,6210 -0,0125 -0,0255 -
39277 6245,5425 -0,0510 -0,0261 -0,0411
39356 6282,5095 -0,0151 -0,0316 -0,0391
1959 40153 6655,5540 -0,0170 -0,0360 -0,0435
40206 6680,3650 -0,0133 -0,0318 -0,0483
40215 6684,5810 -0,0099 -0,0229 -0,0454
40232 6692,5450 -0,0030 -0,0215 -0,0425
40300 6724,3630 -0,0133 -0,0373 -
1961 41589 7327,6970 -0,0127 -0,0317 -0,0497
41597 7331,4425 -0,0118 - -
41614 7339,- - -0,0343 -0,0443
41625 7344,5470 -0,0130 -0,0355 -0,0420
41627 7345,4860 -0,0102 -0,0352 -0,0442
41644 7353,4430 - -0,0357 -0,0407
41655 7358,5940 -0,0079 -0,0359 -0,0459
41659 7360,4650 -0,0092 -0,0390 -0,0427
41670 7365,6125 -0,0104 -0,0363 -0,0414
41674 7367,4825 -0,0126 - -
41676 7368,4180 -0,0132 - -
41689 7374,5040 -0,0121 - -
41693 7376,3725 -0,0113 -0,0373 -0,0423
41734 7395,5600 -0,0189 -0,0394 -0,0479
41736 7396,4970 -0,0180 -0,0375 -0,0500
41738 7397,4350 -0,0162 - -
41749 7402,5880 -0,0119 -0,0324 -0,0485
41753 7404,4570 -0,0151 - -
41768 7411,4775 -0,0156 -0,0309 -0,0526
41783 7418,5020 -0,0120 -0,0300 -0,0515
41796 7424,5870 -0,0118 -0,0333 -0,0463
41864 7456,- - -0,0363 -0,0411
41869 7463,4365 -0,0116 -0,0366 -0,0411
t^+8-C t t-C N psi Delta B^max Delta B^min C
- 0,594 -0,0395 201 0,616 +0,120 - ,6335
- 0,513 -0,0346 201 0,792 -0,005 - ,5476
- 0,4895 -0,0351 202 0,203 -0,390 - ,5246
-0,0525 0,5313 -0,0397 206 0,342 -0,300 +0,850 ,5710
-0,0833 0,340 -0,0383 206 0,618 +0,105 - ,3783
-0,0684 0,5535 -0,0374 206 0,664 +0,100 +0,880 ,5909
-0,0730 0,5135 -0,0345 206 0,752 +0,080 +0,910 ,5480
- - - 207 0,106 -0,460 - ,3763
-0,0817 0,6675 -0,0422 213 0,800 -0,015 +0,975 ,7097
- - - 213 0,842 -0,055 - ,4543
- 0,3700 -0,0413 213 0,932 - - ,4113
-0,0540 0,5205 -0,0395 213 0,988 -0,415 +1,065 ,5600
-0,0542 0,4574 -0,0388 213 0,999 -0,435 +1,075 ,4962
- 0,415 -0,0382 214 0,089 - - ,4532
-0,0559 0,5595 -0,0424 214 0,143 -0,490 +1,050 ,6019
-0,0507 0,4300 -0,0442 214 0,164 -0,640 +1,075 ,4742
-0,0489 0,5845 -0,0384 214 0,221 -0,525 +1,210 ,6229
- - - 214 0,242 - - ,4951
- - - 214 0,252 - - ,4312
- - - 214 0,320 - - ,5161
-0,0533 0,348 -0,0403 214 0,341 -0,430 +0,990 ,3883
- 0,5345 -0,0444 214 0,553 -0,175 - ,5789
-0,0700 0,470 -0,0450 214 0,564 -0,140 +0,950 ,5150
- - - 214 0,574 -0,130 +1,025 ,4512
-0,0709 -0,5585 -0,0414 214 0,631 -0,090 +0,925 ,5999
- - - 214 0,652 -0,025 - ,4721
-0,0801 0,4505 -0,0426 214 0,730 +0,045 +0,900 ,4931
-0,0765 0,4705 -0,0435 214 0,808 0,000 +0,950 ,5140
-0,0678 0,5578 -0,0410 214 0,876 -0,150 +1,000 ,5988
-0,0483 0,3872 -0,0399 215 0,230 - +1,180 ,4271
-0,0485 0,4090 -0,0391 215 0,307 -0,470 - ,4481
TABLE VII.(cont.)
Year E t^max t^max-C t^+2-C T^+5-C t^+8-C
243
1962 42283 7652,5275 -0,0181 - - -
42343 7680,6100 -0,0194 -0,0294 -0,0509 -0,0819
42390 7702,6165 -0,0134 -0,0334 -0,0422 -0,0584
42454 7732,5720 -0,0124 -0,0354 -0,0429 -0,0494
42505 7756,4390 -0,0166 -0,0371 -0,0501 -0,0641
42533 7769,5440 -0,0189 -0,0309 -0,0484 -0,0664
42556 7780,3100 -0,0169 -0,0299 - -
42612 7806,5270 -0,0114 -0,0334 -0,0406 -0,0494
42616 7808,3970 -0,0137 -0,0357 -0,0437 -0,0527
42627 7813,5415 -0,0194 -0,0324 -0,0364 -0,0434
42631 7815,4210 -0,0106 -0,0346 -0,0391 -0,0471
42661 7829,4600 -0,0135 -0,0370 -0,0430 -0,0490
1963 43031 8003,6475 -0,0094 -0,0354 -0,0405 -0,0519
43067 8019,500 -0,0152 - - -
43127 8047,5805 -0,0185 -0,0230 -0,0470 -
43208 8085,4910 -0,0131 -0,0331 -0,0386 -0,0481
43210 8086,4295 -0,0107 -0,0337 -0,0373 -0,0457
43219 8090,6390 -0,0138 -0,0346 -0,0398 -0,0453
43270 8114,5050 -0,0190 -0,0355 -0,0442 -0,0558
1964 43913 8415,4750 -0,0171 -0,0320 -0,0501 -
44003 8457,5975 -0,0168 -0,0388 -0,0427 -0,0518
44086 8496,4400 -0,0211 -0,0376 -0,0598 -0,0836
44101 8503,4750 -0,0160 -0,0345 -0,0540 -
44197 8548,4035 -0,0151 -0,0331 - -
t t-C N psi Delta B^max Delta B^min C
- - 217 0,405 -0,375 - ,5456
0,5880 -0,0414 217 0,716 +0,035 +1,010 ,6294
0,5895 -0,0389 217 0,961 -0,250 - ,6284
0,5445 -0,0399 218 9,293 -0,510 +1,145 ,5844
0,4105 -0,0451 218 0,559 -0,190 +0,920 ,4556
0,5205 -0,0409 218 0,704 +0,050 - ,5614
- - 218 0,822 -0,025 - ,3269
0,5008 -0,0376 219 0,113 -0,385 +1,050 ,5384
0,3720 -0,0387 219 0,134 -0,445 +1,150 ,4107
0,5240 -0,0354 219 0,192 -0,385 +1,200 ,5594
0,3940 -0,0376 219 0,212 -0,500 - ,4316
0,4330 -0,0405 219 0,368 -0,560 +0,975 ,4745
0,6190 -0,0379 221 0,301 -0,500 - ,6569
- - 221 0,477 -0,265 - ,5079
0,5505 -0,0405 221 0,489 +0,130 - ,5910
0,4675 -0,0366 222 0,209 -0,450 +1,260 ,5041
0,4066 -0,0336 222 0,220 -0,445 +1,150 ,4402
0,6150 -0,0378 222 0,265 -0,400 +1,160 ,6528
0,4826 -0,0414 222 0,420 -0,138 - ,5240
0,4458 -0,0428 225 0,871 -0,040 +0,900 ,4886
0,5740 -0,0430 226 0,338 -0,500 +1,150 ,6143
0,4125 -0,0511 226 0,769 0,000 - ,4636
0,4377 -0,0468 226 0,847 -0,055 - ,4845
- - 227 0,346 -0,520 - ,4186
TABLE VIII.
A^m-phi , CI_phi and psi^max-phi of RV UMa
1958 - 64 years
phi Delta A^v Delta A^b Delta A^uv Delta /B-V/ Delta /U-B/ psi^max
0,000 +0,490 +0,590 +0,635 +0,135 +0,260 0,00
0,025 +0,470 +0,580 +0,585 +0,110 +0,350 0,02
0,050 +0,425 +0,515 +0,530 +0,125 +0,290 0,02
0,100 +0,300 +0,425 +0,420 +0,140 +0,145 0,00
0,150 +0,300 +0,310 +0,350 +0,140 +0,130 0,05
0,200 +0,220 +0,260 +0,210 +0,130 +0,100 0,16
0,250 +0,195 +0,140 +0,200 +0,125 +0,165 0,24
0,300 +0,125 +0,160 +0,200 +0,090 +0,255 0,25
0,350 +0,125 +0,140 - +0,070 +0,220 0,34
0,400 +0,105 +0,110 - +0,060 +0,220 0,35
0,450 +0,115 +0,110 - - - 0,38
0,500 +0,075 +0,110 - +0,050 +0,135 0,46
0,550 +0,080 +0,170 - - - 0,58
0,600 +0,135 +0,195 - +0,095 +0,210 0,58
0,650 +0,195 +0,225 - - - 0,58
0,700 +0,160 +0,220 - +0,150 +0,140 0,58
0,750 +0,165 +0,160 +0,200 +0,105 +0,220 0,60
0,800 +0,235 +0,260 +0,218 +0,125 +0,170 0,62
0,850 +0,310 +0,350 +0,300 +0,160 +0,135 0,64
0,875 +0,325 +0,465 +0,350 +0,110 +0,235 0,66
0,900 +0,285 +0,500 +0,440 +0,240 +0,160 0,68
0,925 +0,255 +0,310 +0,225 +0,190 +0,070 0,69
0,940 +0,175 +0,220 +0,160 +0,310 +0,190 0,75
0,950 +0,185 +0,210 +0,190 +0,070 +0,090 0,00
0,960 +0,320 +0,400 +0,360 +0,220 +0,215 0,06
0,975 +0,460 +0,480 +0,545 +0,110 +0,220 0,06
REFERENCES
/1/ AN 176. 109, 1907
/2/ AN 177. 107, 1908
/3/ Allegheny Publ. VII. p.40.
/4/ AN 231. 153. 1927.
/5/ Budapest Mitt. Nr. 34. CoKon 34
/6/ Ap.J. 130, 507, 1959.
/7/ Per.zvj. 9.No.4. 1953.
/8/ Ap.J. 117. 313.
/9/ Astron.techn. 1962. p. 203.
/10/ Budapest Mitt. Nr. 8 /1939/ CoKon 8
/11/ Budapest Mitt. Nr. 51. /1961./ CoKon 51
/12/ Ap.J. 147. 1025. 1967.
Table 4.