DISTRIBUTION OF STARS OF SPECTRAL TYPES EARLIER THAN F7 AROUND IC 4665 ABSTRACT A study was made of the spatial distribution of early type stars in a region of intermediate galactic latitude. Objective prism plates were used to survey an area of 19.5 sq.deg around the cluster IC 4665 for all stars of spectral types earlier than F7 down to 12.5m photographic magnitude. 427 stars were detected, for which spectral types and photographic UBV colours were obtained. Different amounts of interstellar reddening were derived for the l<30deg and l>30deg parts of the region. Separate absorption correction was made for each of the parts. The stars were divided into four groups: spectral type A1 and earlier, A2 - A7, A8 - F2 and F3 - F7, and the space densities were determined for each group. The shape of the space density curve of the A2 - A7 stars reveals the existence of two kinematic subgroups. The velocity dispersions characterizing these two subsystems have a ratio of 1:1.6. The interpretation of space density curves of stars earlier than A2 in terms of such subgroups faces difficulties because of the possible photometric distance scale error and the interference with the Gould belt. INTRODUCTION The logarithmic density of A type stars plotted against distance from the galactic plane displays an inflection point. It is difficult to reconcile this point with a pure Gaussian velocity distribution assuming the stars to be distributed in plane parallel layers (Woolley, 1965). Oort (1932) wrote in his classical paper "that the velocity distribution is usually found to deviate somewhat from Gaussian distribution. However it can always be represented by a sum of two or three Gaussian components with different moduli." Later van Rhijn (1960) suggested that the dispersion in the linear velocity of A type stars increases with distance from the galactic plane. He claimed that two groups of A type stars with different dispersions can be found. Space density curves displaying these characteristics have been published, for instance, by Kurochkin (1958), Upgren (1962, 1963), Woolley and Steward (1967), Borzov (1973) and Balazs (1975, hereafter referred to as Paper I). Balazs found that plotting the density ratios at z=0 of the two subsystems versus spectral type a jump can be seen on the curve at spectral type A0. He interpreted this characteristic as a consequence of the discontinuous generation of stars and derived the time difference between the two birth events by the lifetime of stars at which the jump appeared on the curve. The possible cosmogonical significance of this jump on the curve needs further investigations using homogeneous stellar samples observed in different galactic directions to avoid misinterpretations of incomplete and inhomogeneous data. The aim of the present work is to continue the investigation to get an overall picture about the spatial density distribution of stars with different spectral types around the Sun at intermediate galactic latitudes. OBSERVATIONAL MATERIAL An area of 19.5sq.deg centred on l^II=30.74deg, b^II=15.98deg (alpha=17h48m, delta=5deg 20') was investigated. The observations were carried out with the 60/90/180 cm Schmidt telescope of the mountain station of Konkoly Observatory. Spectral types and UBV colours were obtained for 427 stars brighter than 12.5m photographic magnitude. The spectral types are based on three objective prism plates taken with a 5deg UBK 7 (UV transmitting) prism that gives a dispersion of 580 A/mm at H_gamma. Kodak IIa-O emulsions were used and the widening was 18", equivalent to 0.16 mm on the plate. The plates were made with double exposures of 6m and 24m, so that any systematic variations in the classification with photographic density could be estimated. The UBV photometry is based on five plates in B and in U and on four plates in V. The emulsion types, filters and exposure times used are given in the following table: emulsion filter exp. time U Kodak 103a-O Schott UG1 2mm 10m B Kodak 103a-O Schott GG13 2mm 5m V Kodak 103a-D Schott GG14 2mm 4m The relationships between the international system and the instrumental system are given by the following equations: V_instr = V - 0.16(B-V) + 0.10 (B-V)_instr = 1.05(B-V) - 0.02 (U-B)_instr = 1.01(U-B) + 0.11(B-V) - 0.03 The plates were measured with Konkoly Observatory's Cuffey type iris photometer. The photoelectric sequence given by Alcaino (1965) was partly used and the four faintest stars were obtained with Konkoly Observatory's 50 cm Cassegrain telescope. The mean errors of the photographically determined colours are +-0.07 +-0.06 and +-0.05 for U,B and V, respectively. The spectral classification was based on the criteria given by Stock and Slettebak (1959), Stock (1971) and Seitter (1975). The classification using small scale spectra, however, is somewhat uncertain with late B and early A type stars because the hydrogen lines dominating the spectra of these stars reach their maximum strength and show little change with spectral type. Therefore an independent method, the Q method of Becker (1963) was used to determine the spectral types of stars earlier than A0. After getting the colours of stars, Q = (U-B)- 0.72(B-V) values, were calculated and spectral types were estimated. The differences between the spectral classes obtained by the two different methods were, except for a few cases, less than two subclasses. Finally the arithmetic mean of these two spectral classes was used.
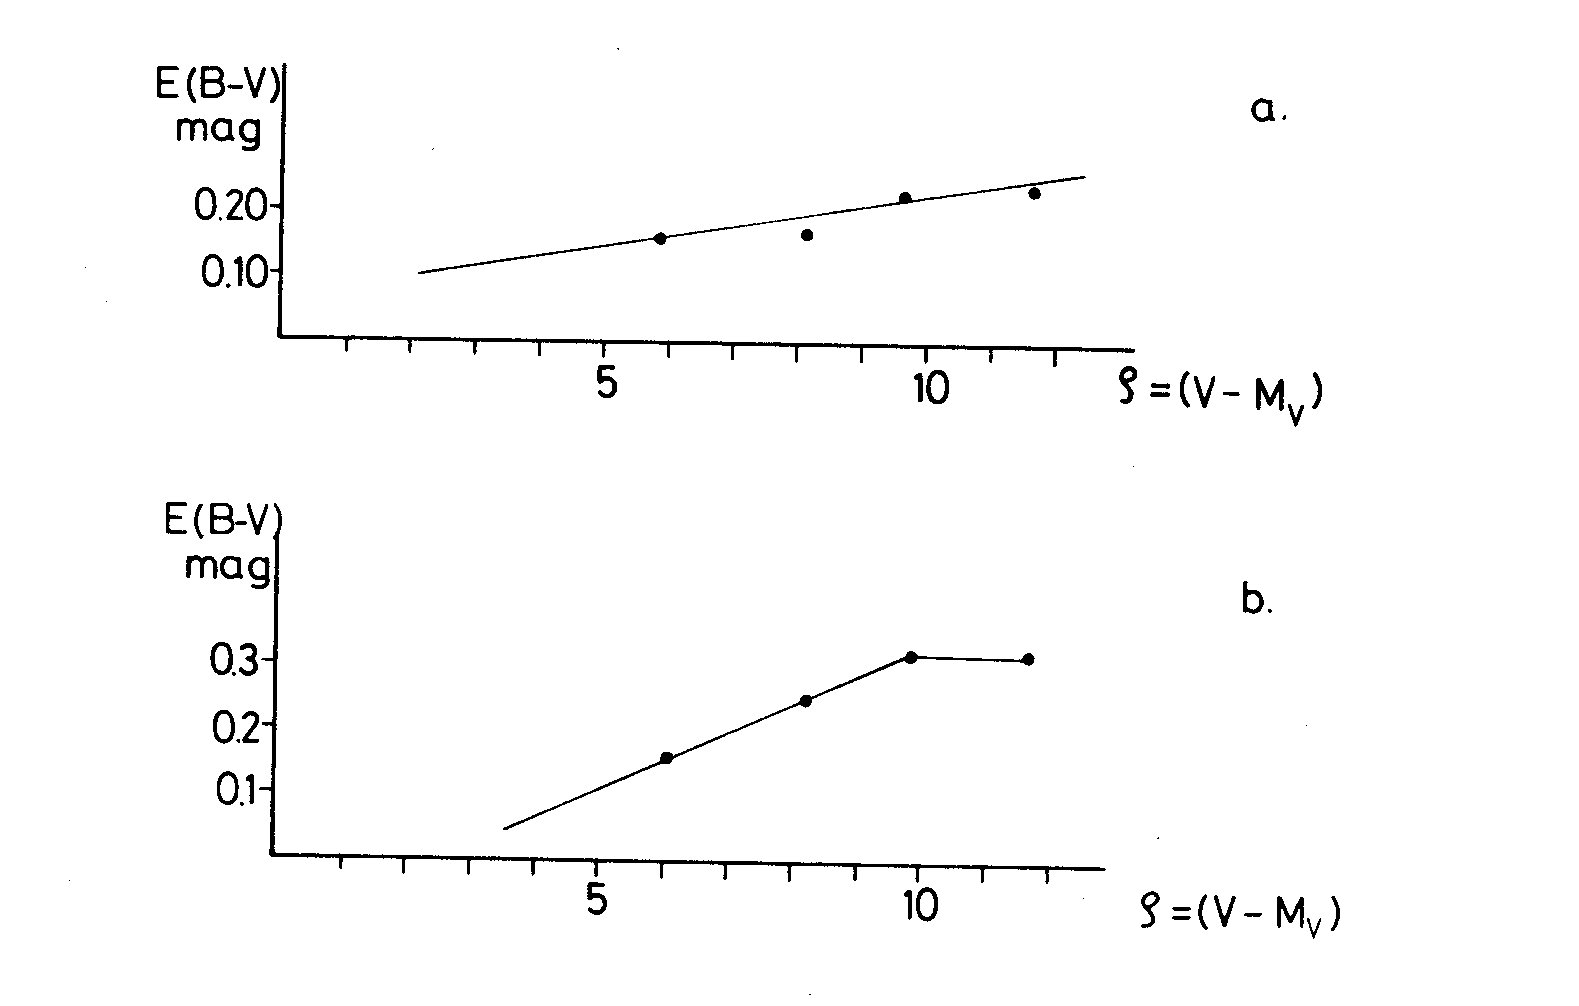 Fig. 1a-b The colour excesses (E_B-V) as functions of uncorrected
distance moduli. ( a: l>30deg, b: l<30deg)
INTERSTELLAR REDDENING
Adopting Allen's (1973) relation between intrinsic colour index and
spectral type, the E_B-V and E_U-B colour excesses were obtained.
Allen's relation between absolute magnitude and spectral type was used
to compute the distance modulus for each star. The stars were divided into
four groups according to their distance modulus: <7m, 7m-9m, 9m-11m
and >11m. The mean distance modulus and the colour excesses were determined
for each subgroup. The distribution of interstellar matter is inhomogeneous
in this field. FitzGerald (1968) has shown that the l^II<30deg, b=15deg
and l^II>30deg, b=15deg fields have different amounts of absorption.
Up to 1500 pc for the former field he obtained 0.3<=E_y<0.6,
for the latter one till 1000 pc the value 0.1<= E_y<0.2 is given.
Adopting this result a line at l^II=30deg, parallel to the galactic axis
was drawn on the plate and the absorption was determined separately on
both sides of this line. The colour excesses determined by this method
are plotted in Fig. 1/b for the l^II<30deg side and Fig. 1/a for the
l^II>30deg side of the line, as a function of the distance modulus. It can
be seen from this figure that a more dense absorbing material is
situated on the l^II<30deg side of the plate. The cluster IC 4665 has a
distance modulus of 7.8m according to Alcaino (1965). The E_B-V = 0.17m
value at a distance modulus of 7.8m obtained from Fig. 1/a is in good
agreement with E_B-V = 0.152m given by Alcaino and with E_B-V = 0.17m
given by Hogg and Kron (1955). Adopting E_B-V from Fig. 1/a and 1/b and
a ratio of total to selective absorption equal to 3.0, the magnitudes
were corrected for the absorption.
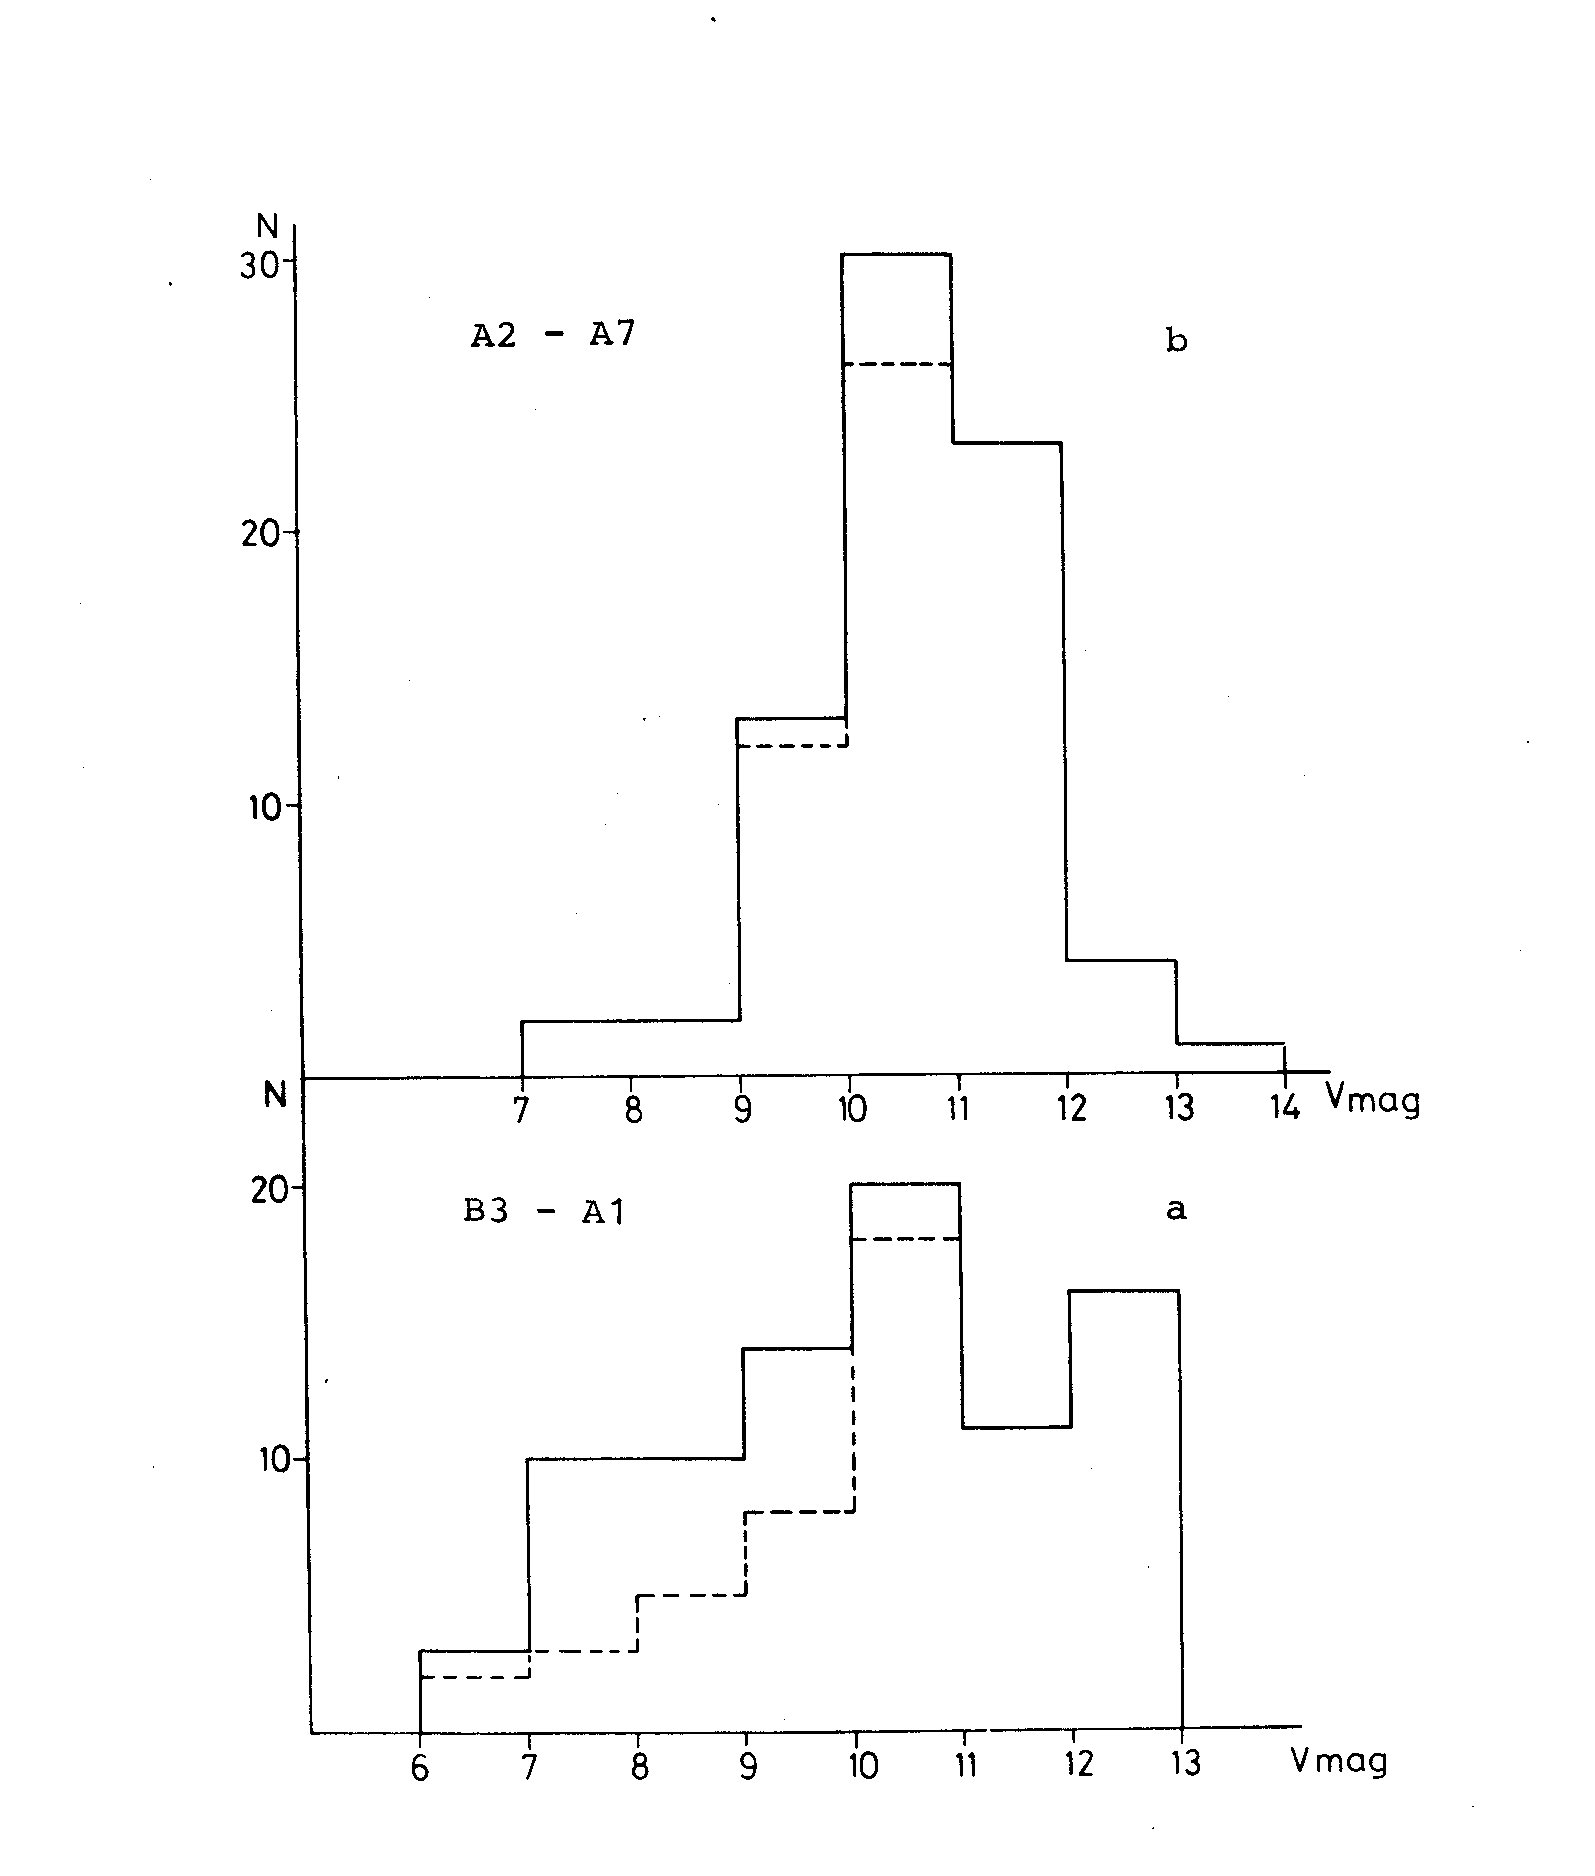 Fig. 2a-b The distributions of stars against the V magnitudes.
Dashed lines indicate the corresponding distributions
after excluding the cluster members of IC 4665.
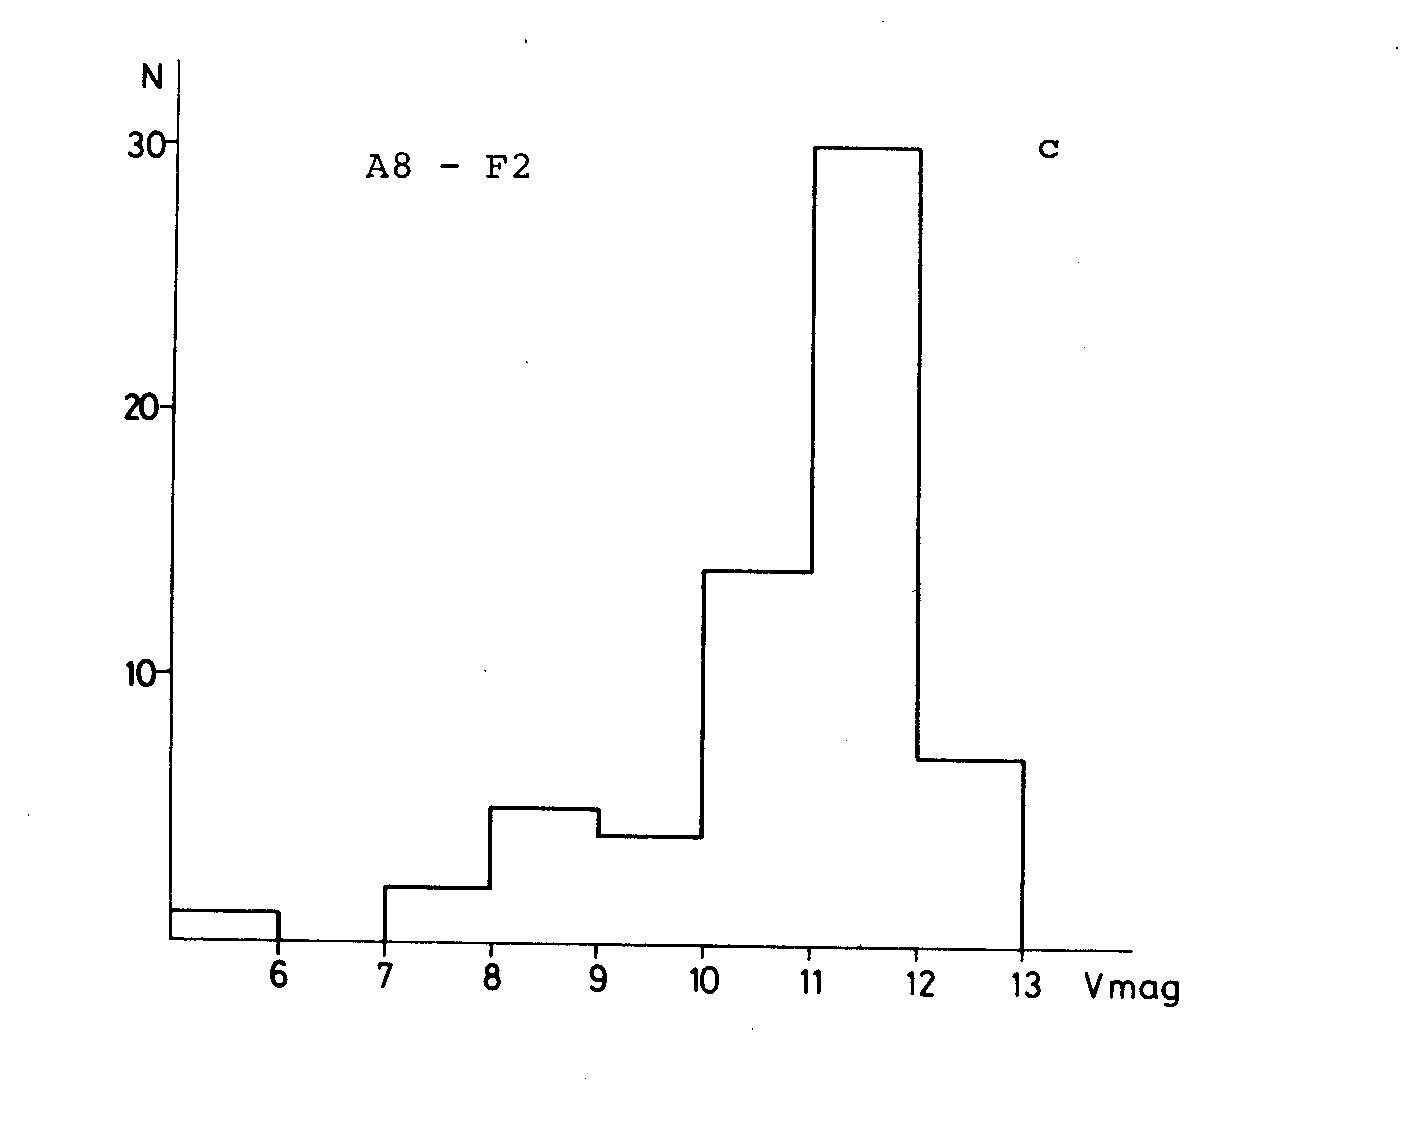 Fig. 2c The distribution of stars against the V magnitude.
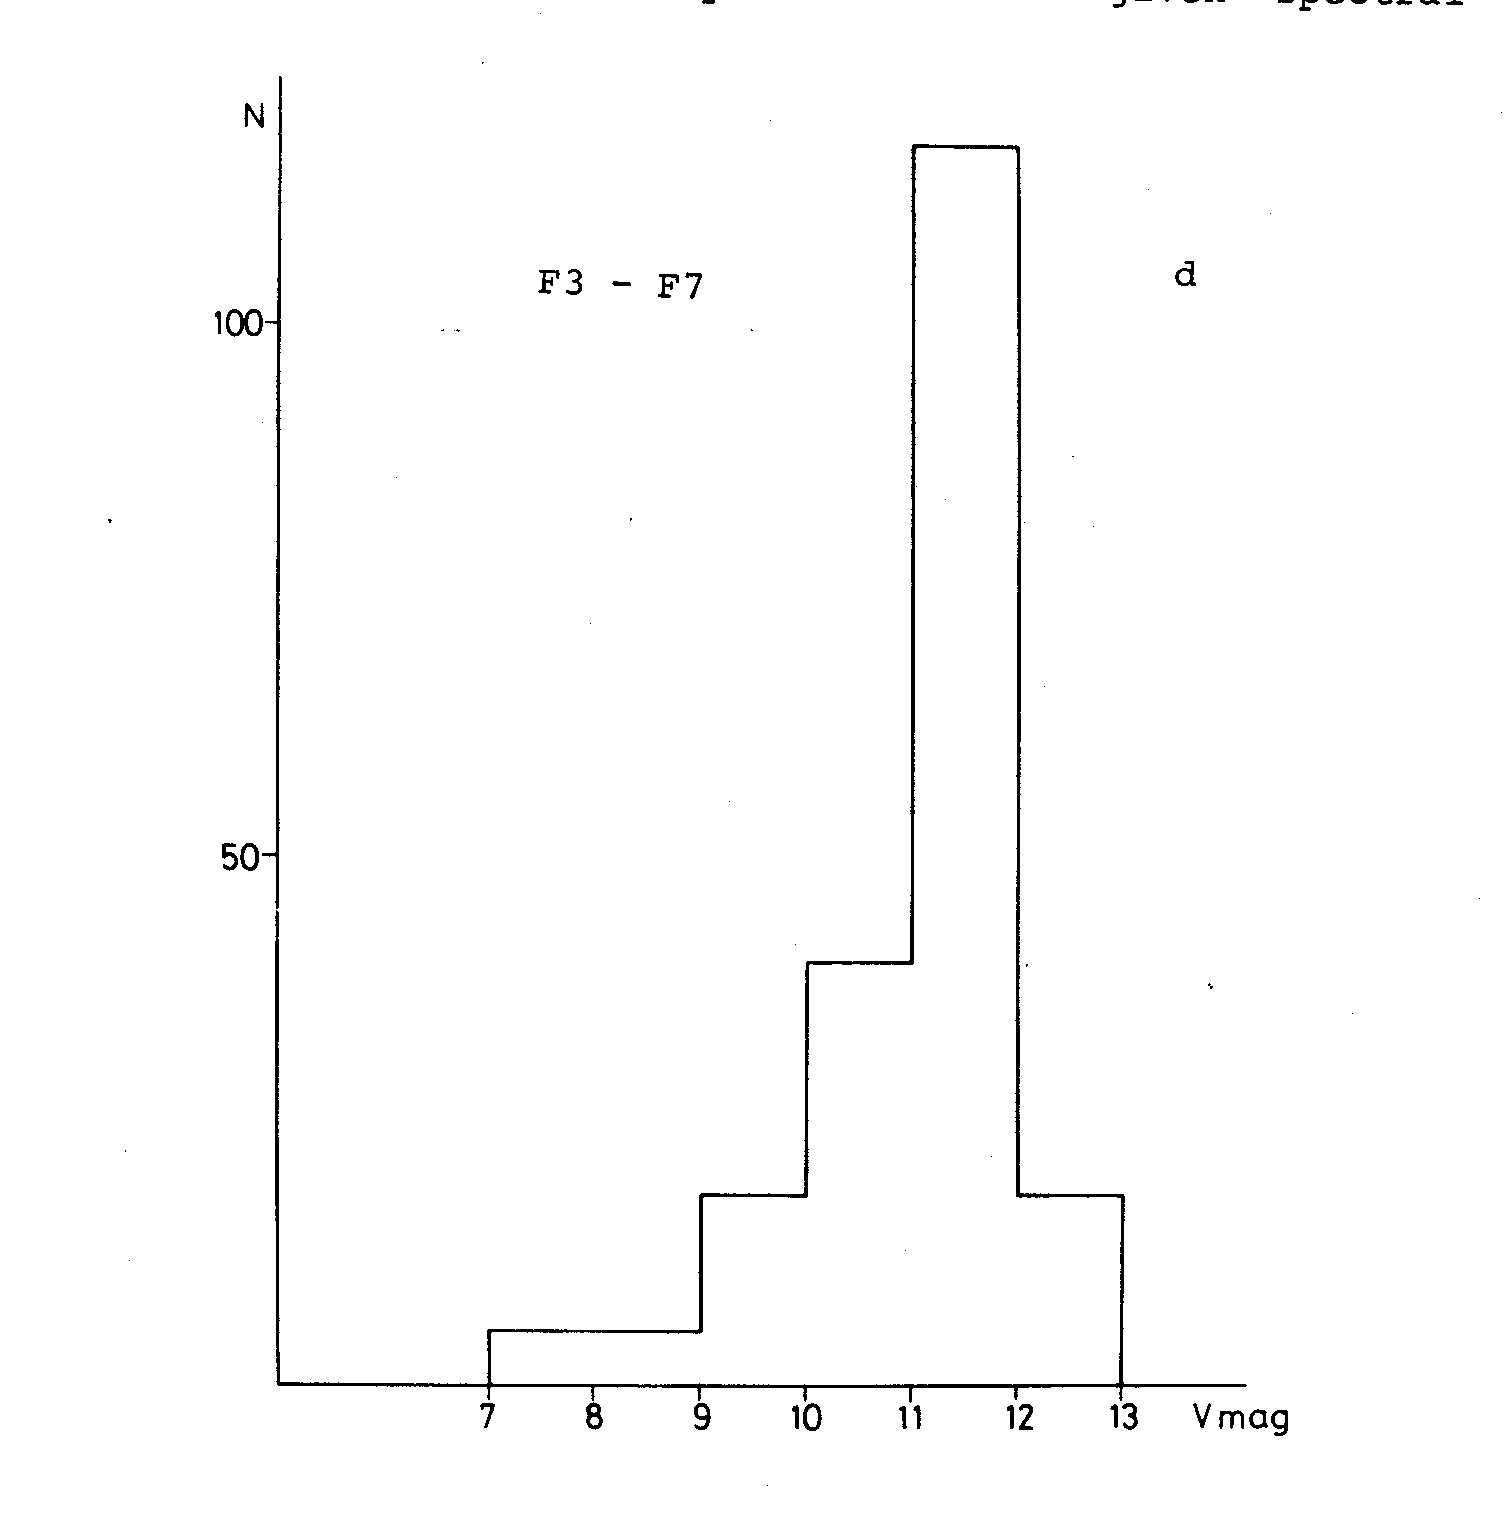 Fig. 2d The distribution of stars against the V magnitude.
THE SPACE DISTRIBUTION OF STARS
The limiting magnitude of our plates is generally 12.5m. Based on the
sharpness of classificational criteria and on the number of stars in each
subclass four subgroups were separated: stars earlier than A2, A2 - A7,
A8 - F2 and F3 - F7. The distribution of stars against the V measured magnitude
in the given subgroups is shown in Fig. 2a-d. Dashed lines indicate the
corresponding distributions after excluding the cluster members of IC 4665
defined by Alcaino (1965). After correcting the magnitudes for interstellar
absorption the basic convolution equation of stellar statistics
A(m) =Integral from -infinity to +infinity D(y) Phi (m-y)dy
can be solved separately for each subgroup. As usual, A(m) is the
number of stars in the apparent magnitude interval (m - delta m, m + delta m);
D(y) is the number of stars between distance moduli (y - delta y, y + delta y);
and Phi (m-y) is the luminosity function of a given spectral and luminosity
class. Following McCuskey (1966) the form of Phi is a Gaussian function. Its
mean absolute magnitude and standard deviation were taken from Allen (1973).
To solve the equation the matrix method described by Dolan (1974) was used.
The densities derived by this method are plotted in Fig. 3a-d. The dashed lines
show the plate limit. Bars indicate the 1 sigma error bars obtained by
Dolan's method.
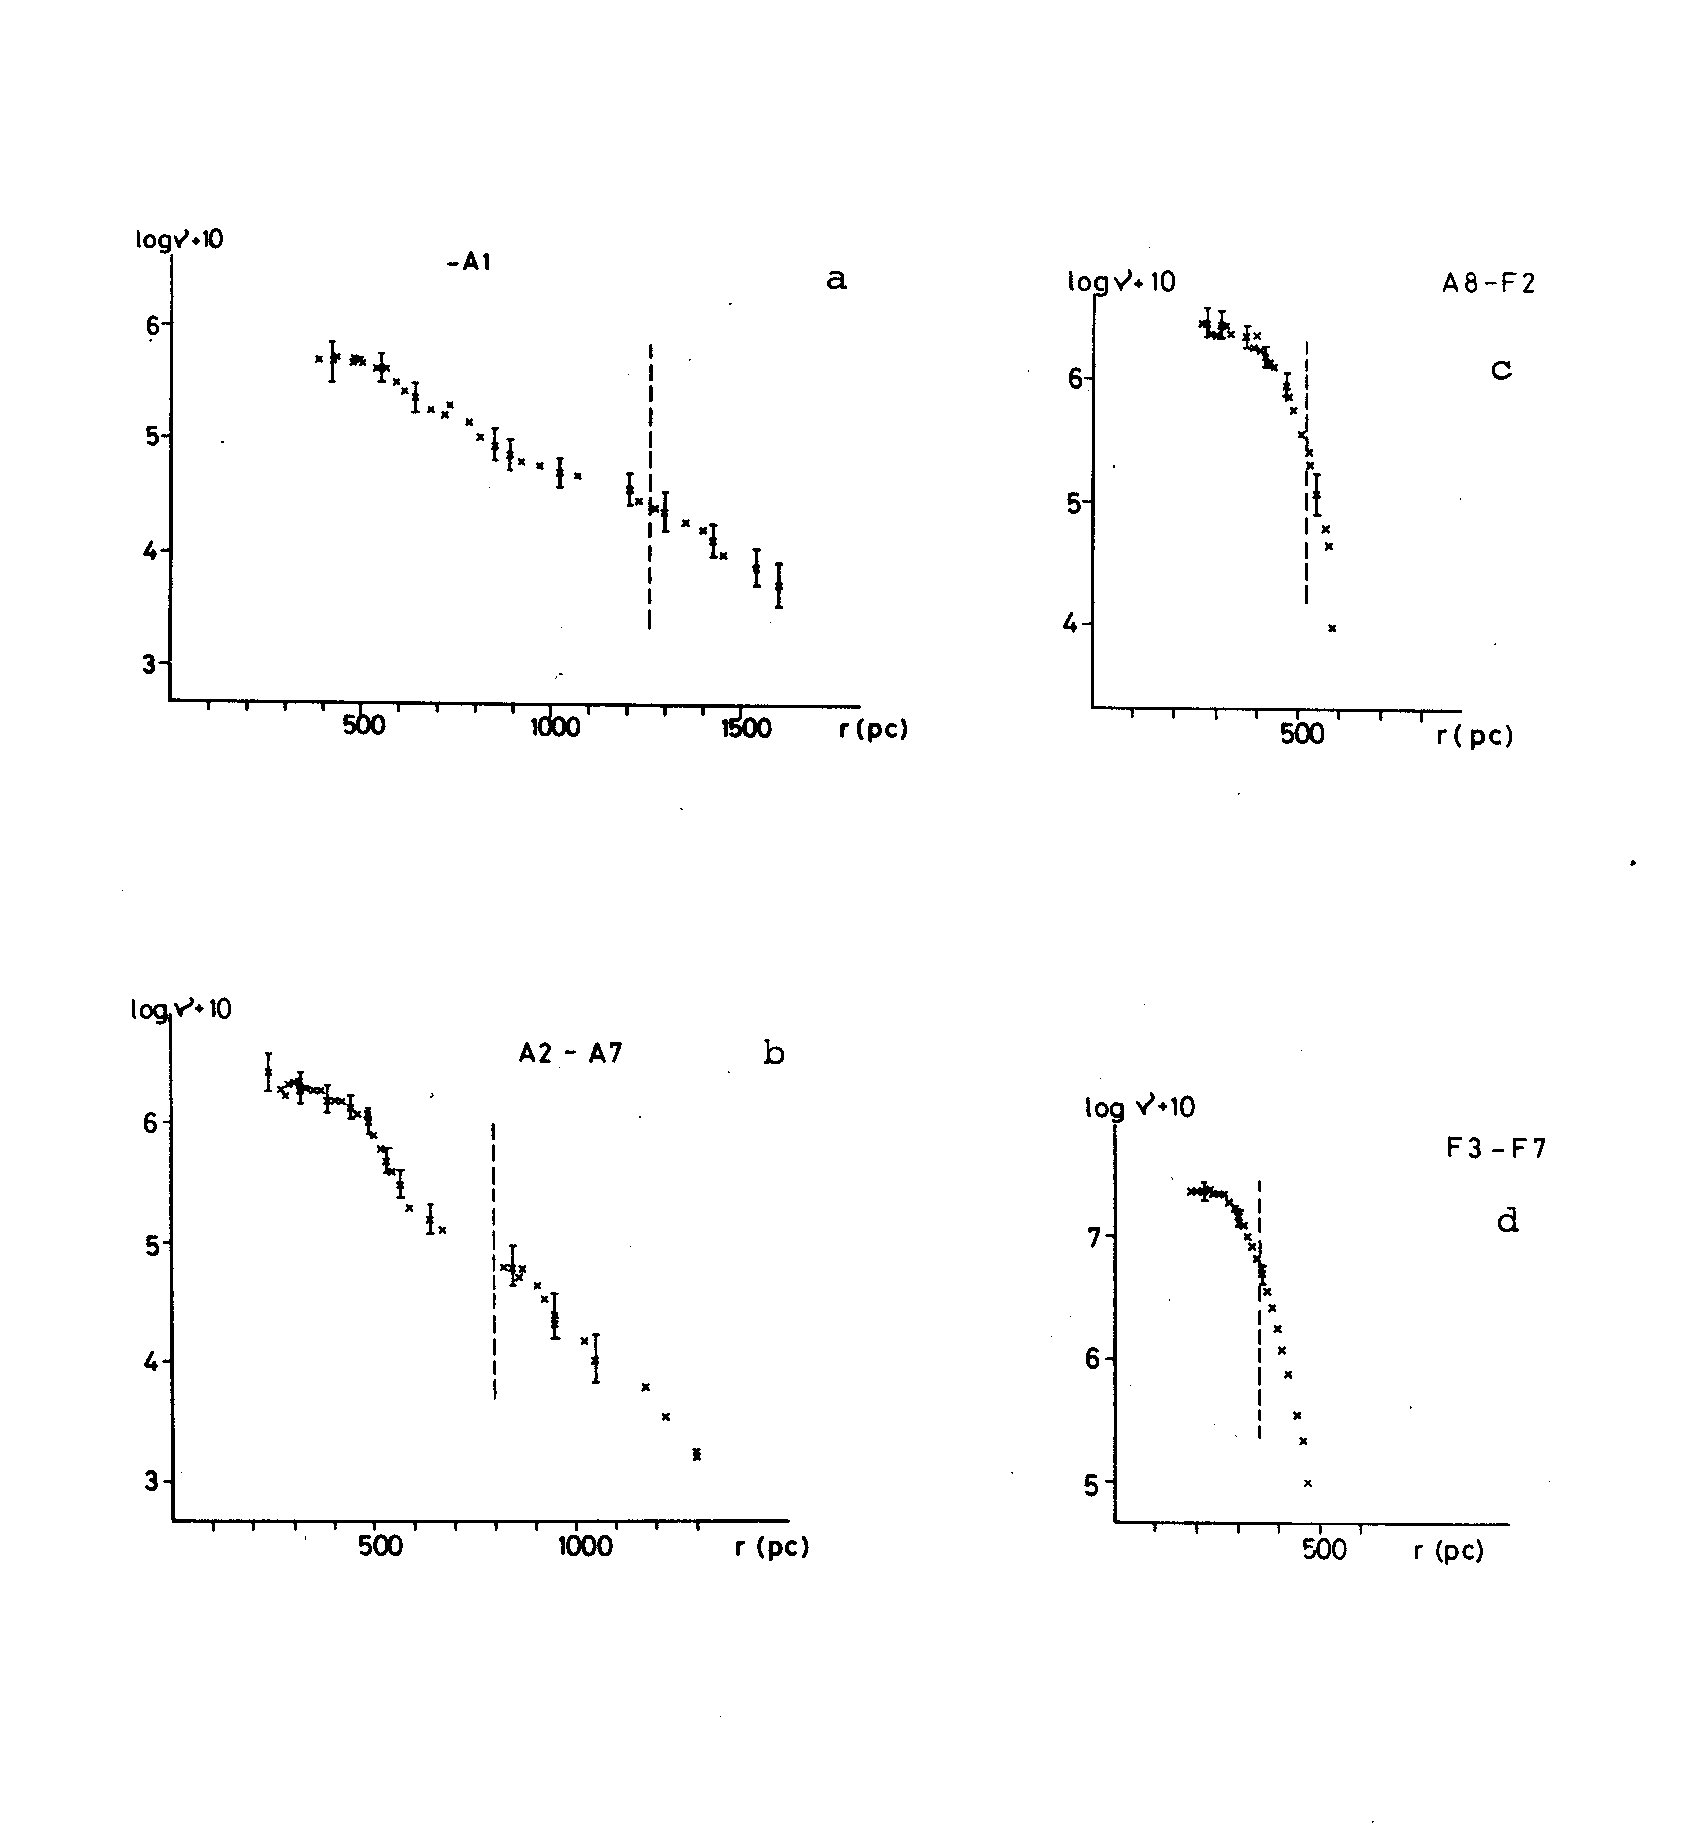 Fig. 3a-d The derived space densities of the different subgroups.
(The dashed lines show the plate limit.)
DISCUSSION OF THE SPACE DENSITIES
Except for the subgroup earlier than A2 the density gradients
(delta nu / delta r) are nearly the same up to 600 pc if the plate limit
allows the determination of space densities up to this distance at all.
At about 600 pc the density gradient of A2 - A7 stars changes and becomes
smaller. The space density of stars earlier than A2 also displays
similar characteristics, i.e. steeper gradient up to 900 pc and a change
to a slower decrease afterwards. The gradient at the first part of the
curve, however, is not so steep as in the case of A2 - A7 stars and it
needs some further remarks. We shall return to this problem later.
As was pointed out previously (Paper I) the spatial distribution of the
A stars near to the galactic poles shows a similar form to stars in some
intermediate latitude galactic fields if the densities in line of sight
were plotted against the corresponding z distances perpendicular to the
galactic plane. The similarity between these distributions and those
obtained by the present investigation therefore suggests that the
density gradients are mainly due to the contributions of the gradients
perpendicular to the galactic plane to the gradients in the line of
sight. This result enables us to compute a relation connecting the
spatial density, the standard deviation of the z velocity component and
the gravitational potential, following the procedure outlined in Paper I.
As a result we could get a curve for (sigma_z(z),z) plane characterizing
the z dependence of sigma_z. In the case of a Gaussian distribution of z
velocities we should get a horizontal line in this diagram because in that
case sigma_z(z) is independent of z. However, after computing the sigma_z(z)
curve according to the procedure of Paper I we obtained the curve displayed
in Fig. 4 for A2 - A7 stars. The curve can be characterized by a slowly
decreasing part up to 140 pc in z and a nearly horizontal part from 170 pc
in z. The two parts are connected by a steep increase. This form of the
sigma_z(z) curve might possibly indicate the coexistence of two kinematically
distinct subsystems with different characteristic velocity dispersions.
The smaller dispersion component deviates somewhat from Gaussian distribution
because the sigma_z(z) curve is not quite horizontal. The larger dispersion
component, however, is fairly Gaussian because of the nearly horizontal
run of sigma_z(z) in that part of the diagram. The density and sigma_z(z)
are dominated by the small dispersion component at z<140 pc because
the small dispersion component has a 5.4 times higher density in the plane
of the Galaxy. At z>170 pc, however, the larger dispersion subsystem dominates
the curves because of its slower density decrease, sigma_z(0) = 7.0 km/sec
has been found in these computations. This value is close to that found
in Paper I for a Lyra field. The run of sigma_z(z) at the small dispersion
component deviates from pure Gaussian behavior. It might be interpreted
by taking it into account that sigma_z(z) is based on the space density curve.
Any systematic error in determining the space densities influences the shape
of sigma_z(z). A very important source of systematic errors in determining
the space densities by means of photometric parallaxes appears to be the lack
of attention given to eliminate the effect of interstellar absorption from
the photometric data. An overestimation of interstellar reddening causes
a steeper and an underestimation a smaller density gradient than the true
gradient in our case. As was mentioned earlier in this work the distribution
of interstellar material is very patchy in this field and the western part
contains more absorbing material than the eastern part. This was the
reason that the effect of interstellar absorption was evaluated for both
parts separately. There was no way of determining the exact boundary
between the lower and the higher absorbing region. We may expect, consequently,
some over- or under-estimation in the absorption data. The absorbing material
is concentrated at distance r<400 pc therefore that part of the space density
curve could be distorted whereas at the remaining part only the distance scale
is changed. The 0.24m overestimation of the absorption corresponding
to 0.08m in E_B-V could account for the decreasing part of the sigma_z(z)
curve. One could explain in this way the deflection of the sigma_z(z)
curve from the pure Gaussian behaviour in the z<140 pc, region. The region
z>140 pc, however, is little affected by absorption so it can be used to
estimate the relative increase of sigma_z between the two subsystems. The curve
shows a 1:1.6 increase which is close to the value (1:1.8) was found in Paper I.
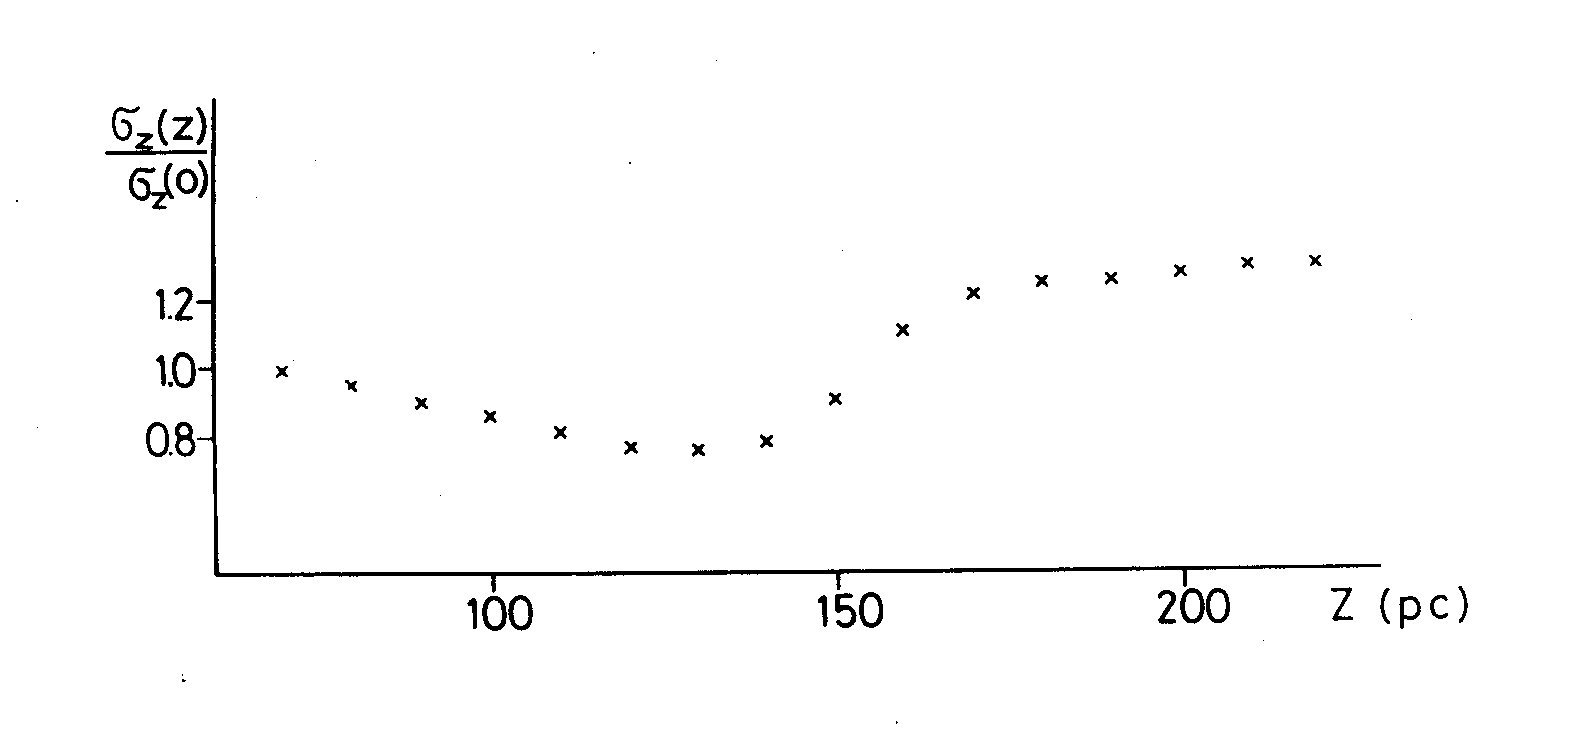 Fig. 4 The sigma_z(z)/sigma_z(0) ratio computed from the density curve
of A2 - A7 stars plotted against the height (z) above the galactic plane.
Let us now return to discuss the space density curve of stars younger than
A2 in more detail. If one computed the sigma_z(z) plot in this case, following
the procedure applied for A2 - A7 stars, one has sigma_z(0) = 10.2 km/sec - a
value which is a factor of 1.5 - 2 higher than was measured by direct
kinematical methods for early type stars. Moreover the percentage of the
larger dispersion component is somewhat higher (13%) contradicting what is
expected for these stars. It is worth while to discuss two points which might
have some significance.
1. The uncertainties in determining the absolute magnitudes of early
type stars is somewhat higher than in stars having spectral types
later than A2 because of the lack of good classificational criteria
on our small scale spectra. The photometric Q method was applied to
remove this uncertainty but a systematic error of one subclass could
still remain. One subclass error corresponds to about 0.5m at late B type
stars and could satisfactorily explain a 1.26 times higher scale.
2. The possible scaling error could not explain the higher percentage
of larger velocity dispersion stars among our early type stars in the
galactic plane as was obtained in our calculations. The relative density
of the two subsystems, namely, is invariant to the scale changes. The
interpretation of density curves in terms of velocity dispersions
perpendicular to the galactic plane was based on the assumption
that the observed density gradients were mainly due to the contributions
of z gradient related in the line of sight. This assumption seemed not to
work in this area. Stothers and Frogel (1974) pointed out that the
system of B type stars within 1000 pc from the Sun is composed of two
subsystems: stars concentrating to the galactic plane and stars
concentrating to a plane bending about 18deg +-1deg to the plane of our
system. These latter stars form the Gould belt. The Gould belt passes
the northern part of our area surveyed and could therefore influence the
space distribution of stars earlier than A2. The space distribution of
stars later than A2, however, shows no signs of such influence
because their density curve fits well to the curves observed in other
galactic directions not affected by the Gould belt.
CONCLUSIONS
The uneven distribution of interstellar material in our field causes
difficulties in eliminating the effect of interstellar absorption on
photometric data. The shape of the space density curve of the A2 - A7 type
stars reveals the existence of two kinematically distinct subsystems with
different dispersions perpendicular to the galactic plane. The main
characteristics of these subsystems are close to the values found in previous
works in other galactic directions. The interpretation of space density curve
of stars earlier than A2, in terms of the subsystems mentioned above, is not
a simple matter because of the possible photometric distance scale error and
the interference by the Gould belt.
ACKNOWLEDGEMENTS
The authors are indebted to Dr. M. Kun for valuable advice in space
density computations. They are grateful to Mrs. I. Kalman, Mr. I. Toth and
Mr. L. Sturmann for their assistance in photometric measurements and
analysing the data.
Budapest-Szabadsaghegy, 15 October 1982
REFERENCES
Alcaino, G., 1965, Bull. Lowell Obs. No. 7. 167.
Allen, C.W., 1973, Astrophysical Quantities 3rd.ed., Athlona
Press, London.
Balazs, L.G., 1975, Mitt.Sternwarte Ung.Ak.Wiss. No. 68. (Paper I) [CoKon No. 68]
Becker, W., 1963, Application of Multicolor Photometry in "Basic
Astronomical Data", ed. K.Aa. Strand, Univ. Chicago
Press, p. 241.
Borzov, G.G., 1973, Astr.Zhu. 50. 1041.
Dolan, J.F., 1974, Astron. and Astrophys. 35. 105.
FitzGerald, M.P., 1968, Astron.J. 73. 983.
Hogg, A.R. and Kron, G.E., 1955, Astron.J. 60. 365.
Kurochkin, N.E., 1958, Astr.Zhu. 35. 86.
McCuskey, S.W., 1966, Vistas in Astronomy 7. 141.
Oort, J.H., 1932, B.A.N. 6. 249.
Seitter, W.C., 1975, Atlas for Objective Prism Spectra; Bonner
Spectral Atlas II. Ferd. Dummler Verlag, Bonn.
Slettebak, A. and Stock, J. 1959, Astr. Abhandlungen der Hamburger
Sternwarte Bd. V. Nr. 5.
Stock, J., 1971, Application of Objective Prism Techniques in
the Magellanic Clouds in "The Magellanic Clouds",
ed. A.B. Muller, D. Reidel Publishing
Co., p. 181.
Stothers, R. and Frogel, J.A., 1974, Astron.J. 79. 456.
Upgren, A.R., 1962, Astron.J. 67. 37.
Upgren, A.R., 1963, Astron.J. 68. 194.
Van Rhijn, P.J., 1960, Pub.Kapteyn Astr.Lab.Groningen No. 61.
Woolley, R., 1965, Motions of the Nearby Stars in "Galactic
Structure", ed. A. Blaauw and M. Schmidt, Univ.
Chicago Press, p. 85.
Woolley, R. and Steward, J.M., 1967, MN. 136. 329.
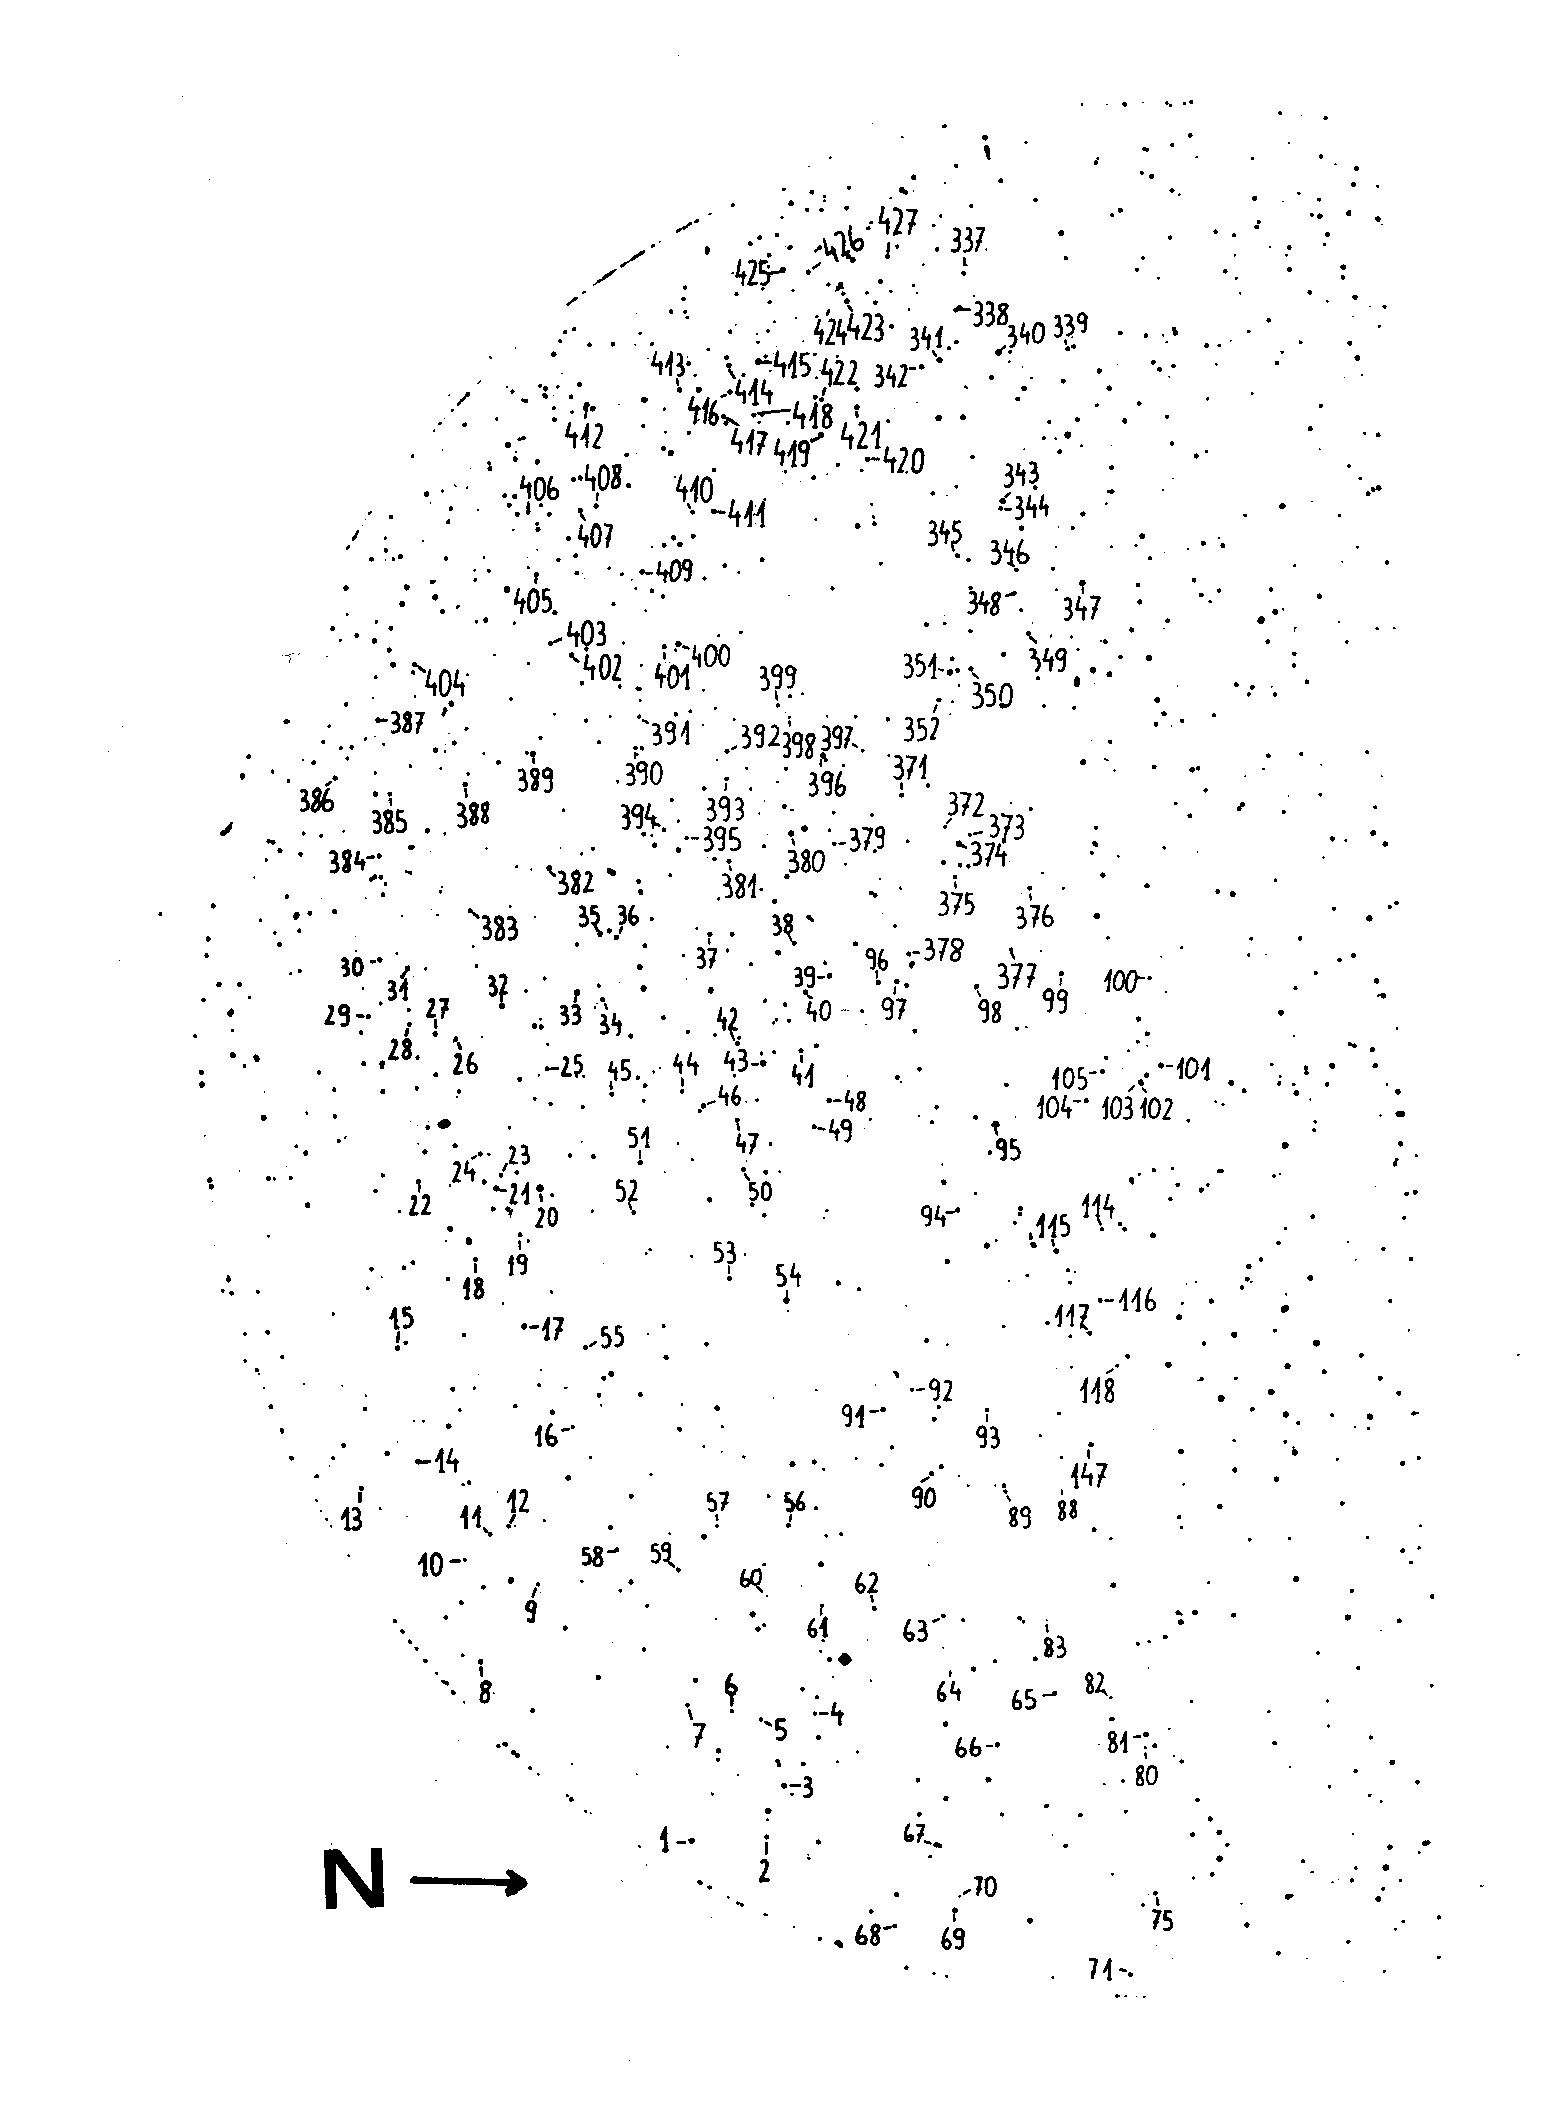 Finding chart of the survey stars
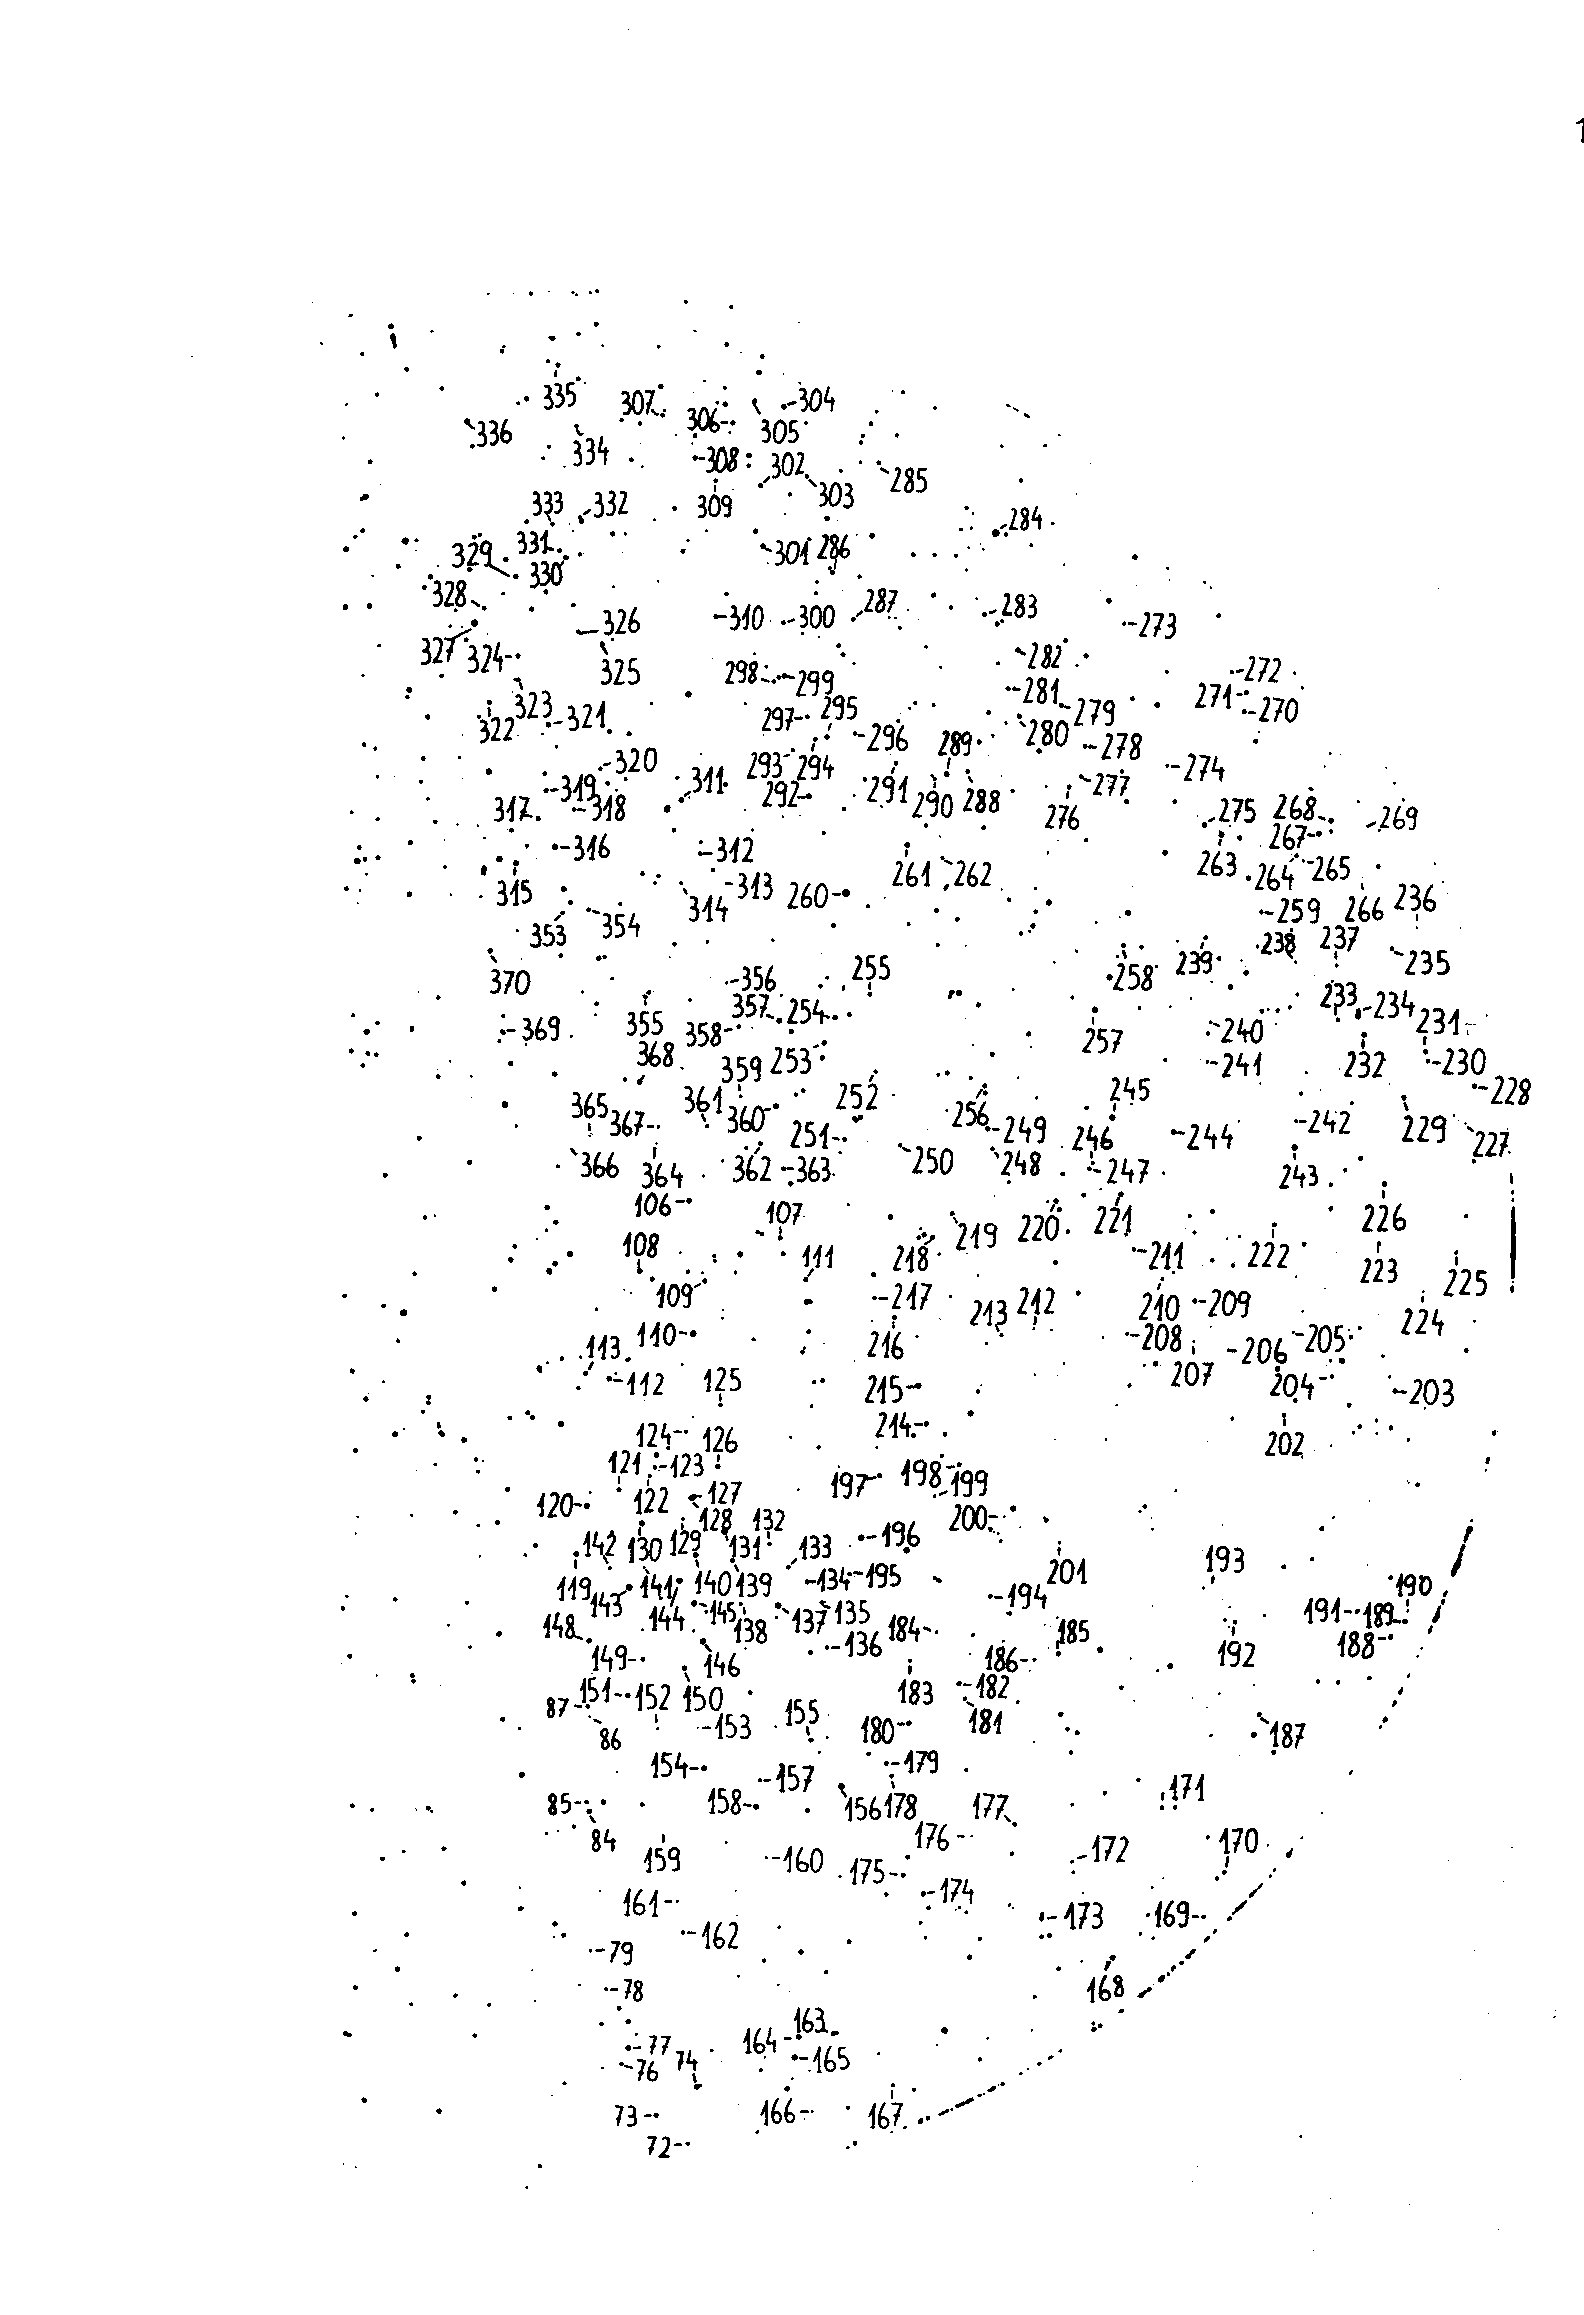 Finding chart of the survey stars
TABLE
Spectra and UBV data of survey stars
No. Sp. V B-V U-B remarks
1 A3 8.45 0.42 0.07 BD +4deg 3481
2 A4 11.56 0.52 0.05
3 F7 9.00 0.75 0.13 BD +4deg 3483
4 F4 11.94 0.79 -0.07
5 A2 12.24 0.47 0.02
6 F3 11.72 0.81 -0.02
7 F2 11.62 0.70 0.19
8 B6 9.92 0.33 -0.25 BD +3deg 3480
9 A2 11.87 0.65 0.15
10 A0: 12.45 0.42 -0.10
11 F5 11.72 0.64 0.14
12 A8 12.06 0.68 0.09
13 F7: 11.28 0.99 0.01
14 A1 9.82 0.47 0.16 BD +3deg 3485
15 B8 11.45 0.21 -0.22
16 F2: 12.39 0.64 -0.01
17 F6 10.08 0.86 0.23 BD +3deg 3490, blend
18 F2: 11.51 0.92 -0.08
19 F3: 11.50 0.91 -0.01
20 B6 6.32 0.22 -0.10 BD +3deg 3493
21 F5 9.02 0.56 -0.03 BD +3deg 3492
22 F2 11.54 0.65 -0.15
23 B9 12.07 0.29 -0.08
24 A6 10.96 0.50 0.17
25 F6 11.44 0.75 0.03
26 F4: 11.96 0.69 -0.23
27 A9 11.15 0.43 0.09
28 F5: 11.92 0.67 -0.17
29 F3 11.71 0.54 -0.16
30 F3 11.03 0.60 -0.09
31 A7 10.73 0.43 -0.03 BD +3deg 3506
32 F6 9.80 0.62 -0.15 BD +3deg 3504
33 A8 8.24 0.33 -0.07 BD +3deg 3505
34 F5 11.09 0.78 -0.02
35 B6 10.68 0.10 -0.55 BD +3deg 3533, blend
36 F6 10.31 0.78 0.07 BD +4deg 3532
37 A3 10.41 0.39 -0.05 BD +4deg 3531
38 F6 11.15 0.65 -0.14
39 F6 10.78 0.60 -0.26
40 A5 10.64 0.31 -0.04 BD +4deg 3521
41 F3 10.83 0.76 -0.07
42 A2 11.49 0.58 -0.14
43 F3 7.41 0.44 -0.07 BD +4deg 3517
44 F3 11.95 0.41 0.04 blend
45 A1 11.67 0.39 -0.02
46 A3 10.46 0.38 0.08 BD +4deg 3515
47 F4 11.20 0.68 0.02
48 A6 10.33 0.34 0.12 BD +4deg 3516
49 A9 10.60 0.64 0.09 BD +4deg 3514
50 A4 11.25 0.65 0.04 BD +4deg 3513
51 F2 11.51 0.76 -0.13
52 A1 11.74 0.62 0.07
53 F5 11.07 0.85 0.10
54 A9 7.94 0.45 -0.07 BD +4deg 3506
55 B9 11.51 0.61 0.06
56 F3 11.47 0.84 0.03
57 A2: 12.53 0.25 0.19
58 F7: 11.44 0.88 0.01
59 F0 11.40 0.71 0.18
60 F2: 12.64 0.59 -0.08
61 F7: 11.55 0.96 0.15
62 F2 10.84 0.75 0.08
63 F6 10.36 0.80 0.18 BD +4deg 3492
64 B6 12.29 0.74 -0.04
65 F7 9.75 0.73 0.25 BD +5deg 3459
66 F5 10.99 0.71 -0.05
67 A7 10.16 0.52 0.13 BD +4deg 3480
68 F4 10.66 0.54 0.14 BD +4deg 3475
69 A7 9.28 0.53 0.14 BD +4deg 3477
70 A1 12.33 0.20 0.08
71 F6 10.44 0.38 0.14 BD +5deg 3445
72 F7 10.60 0.50 -0.05
73 F7 9.63 0.48 0.22 BD +5deg 3446
74 A7 9.48 0.42 0.12 BD +5deg 3449
75 F6 11.48 0.63 0.18
76 F2 11.90 0.52 -0.17
77 B4 8.78 0.23 -0.53 BD +5deg 3450
78 F5 11.46 0.66 -0.10
79 A1 11.54 0.54 -0.05
80 A8 11.60 0.81 -0.12
81 F0 9.22 0.46 -0.01 BD +5deg 3457
82 F4 11.44 0.67 0.23
83 A6 11.77 0.70 0.02
84^+o B6 8.77 0.07 -0.22 BD +5deg 3465
85^o A1 10.38 0.29 0.10
86^o F6 11.32 0.69 0.02
87 F4 10.74 0.59 0.08
88 A1: 12.95 0.24 -0.42
89 F6 11.06 0.74 0.13
90 A7 11.27 0.51 0.13
91 F6 9.45 0.72 0.24 BD +4deg 3502
92 F7: 11.88 0.73 0.05
93 F7 11.24 0.79 0.17
94 F2 11.10 0.59 -0.04
95 F1 7.49 0.47 0.06 BD +5deg 3505, blend
96 F1 10.51 0.47 -0.08 BD +4deg 3523, blend
97 A1 10.33 0.27 0.12 BD +4deg 3524
98 F2 10.61 0.67 -0.07 BD +4deg 3525
99 B9 10.64 0.24 -0.04
100 F5 11.61 0.58 -0.21
101 A6 8.73 0.32 0.01 BD +5deg 3512
102 A4 10.48 0.56 -0.25 BD +5deg 3509
103 F7 10.43 0.38 0.01
104 A2 10.84 0.34 -0.05 BD +5deg 3506
105^o A2 10.42 0.35 -0.17
106 A1 9.91 0.09 0.02 BD +5deg 3518
107 A2 10.80 0.31 -0.05
108 A6 9.20 0.42 -0.11 BD +5deg 3510
109 A1 10.30 0.33 0.01 BD +5deg 3507
110^o B7 7.66 0.01 -0.71 BD +5deg 3504
111 F5 9.97 0.42 -0.21 BD +6deg 3541
112 F2 10.69 0.49 0.08 BD +5deg 3502
113 F6 11.21 0.64 -0.17
114 F5 11.72 0.61 0.02
115 A0 10.38 0.19 0.10 BD +5deg 3499
116 A0 10.85 0.31 0.10 BD +5deg 3495
117 A1 10.76 0.55 0.29 BD +5deg 3492
118 F7: 11.88 0.76 -0.01
119 F5 7.95 0.47 -0.10 BD +5deg 3488
120^o B7 9.05 0.06 -0.44 BD +5deg 3493
121 F6 9.84 0.65 0.10 BD +5deg 3496
122^+ A4 10.93 0.41 0.14
123 A2 10.96 0.39 0.14
124 A8 11.76 0.34 0.07
125 F1 12.11 0.23 -0.10
126^o A1 9.97 0.14 0.06 BD +5deg 3497
127^o B9 10.33 0.24 0.16
128^o B6 8.10 -0.02 -0.44 BD +5deg 3494
129 F0 11.62 0.47 0.11
130^+o B7 8.23 0.10 -0.33 BD +5deg 3491
131^o B3 7.24 0.02 -0.64 BD +5deg 3490
132 F6 10.95 0.65 0.13
133^o A7 10.67 0.42 0.23 BD +5deg 3485
134^+o A5 10.61 0.32 0.25
135 F5: 11.68 0.61 0.26
136^+o F5 11.58 0.53 0.00
137 A0 7.57 0.11 0.07 BD +5deg 3481
138^+o F2 11.16 0.47 0.05
139^o A2 10.52 0.28 0.17 BD +5deg 3486
140^+o B8 8.83 0.23 0.13 BD +5deg 3487
141 F3 11.67 0.44 0.11
142 F2: 11.94 0.75 0.20
143^+o B3 6.88 -0.01 -0.61 BD +5deg 3483
144^o B5 7.45 0.01 -0.60 BD +5deg 3484
145^o B4 7.69 0.02 -0.61 BD +5deg 3482
146^o B3 7.80 0.10 -0.61 BD +5deg 3478
147^o A1 9.95 0.39 0.08 BD +5deg 3480
148^o A1 9.18 0.24 0.00 BD +5deg 3479
149 A0 10.22 0.06 0.06 BD +5deg 3477
150^+o A1 9.10 0.17 0.03 BD +5deg 3476
151^+o A3 9.39 0.30 0.21 BD +5deg 3473
152 F6 11.22 0.52 0.08
153 F5 11.79 0.41 -0.02
154^o B7 8.38 0.07 -0.24 BD +5deg 3471
155 F5 10.92 0.53 0.22
156 A6 7.42 0.40 0.15 BD +6deg 3514
157 A8 11.00 0.39 0.06
158^+o B9 7.98 0.06 -0.19 BD +5deg 3466
159 F7: 11.76 0.54 0.10
160 F7 11.22 0.45 0.10
161 F7 11.28 0.60 0.10
162 A0 10.82 0.12 0.19 BD +5deg 3456
163 A9 10.22 0.02 0.18 BD +6deg 3497
164 F7 9.30 0.53 0.09 BD +6deg 3496
165 A6 7.70 0.36 0.16 BD +6deg 3494
166 A9 11.84 0.14 -0.08
167 F5 11.31 0.49 -0.11
168 F5 9.19 0.53 -0.26 BD +6deg 3501
169 F6 10.32 0.56 -0.44 BD +7deg 3444, edge
170 F7 10.81 0.81 0.09 BD +7deg 3448
171 F3 11.23 0.48 0.08 BD +6deg 3513
172 F7: 11.80 0.72 -0.07
173 F5 10.56 0.58 0.13
174 F6 9.62 0.61 0.05 BD +6deg 3507
175 A2 10.12 0.17 0.14 BD +6deg 3508
176 F4: 12.40 0.36 -0.05
177 A2 11.84 0.16 0.10
178 F3 11.29 0.57 0.03
179 A6 11.29 0.49 -0.04
180 A1 10.72 0.17 0.22 BD +6deg 3516
181 F6 11.92 0.38 0.07
182 F2 10.52 0.42 -0.04 BD +6deg 3518
183 F0 11.80 0.55 0.05
184 F4: 11.99 0.51 -0.23
185 A7 10.50 0.40 0.07 BD +6deg 3521
186 F5: 11.92 0.60 -0.25
187 F7 10.80 0.61 0.10
188 A2 10.76 0.44 0.00 BD +7deg 3459
189 F7 8.87 0.95 0.17 BD +7deg 3460
190 A1 11.89 0.29 -0.15
191 F7 11.14 0.56 0.15
192 F7: 12.38 0.65 0.23
193 F7: 12.35 0.46 0.03
194 F2 11.79 0.49 -0.09
195 F6 11.39 0.54 -0.04 BD +6deg 3523
196^o B6 7.88 0.01 -0.77 BD +6deg 3525
197 F6 10.35 0.63 -0.11 BD +6deg 3529
198 A1 11.59 0.25 0.14
199 A0: 12.62 0.17 0.02
200 A3: 12.88 0.06 0.09 blend
201 F7 11.89 0.60 -0.13
202 A1 11.45 0.32 0.36
203 F1 9.98 1.04 0.39 blend
204 F1 11.79 0.42 0.25
205 B9: 12.20 0.30 0.03
206 A0 12.76 0.03 0.03
207 F3 11.87 0.47 0.00
208 F5: 11.67 0.43 0.16
209 A0 10.90 0.23 0.13 BD +7deg 3472
210 F6 11.31 0.58 0.13
211 F7 11.40 0.57 0.30
212 F4: 11.87 0.66 -0.10
213 F7: 11.73 0.51 -0.10
214 A6 10.87 0.37 0.03
215^o A0 9.42 0.10 -0.07 BD +6deg 3533
216 F0 10.73 0.44 0.02 BD +6deg 3539
217 F5 11.45 0.54 -0.17
218 F5 10.04 0.56 -0.14 BD +6deg 3546
219 F4 11.19 0.52 -0.05
220 F5 10.23 0.47 0.08 BD +6deg 3548
221 F3 9.68 0.42 0.24 BD +6deg 3549
222 F1 11.13 0.37 0.26
223 F5 11.07 0.55 0.22
224 F4: 11.61 0.69 0.16
225 F7 10.48 0.50 0.20
226 A1 10.04 0.28 0.30 BD +7deg 3478
227 F5: 11.23 0.56 0.01
228 F6 8.79 0.83 0.55 BD +7deg 3485, edge
229 A0 9.62 0.19 0.18 BD +7deg 3484
230 A2 10.53 0.41 0.08
231 F6 9.20 0.61 0.33 BD +7deg 3486
232 F2 8.74 0.47 0.25 BD +7deg 3487
233 A0 11.20 0.38 0.06
234 A0 10.27 0.11 0.11
235 A5 9.87 0.36 0.28 BD +7deg 3494
236 F6 11.09 0.80 -0.06
237 F6 11.24 0.59 0.18 blend
238 F2 11.66 0.51 0.00
239 A6 11.01 0.39 0.10
240 F4: 12.05 0.51 0.04
241 F5: 11.79 0.53 0.22
242 F7: 11.67 0.56 0.14
243 F6 7.64 0.44 -0.02 BD +7deg 3481
244 F5 10.11 0.49 0.18 BD +6deg 3550
245 A0 8.74 0.15 0.13 BD +6deg 3553
246 F3 11.97 0.54 0.14
247 F7 11.52 0.55 0.20
248 F6 11.79 0.50 0.16
249 F4 10.54 0.50 0.18 BD +6deg 3551
250 A0 12.18 0.31 0.09
251 A8 11.63 0.28 0.00
252 F0 12.04 0.28 -0.27
253 A3 10.12 0.20 0.10 BD +6deg 3557
254 A5 10.15 0.40 0.24 BD +6deg 3559
255 F7 11.37 0.57 0.22
256 F3 10.80 0.48 0.17
257 F5 7.54 0.42 -0.01 BD +6deg 3560
258 F6 10.71 0.55 0.18
259 F3 11.58 0.34 0.26
260 F2 5.70 0.54 -0.10 BD +6deg 3566
261 A2 9.93 0.26 0.20 BD +6deg 3568
262 F5: 12.20 0.53 0.05
263 F7 8.54 0.63 0.07 BD +7deg 3499
264 F6 11.49 0.71 0.07
265 F4: 12.02 0.68 0.01
266 F5: 11.84 0.66 0.19
267 A4 9.28 0.32 0.20 BD +7deg 3490
268 A1 9.90 0.21 0.05 BD +7deg 3502
269 B7: 12.45 0.69 -0.05
270 A8 10.58 0.56 0.28 BD +7deg 3504, blend
271 A1 10.14 0.36 0.32 BD +7deg 3505, edge
272 A5 11.48 0.71 0.11
273 F7 11.48 0.69 0.15
274 A1 12.01 0.45 0.23
275 F0 9.61 0.44 0.28 BD +7deg 3501
276 F4 11.32 0.59 0.12
277 A2 11.77 0.22 0.12
278 A6 11.65 0.43 0.24
279 F5 10.50 0.64 0.15
280 A3 10.22 0.40 0.25 BD +6deg 3573
281 F7 11.12 0.59 0.16
282 A3 10.94 0.37 0.12
283 A6 10.98 0.47 0.17
284 B4 6.19 0.19 -0.36 BD +6deg 3578
285 F2 11.05 0.57 0.27 BD +6deg 3580
286 A3 11.47 0.38 0.13
287 F7: 11.54 0.72 0.24
288 F5 11.65 0.56 0.20
289 A3 9.75 0.30 0.17 BD +6deg 3570
290 F5: 12.55 0.31 0.07
291 F6 11.03 0.82 0.16
292 A4 9.56 0.43 0.22 BD +6deg 3569
293 F7: 11.69 0.71 0.30 blend
294 F4 11.44 0.60 0.08
295 A0 10.37 0.23 0.10 BD +6deg 3572
296 F6 11.76 0.57 0.02
297 F5: 11.65 0.62 0.11
298 F3 11.32 0.65 -0.03
299 A1 10.22 0.15 0.00 BD +5deg 3543
300 F6 11.33 0.73 -0.04
301 F5 10.29 0.50 -0.08 BD +5deg 3548
302 A8 10.30 0.56 0.18 BD +5deg 3550
303 F4 11.68 0.55 0.11
304 F5 9.12 0.63 0.07 BD +5deg 3553
305 F3 11.16 0.61 0.18 BD +5deg 3554
306 F6 10.93 0.71 0.18
307 F7: 11.81 0.70 0.13
308 F0 10.93 0.61 0.12 BD +5deg 3551
309 F6 11.98 0.62 0.10
310 A3 11.02 0.32 0.28
311 A3 9.38 0.38 0.17 BD +5deg 3535
312 F6 11.62 0.63 0.08
313 F7: 14.53 - -
314 F5 12.12 0.49 -0.01
315 F6 9.50 0.68 0.08 BD +5deg 3531
316 B9 9.03 0.23 0.07 BD +5deg 3533
317 F6 11.26 0.47 0.15
318 F7: 11.84 0.69 0.03
319 F6 10.84 0.68 0.11
320 F6 11.72 0.53 0.13
321 F4 9.53 0.62 -0.06 BD +5deg 3540
322 A9 10.95 0.43 0.18
323 A2 12.07 0.27 0.12
324 F6 11.11 0.77 0.07
325 F5 10.68 0.71 0.16
326 A2 11.91 0.27 0.14
327 B3 7.47 0.05 -0.69 BD +5deg 3544
328 F5 11.60 0.48 0.10
329 A3 10.63 0.39 0.11 BD +5deg 3545
330 F2 10.82 0.57 0.20
331 F5 11.44 0.66 0.20
332 F6 10.42 0.71 0.02
333 F4 11.61 0.84 0.07
334 F2 11.94 0.58 0.06
335 A4: 10.90 0.30 0.48 BD +5deg 3559, edge
336 F2 8.85 0.58 0.02 BD +5deg 3552
337 F5 11.31 0.71 -0.03
338 F7 8.65 0.69 0.04 BD +4deg 3558
339 F5 11.54 0.47 -0.05
340 F5 7.55 0.52 -0.25 BD +5deg 3577
341 A1 9.25 -0.03 -0.62 BD +4deg 3557
342 A4 10.95 0.38 0.13
343 F2: 8.87 0.55 0.02 BD +5deg 3541
344 F2 11.57 0.72 -0.05
345 F6 11.39 0.54 0.04 BD +4deg 3547
346 F6 11.63 0.51 -0.01
347 A1 8.89 0.15 -0.10 BD +5deg 3537
348 F7 11.51 0.80 -0.02
349 F3 11.80 0.45 -0.05
350 A1 10.91 0.49 0.00
351 B4 7.88 0.03 -0.68 BD +4deg 3543
352 F6 10.97 0.67 -0.08
353 F6 11.55 0.69 -0.03
354 A1 12.35 0.35 0.16
355 F2 11.38 0.59 0.22
356 A1: 12.27 0.34 0.01
357 A4 9.75 0.35 0.38 BD +5deg 3525, blend
358 F7 10.95 0.62 0.09
359 A0: 12.15 0.35 -0.08
360 F4 8.66 0.48 -0.11 BD +5deg 3520
361 F6 11.37 0.65 -0.05
362 F6 11.33 0.51 -0.10
363 F3 10.97 0.63 -0.13 BD +5deg 3519
364 F7: 12.12 0.65 -0.11
365 F4: 12.36 0.53 -0.17
366 A0 12.98 0.06 -0.10
367 F7 11.84 0.60 -0.08
368 A2 9.60 0.18 0.12 BD +5deg 3523
369 A2 11.65 0.31 0.19
370 F7 9.98 0.71 0.33 BD +5deg 3527
371 A9 11.44 0.60 0.00
372 F7: 12.10 0.67 -0.20
373 F5: 12.15 0.72 -0.18
374 A2 9.18 0.20 0.11 BD +4deg 3539
375 F1 11.63 0.50 -0.25 BD +4deg 3536
376 F4 11.20 0.57 -0.07
377 A1 11.67 0.28 0.11
378 F4 10.94 0.69 -0.20
379 F7: 12.13 0.56 0.08
380 B9 8.78 0.22 -0.12 BD +4deg 3541
381 F6 10.91 0.65 -0.06
382 F7 10.00 0.59 -0.12 BD +3deg 3509
383 F3 11.89 0.55 -0.20
384 F7: 11.55 0.83 -0.13
385 F7: 12.04 0.59 -0.13
386 F7: 11.06 0.92 -0.02
387 F0 10.62 0.58 -0.13
388 F5 10.84 0.68 -0.09 BD +3deg 3513
389 F4 9.70 0.63 -0.01 BD +3deg 3514
390 F7: 11.90 0.96 -0.09
391 F2: 12.20 0.67 -0.32
392 A6 11.48 0.30 -0.05
393 F5 11.56 0.60 -0.12
394 F5: 11.94 0.75 -0.04
395 F2: 12.38 0.44 -0.21
396 A9 8.97 0.37 -0.07 BD +4deg 3542
397 F7: 12.38 0.65 -0.27
398 A2: 13.06 0.33 -0.27
399 F5 12.31 0.54 -0.04
400 F0 9.00 0.37 -0.07 BD +4deg 3545
401 A0 12.19 0.24 0.01
402 F6 11.09 0.74 -0.11
403 F5 11.85 0.69 -0.19
404 A4 11.21 0.33 0.03
405 F0 11.66 0.49 -0.10
406 F2: 11.85 0.67 -0.01
407 F4 10.79 0.59 -0.08
408 A8 11.56 0.49 -0.23
409 A0 11.37 0.07 -0.06 blend
410 F6 12.13 0.61 -0.18
411 F6 11.42 0.60 0.08
412 A5: 11.18 0.54 0.01
413 A4 11.07 0.39 0.12
414 A4 11.28 0.52 0.22
415 B8 8.11 0.21 -0.12 BD +4deg 3556
416 F5: 11.65 0.56 0.03
417 F7: 11.54 0.62 0.14
418 F5: 11.80 0.58 0.09
419 A8 9.54 0.40 0.17 BD +4deg 3551
420 A7 10.64 0.42 0.14 BD +4deg 3550
421 A1 10.98 0.12 -0.30
422 F7: 11.69 0.69 -0.04
423 F6 10.36 0.74 -0.01 BD +4deg 3559
424 F7: 12.72 1.67 0.61 blend
425 B7: 9.02 0.02 -0.47 BD +4deg 3560
426 A6 11.61 0.55 -0.05
427 A3 11.60 0.44 -0.01
Notes to the table:
A cross and a circle at the right upper side of the running number
denotes photoelectrically measured colours and the member of the cluster
according to Alcaino, respectively.
A colon beside the spectral types denotes that the star is classified
from one plate.
Blend is remarked if the photographic image of the measured star is
distorted by a neighbouring star.
Edge is remarked if the star is near the edge of the plate.