- Distance, mass, equilibrium luminosity and effective
temperature
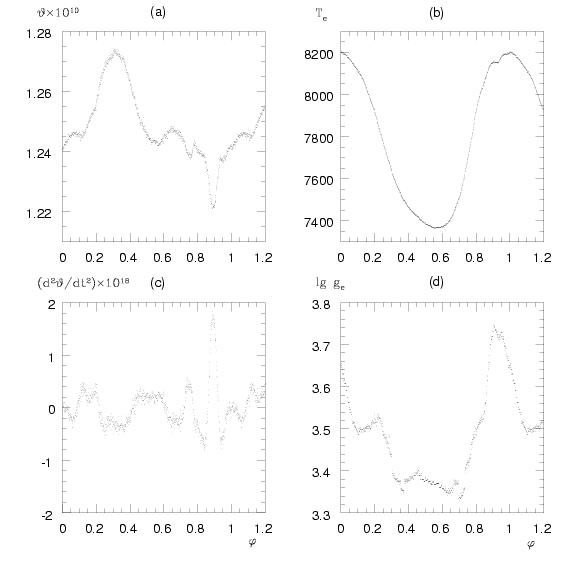
The standstills of the atmosphere were found at
{phi}~0.31,0.56,0.65,0.90
by searching for zero average angular velocity
{overline}{dot}{theta}({phi})~0.
{theta},logge
were averaged here in an interval
{Delta}{phi}~0.02 (i.e. ~10 min).
Table 3 reports the results for some values of
E(B-V)=0.095,[M]=-1.2,-1.0.
The characteristic size of the atmosphere is
~104 km,
Ra << ge,
therefore,
Ra
can be neglected.
<Te({phi})>,Teq
and from pairs of standstills AD,BD,CD the average
d, M, R, Leq
are given in Table 4 to some values of
E(B-V).
The estimated errors from the averaging are in accordance with that
of the interpolation of
logge,
the other quantities propagate negligible errors in
(eq4),(eq5).
Discussion
- Dependence of the physical quantities on reddening
The strong dependence of
Te({phi}),logge({phi})
and the derived
d,M
on
E(B-V)
is a surprising result of this study while the value of
[M]
is of secondary importance.
E(B-V)=0.05±0.02
by Liu & Janes (1990) gives very small
d,M
which cannot be reconciled with our present day theoretical knowledge on
RR Lyrae or other type of pulsating stars. Reddening
E(B-V)=0.07 and 0.09
were suggested
by Hobart et al. (1991) and Hemenway (1975), respectively, our finding is that
E(B-V)=0.09-0.1
is the only possible choice.
- Effective temperature, surface gravity
Te({phi}),logge({phi})
of the present study are significantly higher by some
650 K
and
~0.4
than those of Liu & Janes (1990).
Since essentially the same Kurucz tables were used we attribute the
difference to the different philosophy of the interpolation procedure:
- []
Liu & Janes (1990) determined
ge({phi})=0.6M{sun}G/R2({phi})
from kinematics with assuming the canonical mass
0.6M{sun}
of RR Lyrae stars. Next, one arbitrarily chosen colour index,
V-K
was taken as sole source of
Te({phi})
belonging to
logge({phi})
from the kinematics and
Te({phi})
from the other colour indices were neglected leading to their very low
<Te>=7137 K.
To check this procedure their
Te(B-V),Te(V-RC),Te(V-IC),Te(V-K)
tables were all used for
logge=3,3.5:
according to our opinion no reason can be found to reject any
Te
since the difference was
<=250 K
with no systematically decreasing trend when going more and more to the
infrared indices. Therefore, averaging could have been more appropriate.
Theoretical colour indices differing systematically from
the observed ones by
0.02-0.04 mag correspond to their lower
logge({phi})
values.
- []
In the present study two colour diagrams were used to determine a pair
of
Te({phi}), logge({phi})
simultaneously taking into account the dependence of
Te({phi})
on
logge({phi})
automatically and the small differences
(<=250 K
in
Te,
<=0.11
in
logge)
from the four colour-colour loops justified averaging. This is a
self-consistent procedure trusting on the Kurucz models exclusively.
By using four colour-colour loops, different parts of the whole spectrum
F{lambda}(0)
were sampled in the
{lambda}
interval
360-1000 nm.
- Position in a theoretical HRD, absolute brightness
The values of the fundamental parameters
logTeq=3.891, logLeq=1.452,
M=0.76{sun}
for
E(B-V)=0.095
place T Sex just to the blue edge of the instability strip given by
Tuggle & Iben (1972) and Lee et al. (1990). This position is expected for an
RRc
variable and it was our main argument to accept the large reddening. With
distance
d=530 pc
we get
R({phi}=0.31)=2.99R{sun}, R({phi}=0.91)=2.87R{sun},
and magnitude averaged visual absolute brightness
<MmagV>=1.17±0.26 mag.
These values come purely from atmospheric models which are
trustable to a few percent level and verify figures from stellar structure
calculations. The values
d=578.5 pc and
<MVmag>=1.06±0.38
of Hobart et al. (1991) agree with the present results within the quoted errors. The physical parameters of Liu & Janes (1990),
(0.47M{sun},
d=667 pc,
<Te>=7137 K,
<R>=4.05 R{sun},
<MV>=0.76±0.27 mag
<log ge>=2.98)
are unreliable.
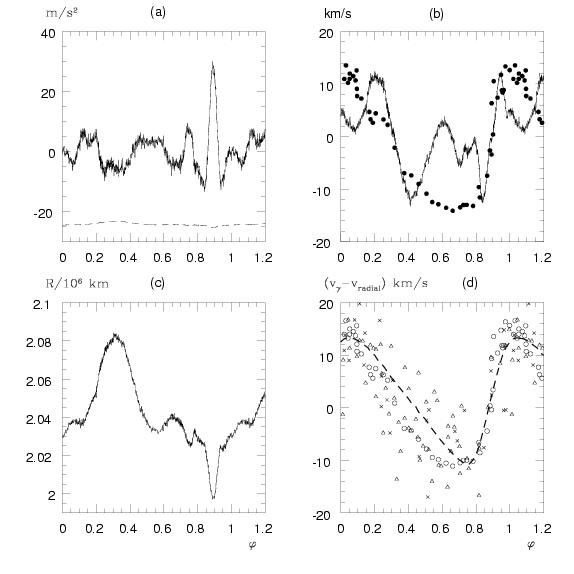
Figs. 3a-c are plots of the variable acceleration, velocity, radius in absolute
units for a pulsation cycle if
d=530 pc.
The sharp undulation of the curves in
0.72 < {phi}< 0.78
is not real, it originates from the interpolation artifact indicated in the
caption to Fig. 2.

Panel (a): line:
ge({phi}),
dashed:
-0.76M{sun}G/R2({phi}).
Panel (b):
{dot}R({phi}),
filled circles: 25-vradial({phi}) from Liu & Janes (1989).
Panel (c):
R({phi}).
Panel (d):
circles:
28-vradial({phi})
from Liu & Janes (1989),
triangles:
38-vradial({phi})
from Barnes et al. (1988),
crosses:
38-vradial({phi})
from Tifft & Smith (1958),
dashed line: mean of
38-vradial({phi})
from Barnes et al. (1988).
The outlier points of panels (a)-(c) at
0.72 < {phi}<0.78
are artifacts of interpolation, they were not smoothed out to
show the effect of eventual uncertainties in the interpolation.
- Open problems
There is a systematic difference in the
vradial({phi})
curves of Barnes et al. (1988), Tifft & Smith (1958), and Liu & Janes (1989):
v{gamma}=38, and 28.0±1.4 km s-1,
respectively, which exceed the expected observational errors. On the basis
of Fig. 3b
v{gamma}=25 km s-1
seems even more probable. The amplitudes
28,24,24 km s-1
of TS58, BM88, LJ89 do not differ significantly.
Fig. 3d shows that subtracting
vradial({phi})
from the different barycentric velocities does not bring the different
observations to full coincidence. The stability of
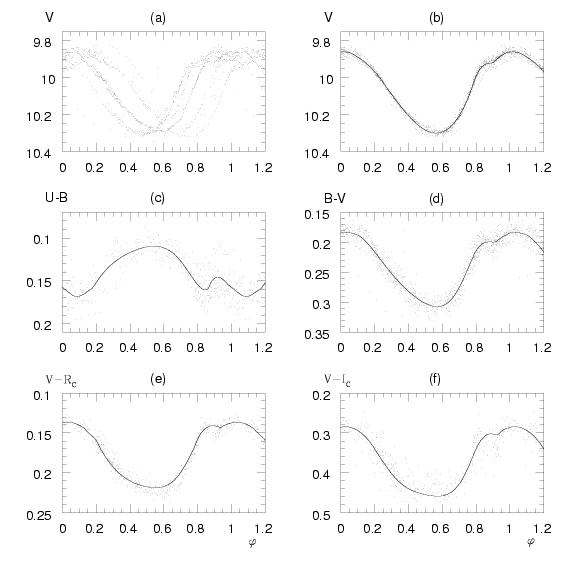
the light and colour curves is, however, obvious from Fig. 1, therefore,
secular change of the shape of
vradial({phi})
seems to be improbable. A variable
v{gamma}
i.e. duplicity cannot be excluded in spite of the large scatter of
vradial({phi})
of TS58, BM88, furthermore, the scatter of
{delta}k
is some 3 hours. This is significantly higher than the imaginable error
of a
{delta}k
value and for its explanation barycentric motion i.e. light-time effect
can even be considered.
On speculation level the extreme sensitivity of the BW
method on
{Delta}v{gamma}
may be guessed as the main source of the discrepant
d
of Liu & Janes (1989) which was propagated into their
M, <R>, <MV>.
Since the radial amplitude of T Sex is only some
{delta}R=80000 km
for a BW analysis
v{gamma}
ought to be known by an accuracy
O(100)m s-2
which was obviously not reached, another factor is their low
Te({phi}).
(Their quoted error
{Delta}v{gamma}=±1.4 km s-1
leads to an error
~±18000 km
in
{delta}R
resulting in an error
{Delta}d/d~0.21.)
The product
pp[v{gamma}-vradial({phi})]
is the comparable quantity with
{dot}R
plotted in Fig. 3b. The spectral lines originate from
0 < {tau}Rosseland < 0.4,
therefore, we expect
pp|v{gamma}-vradial({phi})|<
|{dot}R({phi})|.
It is satisfied if
pp(t)~1,
however, the large scatter of the radial velocities gives weak basis for
this very small value. Remarkable is that the most accurate
radial velocities i.e. those of Liu & Janes (1989) show small humps at the
extreme values of
{dot}R
at
{phi}~0.2,0.4,0.6
and
{dot}Rmax-{dot}Rmin
agrees better with the extreme values of
v{gamma}-vradial
if
v{gamma}=25 km s-1.
The rather loose correlation of
{dot}R
and
25-vradial({phi})
is similar to that found in SU Dra (Barcza, 2003) and it raises a serious
question concerning the basic equation (eq8) of the BW method.
A qualitative explanation can be guessed from gas dynamics and the technique
of measuring radial velocity.
-
{dot}{theta}({phi}),{dot}R({phi})
reflect the motion of
{tau}=0
while the spectral lines originate from the surroundings of
{tau}{lambda}line~0.3.
Non-negligible velocity gradient is definitely
present in an RR Lyrae atmosphere (e.g. Oke et al., 1962) and the limb
darkening integrates the non-uniform motion of the layers
0 < {tau}< 0.5
into a single value
vradial({phi}).
(Dynamical atmospheric models are not available to treat quantitatively
the conversion of the pulsation velocity to
vradial({phi}).)
-
CORAVEL technique is itself accurate for stars of non-variable
spectra while applying it for a variable spectrum may result in systematic
errors which are not easy to survey. The coarse agreement of
vradial({phi})
from spectroscopy and CORAVEL
is obvious in Fig. 3d, however, the large scatter indicates that some
caution is appropriate, especially, since fine details of
{theta}({phi}), vradial({phi})
play some role in a BW analysis.
Conclusions
The purely photometrically derived fundamental parameters of T Sex
(see Table 4) have been found from ATLAS atmospheric models of
Kurucz (1997) and their calibration to stellar photometric systems
(Castelli, 1999). They have been found to be in consensus with our knowledge
on stellar models and pulsation theory of asymptotic giant branch stars.
In addition to bridging over these remote branches of astrophysics
some details have been revealed on RR Lyrae type pulsation: at the
RRc variable T Sex fine structure, definite footprint of two shocks have been
found in the variable stellar radius
R({phi})
(i.e. in the distance of zero optical depth from the stellar centre).
In a previous study of SU Dra similar
details were found concerning the fine structure of the atmospheric
pulsation: there is at least one pair of temporal, intermediate, minor
standstills of the pulsating atmosphere between maximum and minimum
extension. This seems to be a common feature of
RRab and RRc stars at phase
~0.55,
it was not considered (or it was smoothed out) in the previous BW studies,
presumably because it is a sub-oscillation in the upper stellar atmosphere
which is scarcely reflected in the radial velocities. (The radial
velocities give information on the motion of the deeper layers.)
To derive the fundamental parameters the less accurate radial velocity
observations and their problematic conversion to radius changes
had not to be used at all, however, an indication of eventual
variable barycentric velocity of T Sex has arisen.
Acknowledgements This research has made use of SIMBAD database operated at CDS,
Strasbourg, France and ADS of NASA. The author is grateful to J. M.
Benkö for comments on the text.
References
Barcza, S., 2002, A&A, 384, 460
(2002A&A...384..460B)
Barcza, S., 2003, A&A, 403, 683
(2003A&A...403..683B)
Barnes, T.G. III, Moffett, T.J., Frueh, M.L., 1992, PASP, 104, 514
(1992PASP..104..514B)
Barnes, T.G. III, Moffett, T.J., Hawley, S.L., Slovak, M.H., Frueh, M.L., 1988, ApJS, 67, 403
(1988ApJS...67..403B)
van Belle, G.T., Ciardi, D.R., Thompson, R.R., Akeson, R.L., Lada, E.A., 2001, ApJ, 559, 1155
(2001ApJ...559.1155V)
Buonaura, B., Caccin, B., Onnembo, A, Russo, G., Sollazzo, C., 1985, Mem. Soc. Astron. Ital., 56, 153
(1985MmSAI..56..153B)
Carney, B.W., Strom, J., Jones, R.V., 1992, ApJ, 386, 663
(1992ApJ...386..663C)
Castelli, F., 1999, A&A, 346, 564
(1999A&A...346..564C)
Decin, L., Vandenbussche, B., Waelkens, K., Eriksson, C., Gustafsson, B., Plez, B., Sauval, A.J., 2003, A&A, 400, 695
(2003A&A...400..695D)
Drake, J., Laming, M., 1995, The Observatory, 115, 118
(1995Obs...115..118D)
Eggen, O.J., 1994, AJ, 107, 1834
(1994AJ....107.1834E)
Epstein, I., Epstein, A.E.A., 1973, AJ, 78, 83
(1973AJ.....78...83E)
ESA, 1997, The Hipparcos Catalogue, ESA SP-1200
Gatewood, G.D., Gatewood, C.V., 1978, ApJ, 225, 191
(1978ApJ...225..191G)
Gratton, R.G., 1998, Mon. Not. RAS, 296, 739
(1998MNRAS.296..739G)
Hanbury Brown, R., Davis, J., Allen, L.R., 1974, Mon. Not. RAS, 167, 121
(1974MNRAS.167..121H)
Hemenway, M.K., 1975, AJ, 80, 199
(1975AJ.....80..199H)
Hobart, M.A., Pena, J.H., Peniche, R., 1991, Rev. Mexicana Astr. Ap., 22, 275
Hoffleit, D., 1982, The Bright Star Catalogue, Yale Univ. Obs.
Kinman, T., Castelli, F., 2002, A&A, 391, 1039
(2002A&A...391.1039K)
Koester, D., Schulz, H., Weidemann, V., 1979, A&A, 76, 262
(1979A&A....76..262K)
Kurucz, R.L., 1997, http://cfaku5.cfa.harvard.edu
Lee, Y.-W., Demarque, P., Zinn, R., 1990, ApJ, 350, 155
(1990ApJ...350..155L)
Liu, T., Janes, K.A., 1989, ApJS, 69, 593
(1989ApJS...69..593L)
Liu, T., Janes, K.A., 1990, ApJ, 354, 273
(1990ApJ...354..273L)
McMahan, R.K., 1989, ApJ, 336, 409
(1989ApJ...336..409M)
Oke, J.B., Giver, L.P., Searle, L., 1962, ApJ, 136, 393
(1962ApJ...136..393O)
Preston, G.W., Paczynski, B., 1964, ApJ, 140, 181
(1964ApJ...140..181P)
Taylor, B.J., 1986, ApJS, 60, 577
(1986ApJS...60..577T)
Tifft, W.G., Smith, H.J., 1958, ApJ, 127, 591
(1958ApJ...127..591T)
Tuggle, R.S., Iben, I. Jr, 1972, ApJ, 178, 455
(1972ApJ...178..455S)
Tüg, H., White, N.M., Lockwood, G.W., 1977, A&A, 61, 679
(1977A&A....61..679T)
 where
d
is the distance to the star,
R
is the radius of
{tau}=0
(Barcza, 2003).
 is practically constant in the atmosphere, i.e. at
r~R,
where
{rho}(r), p(r), M, G
are density, pressure, mass, and the Newtonian gravitational constant,
respectively. The surface gravity,
g(R),
is an important parameter of the static atmospheric models given
conventionally as
log|g|
and it can be used to weigh a star if the stellar radius,
R,
is known.
Relation (eq2) was applied for a number of non-variable stars
enhancing our knowledge on stellar masses: e.g. for white
dwarfs purely from
log|g(R)|
of model atmospheres
and
R
Mwd=0.480±0.014
average mass was derived (McMahan, 1989) for a sample of 53 stars
while other methods gave somewhat larger mass,
Mwd=0.58±0.10
for 64 stars (Koester et al., 1979).
 The fundamental stellar parameters: distance and mass
 (Barcza, 2003) follow from (
 where
{sigma}
is the Stefan-Boltzmann constant,
Teq
differs slightly from the average effective temperature
<Te({phi})>.
Leq,Teq allow to locate a variable star
in theoretical Hertzsprung-Russell diagram: of course on the basis of
[colours-Te, FX]
calibration of the used atmospheric models.
 must be solved for
d
where
pp
is the projection factor of converting radial to pulsation velocity and
v{gamma}
is the barycentric velocity of the star.
Physical input comes from the time-dependent projection factor. A much more
serious uncertainty of kinematic nature is imported in this procedure by
the error
{Delta}v{gamma}.
If
{Delta}v{gamma} << {overline}|v{gamma}-vradial(t)|
a negligible error is propagated into
{delta}R,
however, it is problematic to achieve this desired accuracy
because the observed radial velocities are an integral of the radial
component of true, non-uniform motions in the atmosphere contaminated by
apparent velocity changes from varying opacity during phases of different
compression. The difficulties from the uncertain value of
v{gamma}
could be circumvented by differentiating
pp(t)vradial(t)
and substituting it for
{theta}d
in (
 with
P0=0.3247796±0.0000032
and the values
{delta}k
in Table 2. The summed string length was
{nu}l0(P0,{delta}=0)=0.330
with standard deviation
SD=0.069
magnitude, the folded light curve belonging to it is plotted in Fig. 1a.
Applying the values
{delta}k
of Table 2 reduced
{nu}l(P0,{delta})
to 0.062 with
SD(P0,{delta})=0.012
mag, dots of Fig. 1b are a plot of the folded light curve, its
SD=0.012
does not exceed the expected random error of a
V
point, it is lower than the claimed amplitude 0.028, 0.015 mag for the
second and third periods of T Sex (Hobart et al., 1991). Thus, the conclusion must
be drawn that between
HJD 2434311-2447488
the light curve of T Sex can perfectly be reproduced if
the light curve segments in Fig. 1a are shifted to the
HJDmax
given by (
with
P0=0.3247796±0.0000032
and the values
{delta}k
in Table 2. The summed string length was
{nu}l0(P0,{delta}=0)=0.330
with standard deviation
SD=0.069
magnitude, the folded light curve belonging to it is plotted in Fig. 1a.
Applying the values
{delta}k
of Table 2 reduced
{nu}l(P0,{delta})
to 0.062 with
SD(P0,{delta})=0.012
mag, dots of Fig. 1b are a plot of the folded light curve, its
SD=0.012
does not exceed the expected random error of a
V
point, it is lower than the claimed amplitude 0.028, 0.015 mag for the
second and third periods of T Sex (Hobart et al., 1991). Thus, the conclusion must
be drawn that between
HJD 2434311-2447488
the light curve of T Sex can perfectly be reproduced if
the light curve segments in Fig. 1a are shifted to the
HJDmax
given by (

