Jaan Einasto
Tartu Observatory
Superclusters are the most extensive density enhancements in the
Universe of common origin. Investigation of large systems of
galaxies was pioneered by the study of the Local Supercluster
by de Vaucouleurs (1953) and by Abell (1961) and using
rich clusters of galaxies by Abell (1958) and Abell et al. (1989).
Superclusters consist of galaxy systems of different
richness: single galaxies, galaxy groups and clusters, aligned in
chains (Jõeveer, Einasto, & Tago, 1978; Gregory & Thompson, 1978;
Zeldovich, Einasto, & Shandarin 1982).
New deep galaxy surveys, such as the Las Campanas Galaxy Redshift
Survey, the 2 degree Field Galaxy Redshift Survey (2dFGRS, Colless
et al., 2001, 2003), and the Sloan Digital Sky Survey
(SDSS, Adelman-McCarthy et al. 2006) cover large areas in the
sky and are almost complete up to fairly faint apparent magnitudes.
Thus these surveys are convenient to detect superclusters using both
galaxy and cluster data. This possibility has been used by
Basilakos (2003), Basilakos et al. (2001), Erdogdu et al. (2004), Porter & Raychaudhury (2005), and Einasto et al. (2003a, 2003b, 2005, 2006a).
The goal of the present review is to analyse properties of superclusters based on the 2dF Galaxy Redshift Survey and the Sloan Digital Sky Survey Data Release 4 by Einasto et al. (2006a, 2006b, 2006c), and to compare properties of real superclusters with theoretical models. 2dFGRS and SDSS supercluster catalogues have been compiled using group catalogues of 2dFGRS and SDSS DR4 surveys, found by Tago et al. (2006a, 2006b). For comparison we use the superclusters found for the Millennium Run mock galaxy catalogue by Croton et al. (2006), that itself is based on the Millennium Simulation of the evolution of the Universe by Springel et al. (2005).
Both real and model superclusters were found using the luminosity density
fields calculated using Epanechnikov smoothing with a radius of 8 h-1 Mpc.
Superclusters were defined as connected non-percolating systems with densities above a certain threshold density. These density fields were normalized to identical mean levels, and all regions above a threshold density 6 (in units of the mean density) were considered as superclusters. The density fields were calculated for a grid step of 1 h-1 Mpc, which allows to investigate the detailed spatial structure of superclusters. The 2dFGRS superclusters were found separately for the Northern and Southern regions of the 2dF Survey, and SDSS superclusters - for the high-declination region of the SDSS DR4 Survey in the Northern hemisphere. The 2dF Northern and Southern regions together contain 544 superclusters, the SDSS Northern survey has 911 superclusters. The comparison model samples have 1733 and 1068 superclusters (the full model sample and the simulated 2dF sample, respectively).
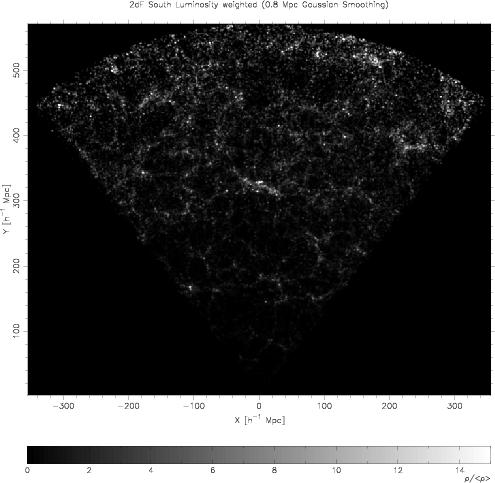
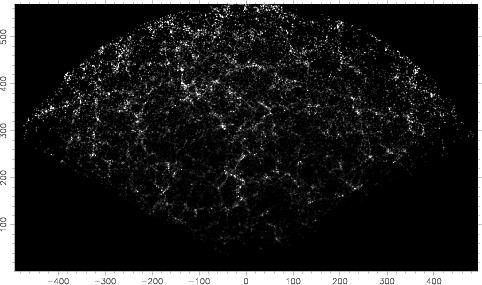
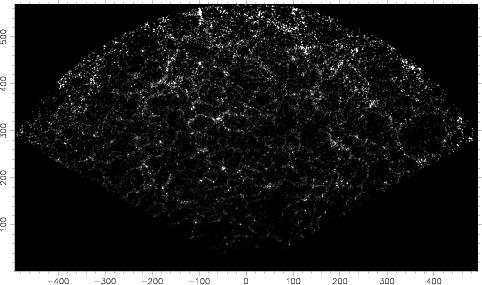
In Figs. fig:1 and fig:2 we show high-resolution density fields on the 2dFGRS and SDSS surveys. All wedges are about 10 degrees thick, thus near to the observer they are thin. These figures show the cosmic web - a continuous network of galaxy systems of various luminosity densities, and voids between them. All luminous regions seen in these figures are superclusters. We see that they have very different richness, some are very small and resemble the Local Supercluster around the Virgo cluster, some are large and very rich.
For all superclusters their geometric and physical properties were found.
Among the geometrical properties are the position (RA, DEC, and distance), the size, and the offset of the geometrical center from the dynamical one, defined as the center of the main (most luminous) cluster. The physical properties are the mean and maximum luminosity densities, the total luminosity and the luminosity of the main cluster and of the main galaxy (the brightest galaxy of the main cluster).
Comparison of properties of model superclusters with properties of
real superclusters shows that they are very similar. Superclusters consist of
several chains (filaments) of galaxies, groups, and clusters. These chains have various length, thus superclusters are asymmetrical in shape. The degree of asymmetry is higher in rich superclusters. Rich superclusters are also denser and contain luminous knots - high-density nuclei.
One important property of superclusters is different in real and model samples - the supercluster richness. To characterise the richness we used two independent characteristics: the total luminosity and the number of rich
clusters, i.e. the multiplicity.
The multiplicity was derived from the number of high-density knots of the
density field. We call these knots DF-clusters. The spatial density of
DF-clusters is about twice that of Abell clusters in the same volume, thus the expected number of DF-clusters in superclusters is about twice the number of Abell clusters. Both functions were determined separately for the 2dFGRS and SDSS superclusters, and for the total observational sample.
The total luminosity was calculated by summing the luminosities of galaxies
and clusters of galaxies inside the density contour, which defines the
boundary of the supercluster. In our case the threshold density was chosen to
be 6 (in units of the mean density). In calculating total luminosities we
used weights for galaxies which take into account the galaxies outside the
observational luminosity window of a survey. To avoid complications due to
the use of different color systems and mean luminosities, we used
relative luminosities, normalized by the mean luminosity of poor
superclusters, i.e. the superclusters that contain only one DF-cluster.
For model samples we calculated these functions for two cases. One sample
uses all model galaxies and can be considered as the ``true'' model sample.
The second model sample simulates the 2dF sample, where an ``observer'' was
put into one corner of the sample, and only these galaxies were included,
which satisfy the same selection criteria as used in the real 2dF sample.
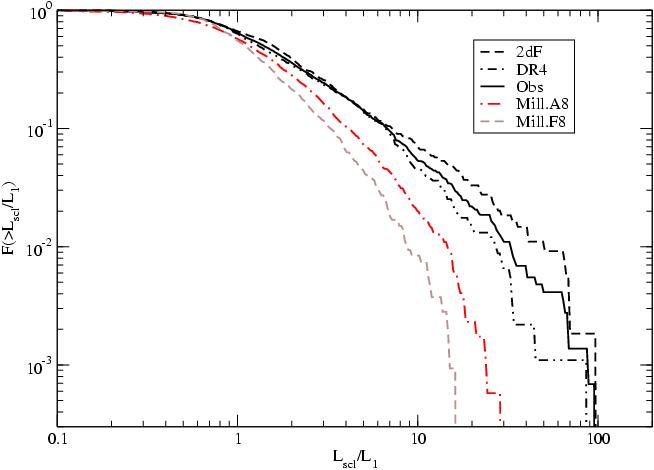
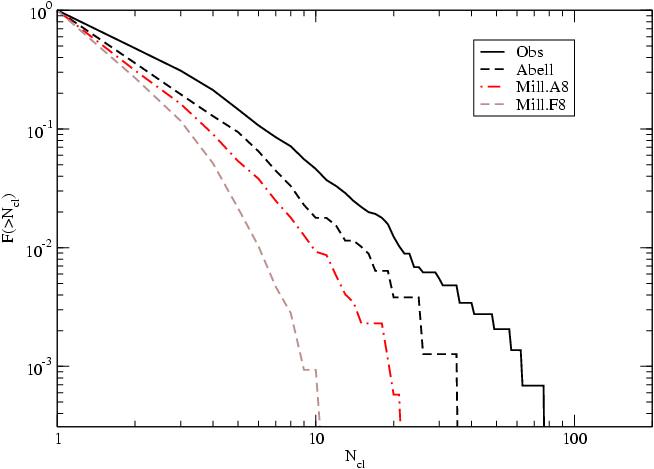
The luminosity and multiplicity functions of real and model samples are
compared in Fig. fig:3. We see that both functions show much more rich
superclusters for real samples than for model samples. This difference is the major cosmological result of the analysis of our supercluster survey. The presence of very rich superclusters in our vicinity is well known; good examples are the Shapley Supercluster and the Horologium-Reticulum Supercluster (see Fleenor et al., 2005; Proust et al., 2006; Nichol et al., 2006; Ragone et al., 2006, and references therein). But until recently the number of such extremely massive superclusters
was too small to make definite conclusions about their abundance.
When comparing models with observations we have to use the simulated 2dF
sample, which is formed using the same selection criteria as used for the
observational sample. The most luminous simulated superclusters of this
sample have a relative luminosity of about 15 in terms of the mean luminosity
of richness class 1 superclusters, whereas the most luminous superclusters of
real samples have a relative luminosity about 100, i.e. they are about 6 times more luminous. The richest model superclusters have a multiplicity of 10, whereas the multiplicity of the richest real superclusters is over 70. The number of Abell clusters in the richest Abell supercluster is 34 (Einasto et al., 2001).
Figures fig:1 and fig:2 show that very luminous superclusters are
located in all subsamples (the Northern and Southern regions of the
2dFGRS, and in subregions of the SDSS DR4 sample, if divided into 3 wedges of
equal width). These subsamples have characteristic volumes of about 10
million cubic h-1 Mpc, whereas model samples of 10 times larger volume have no
extremely rich superclusters.
To check these results we used a number of independent numerical
simulations, carried out for simulation boxes of size of 500 h-1 Mpc and
768 h-1 Mpc, using 5123 Dark Matter particles. We found DM-halos
in simulations, and used them to calculate the smoothed density field as
for real and Millennium Simulation. For all simulations we then found
simulated superclusters as previously, and found the distribution of
dense knots (simulated rich clusters). These calculations confirmed
our previous result: the number of dense knots in simulated
superclusters is much smaller than in real superclusters.
This striking conflict between model and reality needs explanation. In order
to understand the formation of rich superclusters we used wavelet analysis to
investigate the role of density waves of different scales. The á trous
wavelet technique we used allows to divide the density field into components
of various wavelength bands, so that the field is restored by summing all
components. The wavelet analysis was carried out both for real and model
samples.
Our results show that in all cases superclusters form only in regions where large density waves combine in similar local phases to generate high density peaks. Very rich superclusters are objects where density waves of all large scales (up to a wavelength ~250 h-1 Mpc) have similar phases. The smaller is the maximum wavelength of such phase synchronization, the lower is the richness of superclusters.
Similarly, large voids are caused by large-scale density perturbations
of wavelength ~100 h-1 Mpc, here large-wavelength modes combine
in similar local phases to generate under-densities.
Superclusters of galaxies are formed by density perturbations of large scales. These perturbations evolve very slowly. As shown by Kofman &
Shandarin (1988), the present structure on large scales is built-in already
in the initial field of linear gravitational potential fluctuations. Actually they are remnants of the very early evolution and stem from the inflationary stage of the Universe (see Kofman et al., 1987). The distribution of luminosities of superclusters allows us to probe processes
acting at these very early phases of the evolution of the Universe.
There are two possible explanations for the large difference between the
distribution of luminosities of real and simulated samples. One possibility
is that in present simulations the role of very large density perturbations,
responsible for the formation of these very luminous superclusters, is
underestimated. The other feasible explanation of the differences between
models and reality may be the presence of some unknown processes in the
very early Universe which give rise to the formation of extremely luminous
and massive superclusters.
The present review is based on talks held in Budapest on April 20,
2006 in Detre Centenary, in Uppsala University on April 27, 2006, and
in Aspen Workshop on Cosmic Voids on June 6, 2006. I thank my
collaborators Maret Einasto, Enn Saar, Erik Tago, and Volker Müller
for permission to use results of our common work in this review. We
are pleased to thank the 2dFGRS and SDSS Teams for the publicly
available data releases. The present study was supported by Estonian
Science Foundation grants No. 4695, 5347, and 6104, and Estonian
Ministry for Education and Science support by grant TO 0060058S98. I
thank Astrophysikalisches Institut Potsdam (using DFG-grant 436 EST
17/2/05) and Uppsala University for hospitality where part of this
study was performed. 2dFGRS supercluster catalogues are available at
http://www.aai.ee/~maret/2dfscl.html, Sloan DR4 supercluster
catalogues at http://www.aai.ee/~maret/SDSSDR4scl.html.
Abell, G., 1958, ApJS, 3, 211
(1958ApJS....3..211A)
Abell, G., 1961, AJ, 66, 607
(1961AJ.....66..607A)
Abell, G., Corwin, H., Olowin, R., 1989, ApJS, 70, 1
(1989ApJS...70....1A)
Adelman-McCarthy, J.K., Agüeros, M.A., Allam, S.S., et al., 2006, ApJS, 162, 38
(2006ApJS..162...38A)
Basilakos, S., 2003, Mon. Not. RAS, 344, 602
(2003MNRAS.344..602B)
Basilakos, S., Plionis M., Rowan-Robinson, M., 2001, Mon. Not. RAS, 323, 47
(2001MNRAS.323...47B)
Colless, M.M., Dalton, G.B., Maddox, S.J., et al., 2001, Mon. Not. RAS, 328, 1039
(2001MNRAS.328.1039C)
Colless, M.M., Peterson, B.A., Jackson, C.A., et al., 2003, (http://arXiv.org/abs/astro-ph/0306581)
Croton, D.J., Springel, V., White, S.D.M., et al., 2006, Mon. Not. RAS, 365, 11
(2006MNRAS.365...11C)
de Vaucouleurs, G., 1953, AJ, 58, 30
(1953AJ.....58...30D)
Einasto, J., Einasto, M., Hütsi, G., et al., 2003a, A&A, 410, 425
(2003A&A...410..425E)
Einasto, J., Hütsi, G., Einasto, M., et al., 2003b, A&A, 405, 425
(2003A&A...405..425E)
Einasto, J., Einasto, M., Tago, E., et al., 2006a, A&A, (submitted, Paper I, http://arXiv.org/abs/astro-ph/0603764)
Einasto, J., Einasto, M., Saar, E., et al., 2006b, A&A, (accepted, Paper II, http://arXiv.org/abs/astro-ph/0604539)
Einasto, J., Einasto, M., Saar, E., et al., 2006c, A&A, 459, L1
(2006A&A...459L...1E)
Einasto, J., Tago, E., Einasto, M., et al., 2005, A&A, 439, 45
(2005A&A...439...45E)
Einasto, M., Einasto, J., Tago, E., Müller, V., Andernach, H., 2001, AJ, 122, 2222
(2001AJ....122.2222E)
Einasto, M., Tago, E., Jaaniste, J., Einasto, J., Andernach, H., 1997, A&A Suppl., 123, 119
(1997A&AS..123..119E)
Erdogdu, P., Lahav, O., Zaroubi, S., et al., 2004, Mon. Not. RAS, 352, 939
(2004MNRAS.352..939E)
Fleenor, M.C., Rose, J.A., Christiansen, W.A., et al., 2005, AJ, 130, 957
(2005AJ....130..957F)
Gregory, S.A., Thompson, L.A., 1978, ApJ, 222, 784
(1978ApJ...222..784G)
Joeveer, M., Einasto, J., Tago, E., 1978, Mon. Not. RAS, 185, 357
(1978MNRAS.185..357J)
Kofman, L.A., Linde, A.D., Einasto, J., 1987, Nature, 326, 48
(1987Natur.326...48K)
Kofman, L.A., Shandarin, S.F., 1988, Nature, 334, 129
(1988Natur.334..129K)
Nichol, R.C., Sheth, R.K., Suto, Y., et al., 2006, Mon. Not. RAS, 368, 1507
(2006MNRAS.368.1507N)
Porter, S.C., Raychaudhury, S., 2005, Mon. Not. RAS, 364, 1387
(2005MNRAS.364.1387P)
Proust, D., Quintana, H., Carrasco, E.R., et al., 2006, A&A, 447, 133
(2006A&A...447..133P)
Ragone, C.J., Muriel, H., Proust, D., et al., 2006, A&A, 445, 819
(2006A&A...445..819R)
Springel, V., White, S.D.M., Jenkins, A., et al., 2005, Nature, 435, 629
(2005Natur.435..629S)
Tago, E., Einasto, J., Saar, E., Einasto, M., 2006, (in preparation)
Tago, E., Einasto, J., Saar, E., et al., 2006, Astron. Nachr., 327, 365
(2006AN....327..365T)
Vogeley, M.S., Hoyle, F., Rojas, R.R., et al., 2004, in Outskirts of Galaxy Clusters, Proc. IAU Coll. 195, ed. A. Diaferio, CUP, 5
Zeldovich, Ya.B., Einasto, J., Shandarin, S.F., 1982, Nature, 300, 407
(1982Natur.300..407Z)
61602 Tõravere, Estonia 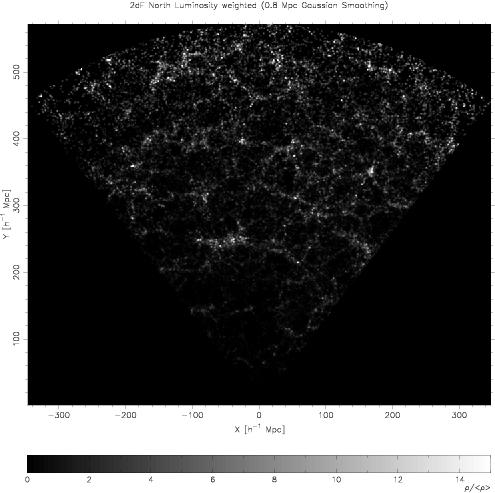
simulation 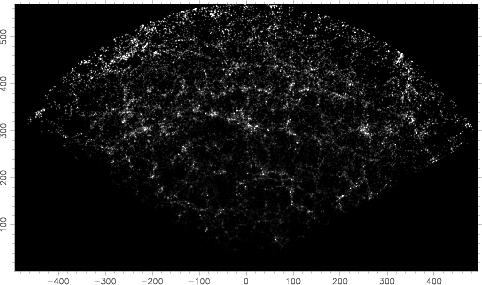
large-scale perturbations are not incorporated in the models, i.e. models
need improvement;
there occurred presently unknown processes during inflation.